Togo emerges as Nigeria’s largest African trading partner in Q2 2025

Key Takeaways

  • Togo leads on both sides of trade, supplying ₦211.99B in imports and receiving ₦811.97B in exports, making it Nigeria’s strongest African partner by value.
  • South Africa ranks second, with imports of ₦115.15B and exports of ₦473.65B, reflecting deep bilateral trade ties.
  • Côte d’Ivoire also features prominently, sending ₦106.15B worth of goods to Nigeria while importing ₦408.97B, showing balanced engagement.
  • West Africa dominates Nigeria’s intra-African trade, with Togo, Côte d’Ivoire, and Ghana collectively accounting for a significant share of regional exports.

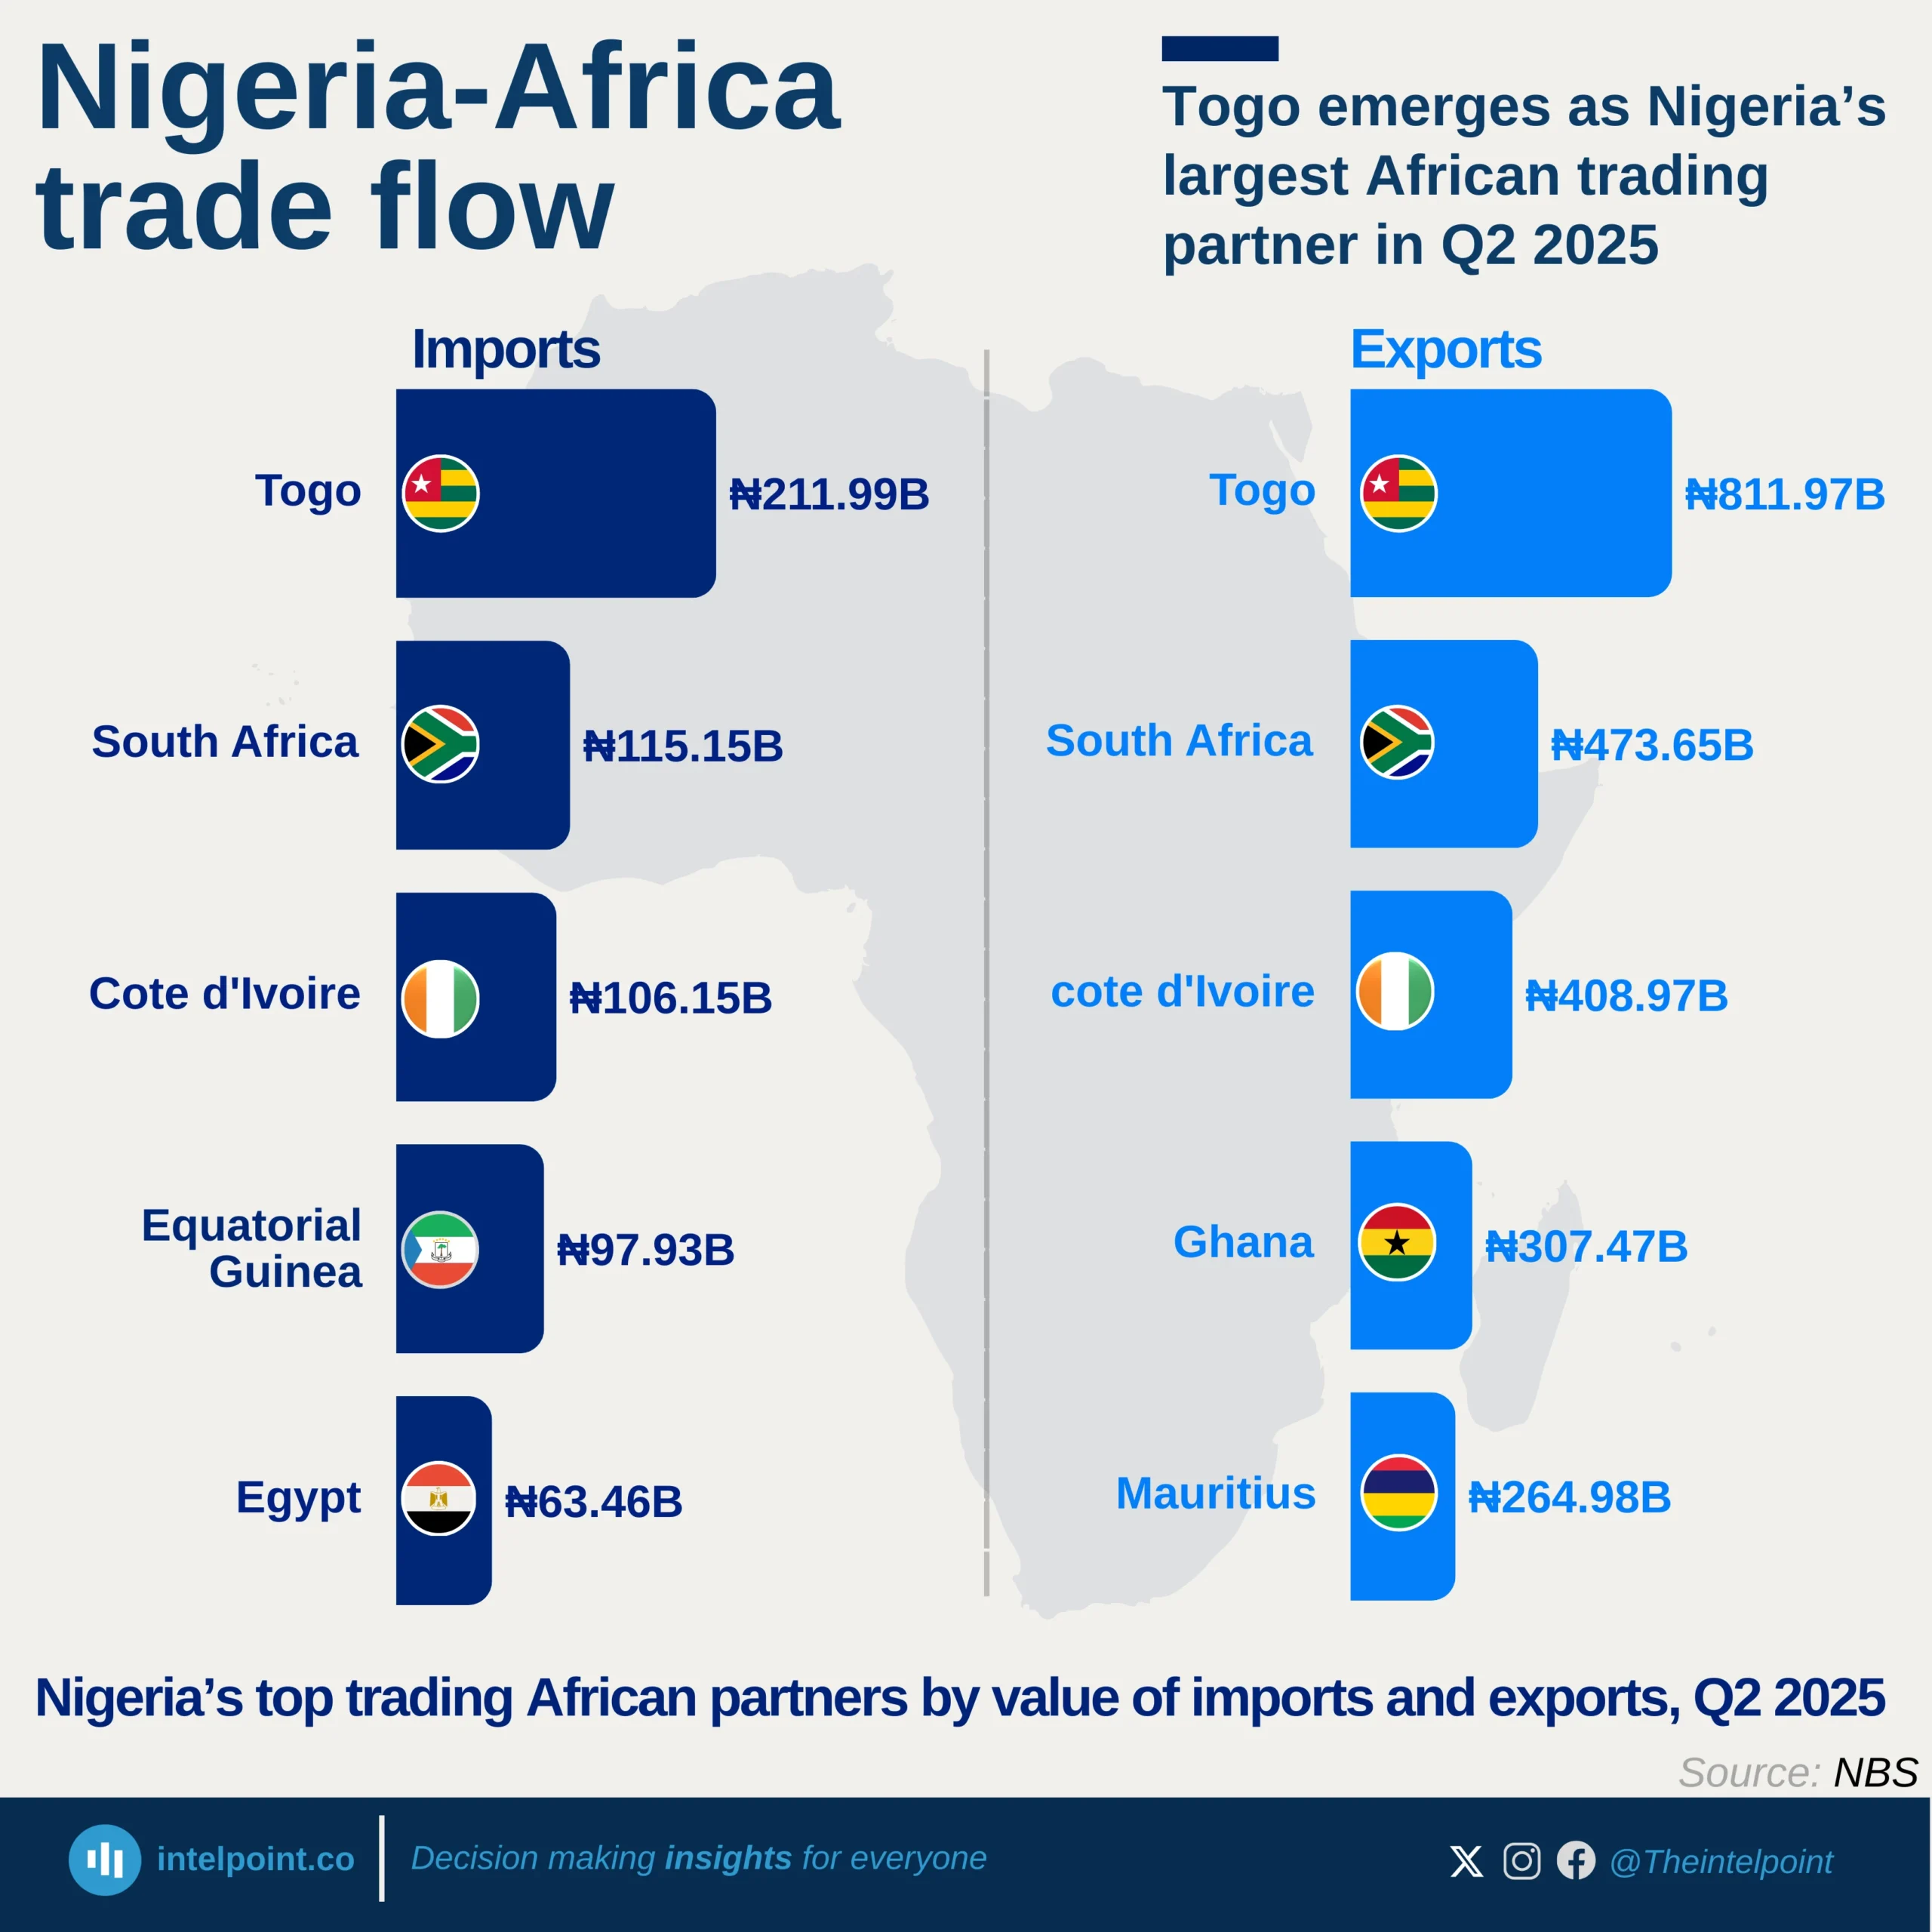
In Q2 2025, Togo emerged as Nigeria’s most significant African trading partner, underscoring its role as both a transit hub and a major destination for Nigerian exports. With ₦211.99B in imports flowing from Togo and ₦811.97B in exports directed to it, the relationship highlights Nigeria’s dependence on regional neighbours for both supply and market access. South Africa followed closely, reflecting its role as a continental economic powerhouse, with ₦115.15B worth of goods entering Nigeria and ₦473.65B leaving in the opposite direction.

Côte d’Ivoire stood out as another key partner, supplying ₦106.15B and receiving ₦408.97B in exports, while Ghana and Mauritius rounded out the list with ₦307.47B and ₦264.98B in Nigerian exports, respectively. The dominance of West African countries, Togo, Côte d’Ivoire, and Ghana, in Nigeria’s top African partners illustrates the strength of regional trade integration under ECOWAS, while South Africa and Mauritius highlight strategic ties beyond West Africa.

Source:

National bureau of statistics

Period:

Q2 2025
HTML code to embed chart
Want a bespoke report?
Reach out
Tags
Related Insights

Agricultural products led Kenya’s 2024 export economy, with coffee, tea, and spices generating $1.7 bn
  • Agriculture dominated Kenya’s exports, with coffee, tea, and spices alone contributing $1.7 billion, the largest single export category.
  • Mineral fuels were a surprisingly strong second, delivering $1.1 billion, and showing Kenya’s growing role in regional fuel distribution.
  • Horticultural exports (flowers, live plants, and trees) contributed $790 million, reinforcing Kenya’s global strength in floriculture.
  • All other export categories fall below $300 million individually, reflecting a long list of small but diverse export segments such as textiles, vegetables, and pharmaceuticals.

Mining led South Africa’s 2024 exports with 18.7%, as gems and precious metals generated over $20 bn
  • Gems and precious metals were the largest single export category, contributing $20.6 billion.
  • Ores and industrial minerals followed closely with $17.2 billion, showing the country’s reliance on mining.
  • Vehicles and machinery were significant non-mineral exports, with a combined $18.3 billion.
  • Agricultural and light industry products like fruits, nuts, and beverages contributed modestly, strengthening mining and manufacturing’s position as the core export drivers.

Cocoa accounted for 4.6% of Nigeria’s 2024 exports, making it the country’s second-largest export after oil
  • Mineral fuels (including crude oil) accounted for $49.3 billion, or 86.8% of total exports in 2024.
  • Non-oil exports remained marginal, with the second-largest item, cocoa, contributing only 4.6%.
  • Fertilisers, ores, slag, ash, and oilseeds collectively made up less than 5%, indicating limited diversification.
  • All other export categories each contributed 1% or less, underscoring Nigeria’s narrow export base.

Nigeria's energy goods imports have stayed low and stable for 7 years, while exports increased from ₦37B to ₦263B
  • Nigeria’s energy goods exports rose from ₦37.3B in 2017 to ₦262.9B in 2024, before falling to ₦154.2B in H1 2025.
  • Imports remained consistently low, ranging from ₦24.2M to ₦353.1M throughout the period.
  • Export growth outpaced imports, showing a widening trade surplus in energy goods.
  • The 2024 spike in exports represents the highest export value within the nine-year window.
  • Energy imports stayed below ₦400M yearly, indicating low dependency on foreign energy goods.

For most of the period (2013-H1 2025), China's share of Nigeria's imports from Asia hovers around 50%-55%, showing dominance
  • China has dominated Nigeria’s imports from Asia, maintaining a 50–55% share for most of the period.
  • China’s share reached its highest level at 58.6% in H1 2025.
  • India's import share remained volatile, ranging between 11% and 25%.
  • Total imports from Asia surged from ₦2.6 trillion in 2013 to ₦16.4 trillion in H1 2025.

Nigeria's agricultural imports' share has been dropping, from 83.9% (2017) to a low of 42.9% (H1 2025)
  • Agricultural imports fell from 83.9% in 2017 to 42.9% in H1 2025, indicating a significant decline in import dependency.
  • Agricultural exports grew from 16.1% in 2017 to 54.0% in 2024, surpassing imports for the first time since 2017.
  • Total agricultural trade increased from ₦1.1 trillion in 2017 to ₦8.2 trillion in 2024.
  • Between 2022 and 2024, the import share dropped significantly from 75.7% to 46.0%.

POPULAR TOPICS
SIGN UP TO OUR NEWSLETTER
Get periodic updates about the African startup space, access to our reports, among others.
Subscribe Here
Subscription Form

A product of Techpoint Africa. All rights reserved