The 2024 Global market capitalisation

  • Apple leads the global market with $3.863 trillion market capitalisation, followed closely by Nvidia at $3.355 trillion and Microsoft at $3.200 trillion.
  • Tesla ($1.385T) remains the most valuable automobile company, far ahead of traditional car manufacturers.
  • The highest-ranked non-tech company, Saudi Aramco, stands at $1.805 trillion.
  • Other trillion-dollar companies span industries such as finance (Berkshire Hathaway – $0.984T) and media (Meta – $1.514T).

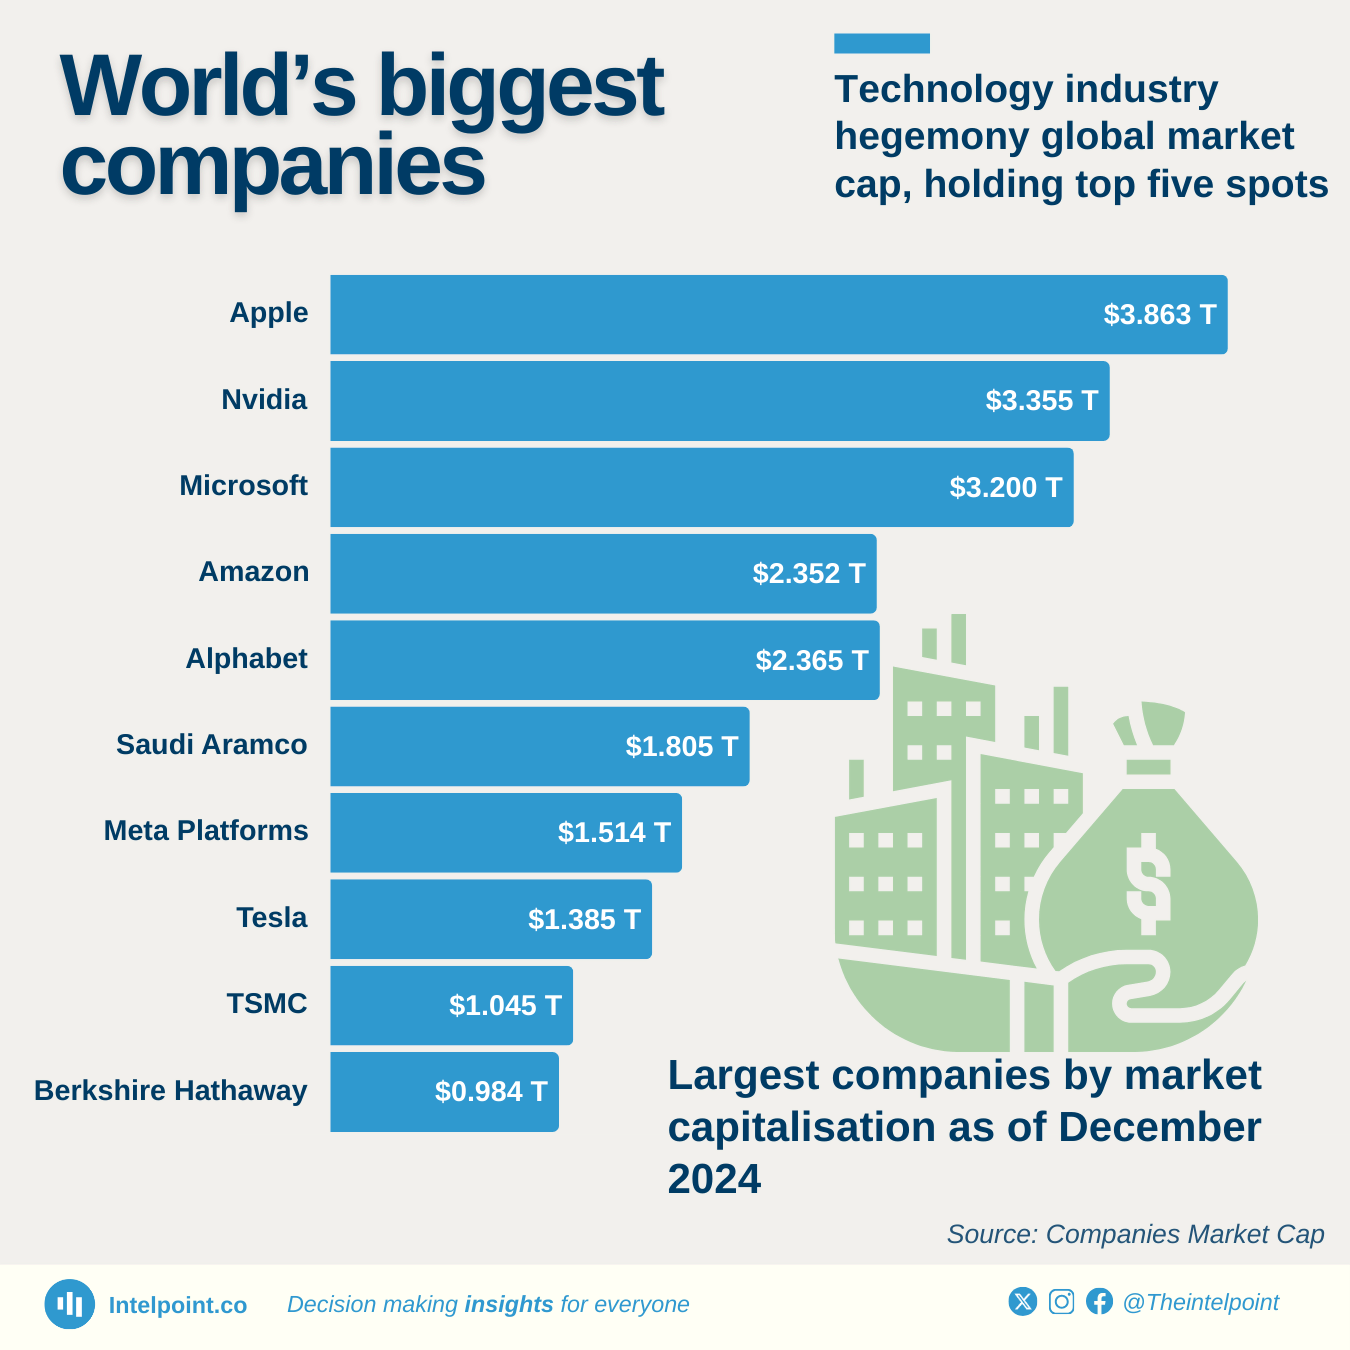
The rankings show that while technology companies dominate, industries like energy, finance, media, and automobiles still hold significant market value. The presence of Saudi Aramco, Berkshire Hathaway, Meta, Tesla, and TSMC on the trillion-dollar companies list displays the continued influence of these sectors on the global economy.

Source:

Companies Market Cap

Period:

2024
HTML code to embed chart
Want a bespoke report?
Reach out
Tags
Related Insights

Nigeria’s public debt rises to $99.7 billion (₦152.4 trillion) as of June 2025
  • Nigeria’s public debt rose to $99.7 billion, up from $91.3 billion in June 2024, marking a return to growth after a dollar-value decline in 2024.
  • The debt in local currency climbed to ₦152.4 trillion, reflecting both borrowing and continued naira depreciation.
  • The increase underscores ongoing domestic financing challenges and vulnerability to exchange-rate fluctuations.
  • The growth in dollar terms points to renewed external borrowing as the government manages debt obligations post-2024 volatility.

Nigeria’s GDP growth peaked at 14.6% in 2002 after years of expansion, now averaging around 3.3% annually
  • From recession to recovery, Nigeria’s GDP growth journey reveals three decades of economic volatility and slow transformation.
  • Nigeria's economy grew by 14.6% in 2002, which is still the highest in the country's history.
  • The country entered a recession in 2016, with the economy shrinking by -1.6%.
  • Nigeria enjoyed a long period of strong growth between 2003 and 2010: The economy grew between 7% and 11%, powered by high oil prices and booming sectors like telecoms and banking.

Nigeria recorded an impressive 822% growth in FDI inflows between 1999 and 2009, before gradually dropping back to $1.1B in 2024
  • FDI inflows in Nigeria peaked at $8.8 billion in 2011, marking the highest point in the Fourth Republic.
  • From 2011 to 2024, FDI inflows dropped, settling at $1.1 billion in 2024.
  • The early Fourth Republic (1999–2011) showed growth in FDI inflows.
  • FDI outflows rose from $0.2 billion in 1999 to $1.5 billion in 2009, reflecting gradual international expansion by Nigerian investors.
  • From 2015 onward, both inflows and outflows showed significant volatility, with no clear recovery trend.

Debt service costs in South Africa surpassed health spending in 2020/21 and reached R426.3B in 2025
  • Debt service costs in South Africa overtook government health spending in 2020/21.
  • In South Africa's 2025 budget, debt service costs stand at R426.3B, compared to R296.1B for health.
  • Debt service costs grew at 11.3% CAGR (2017–2025), more than double the 5.0% CAGR of government health expenditure.
  • The gap between debt and health spending widened sharply after 2020/21, with debt consistently pulling ahead.

The manufacturing sector leads Nigerian MSME revenues with ₦8.27 million monthly, far outpacing service sectors
  • Manufacturing records the highest monthly revenue at ₦8.27m, nearly double that of the next sector.
  • Healthcare (₦5.02m) and Transportation (₦3.70m) follow, reflecting essential service demand.
  • Industries like Marketing & Advertising (₦191k), Food & Beverages (₦320k), and Education (₦440k) earn significantly less on average.
  • The difference between top earners (Manufacturing, Healthcare) and bottom sectors highlights a stark inequality in industry.

The South West is the only region with MSMEs in earning above ₦100 million monthly in revenue
  • The South West is the only region with MSMEs reporting revenues above ₦100 million, accounting for 100% of that bracket.
  • While high-revenue firms cluster in the South West, the South South leads in the ₦10M–₦99.9M range, with over 50.8% share.
  • The North Central (30.3%) has the highest share of MSMEs earning less than ₦100,000 monthly, followed by the North East (19.6%).
  • The ₦200K–₦999.9K range is more evenly spread across regions, but the South West and South South consistently record stronger representation.

POPULAR TOPICS
SIGN UP TO OUR NEWSLETTER
Get periodic updates about the African startup space, access to our reports, among others.
Subscribe Here
Subscription Form

A product of Techpoint Africa. All rights reserved