Apapa Port accounted for 71.6% of Nigeria’s total trade value in Q1 2025 and 86.12% of total exports

  • Apapa Port accounted for 71.6% of Nigeria’s total trade value in Q1 2025 and 82.12% of total exports
  • Apapa Port handled ₦25.79 trillion worth of goods in Q1 2025, representing 71.6% of total trade. It remains the country’s primary trade hub, far surpassing all other ports combined.
  •  Apapa alone facilitated ₦17.74 trillion or 86.1% of Nigeria’s total exports, showing a high dependency on a single location for outbound goods.
  • Tin Can Island is the only meaningful secondary hub With ₦3.44 trillion (9.5%) in total trade, ranking a distant second. It’s the only other port contributing more than ₦1 trillion each to imports and exports.
  • Lekki has limited export impact, despite handling ₦1.70 trillion in imports. Lekki contributed only ₦0.30 trillion (1.5%) in exports, indicating underutilization for outbound trade.
  • Murtala Muhammed International Airport processed just ₦647.91 billion (1.8%) of total trade, reinforcing that Nigeria’s international trade remains heavily maritime-focused.

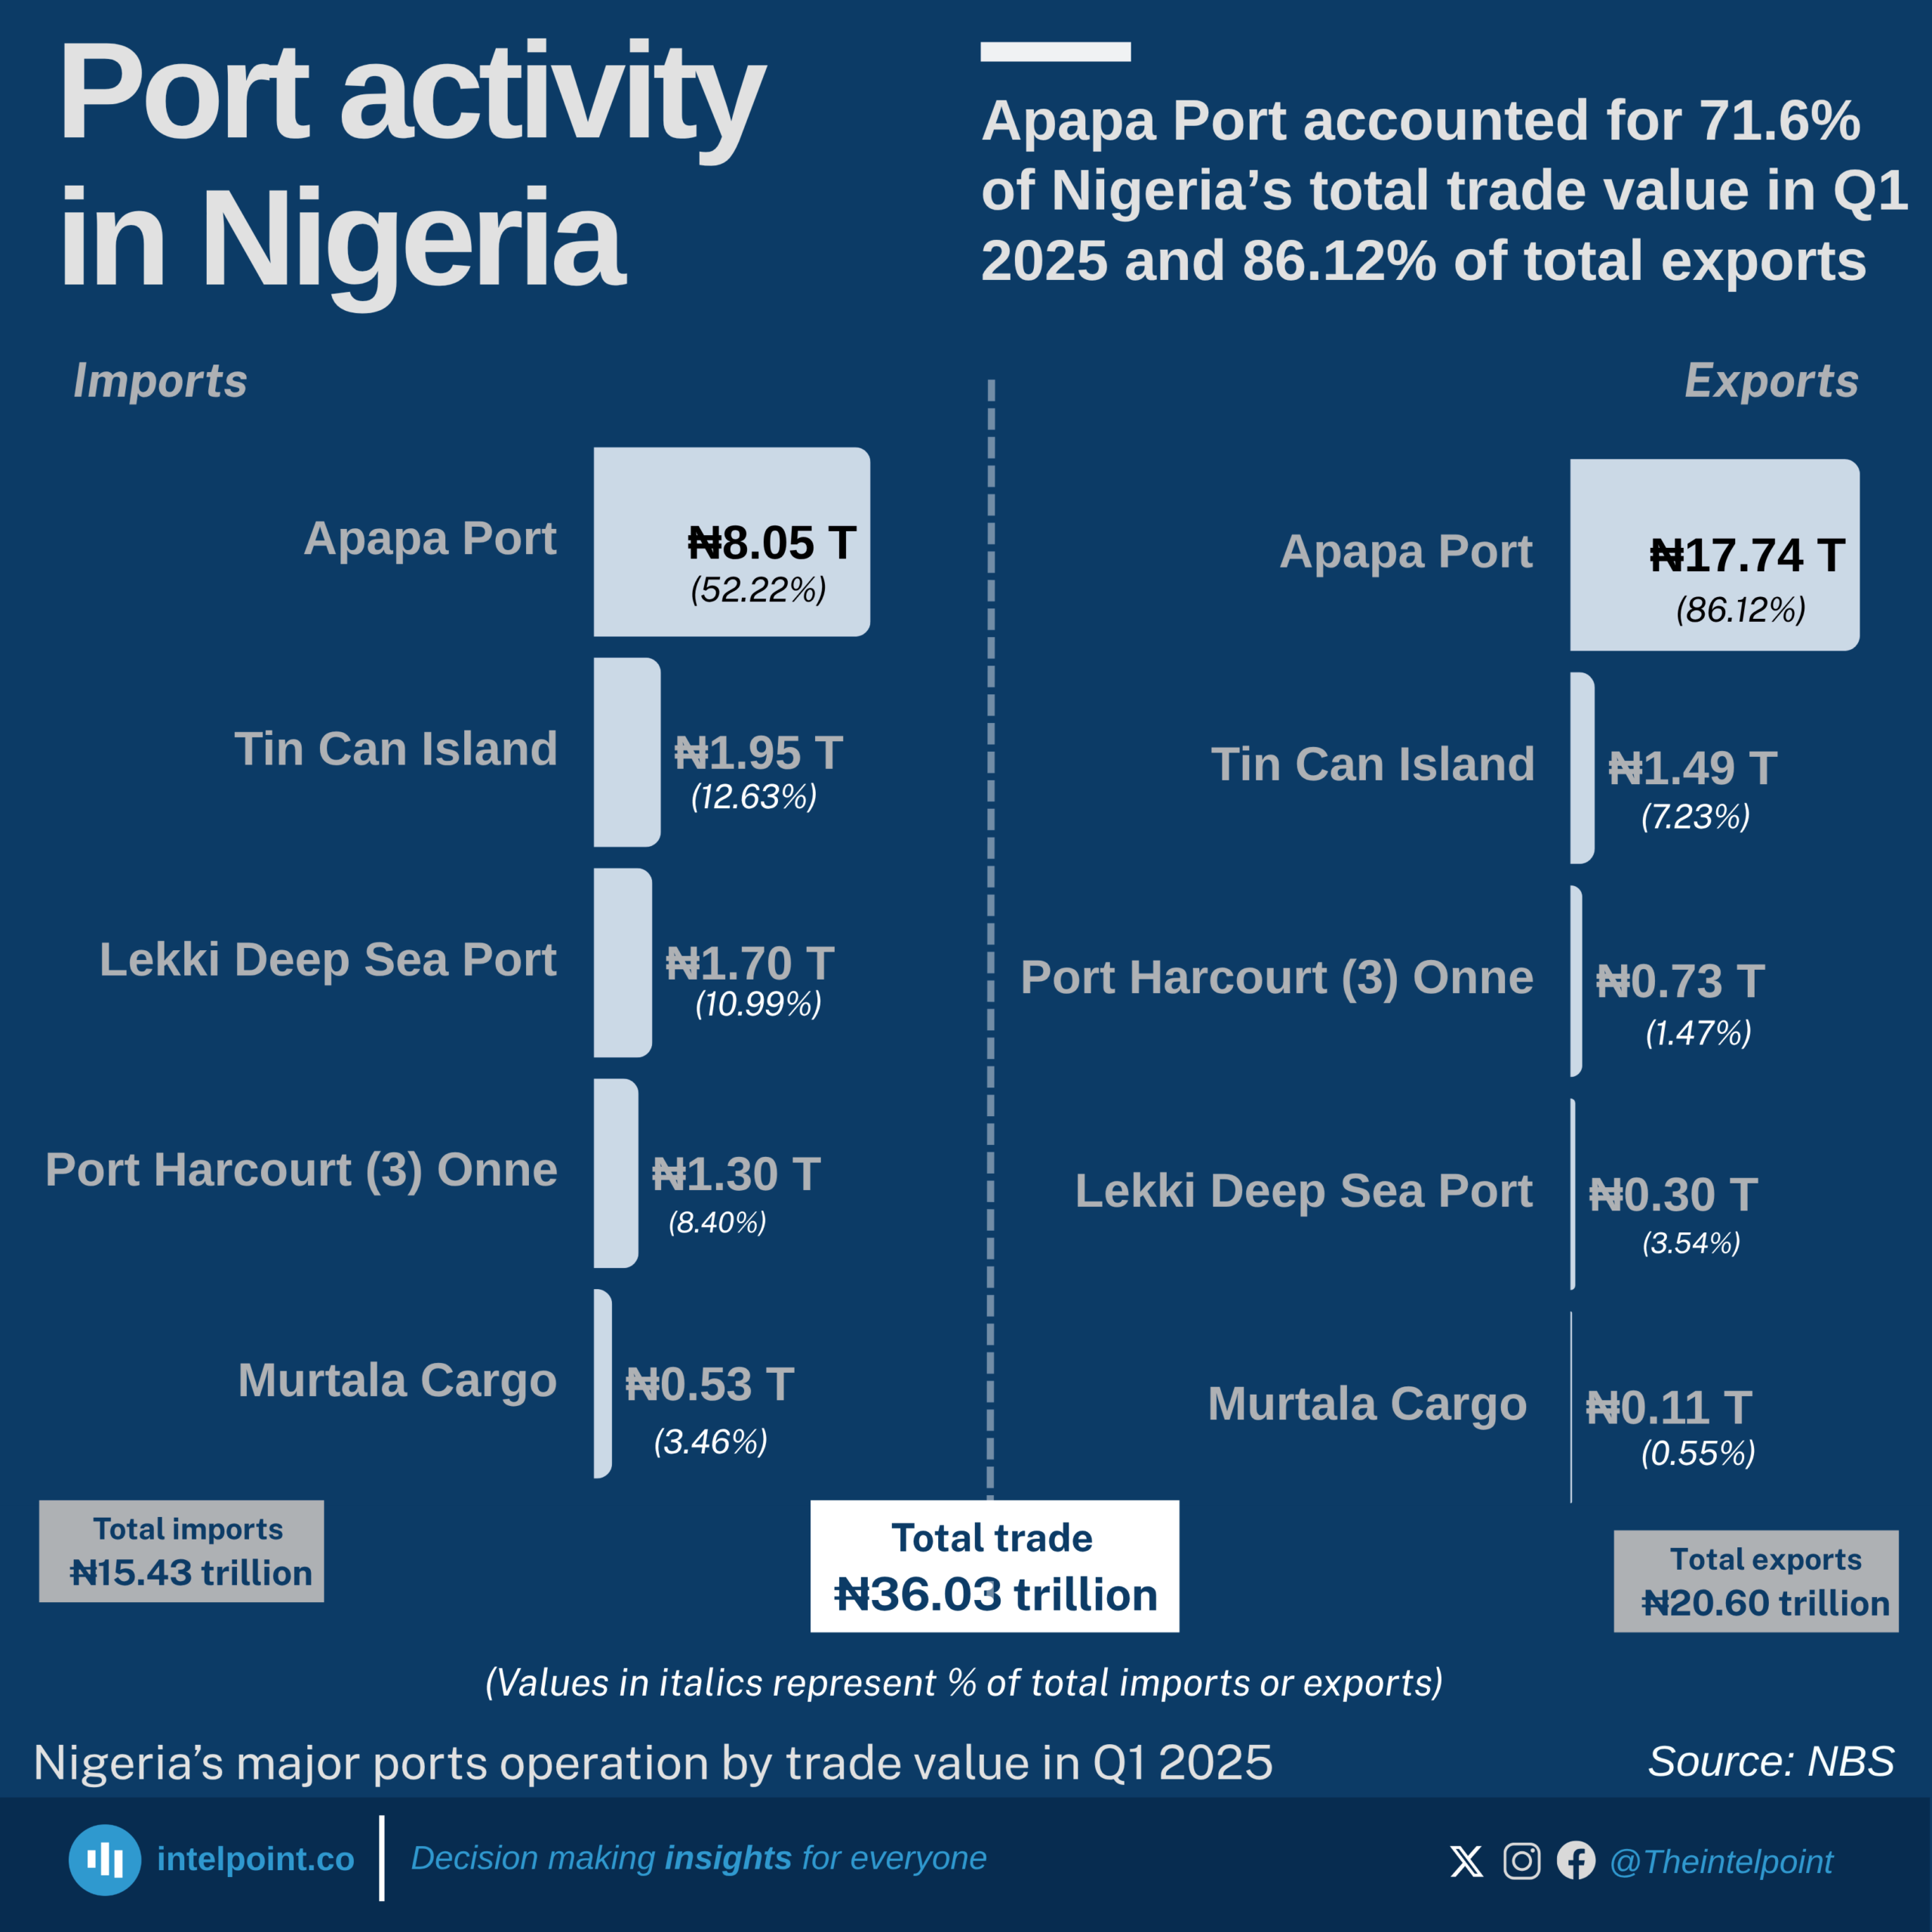
Nigeria’s import and export activities by port for the first quarter of 2025 reveals a sharp concentration of trade around a single location.

Apapa Port emerged as the country’s dominant trade hub, handling more than ₦25.79 trillion worth of goods, which amounts to over 71% of Nigeria’s total international trade for the period. Its share of exports was more pronounced, at ₦17.74 trillion, accounting for 86.12% of Nigeria's total exports of goods.

On the import side, Apapa also led with ₦8.05 trillion, representing 52.2% of total imported goods. Tin Can Island Port, while the second busiest, processed far less, with ₦3.44 trillion in combined trade, or just 9.5% of the national total.

Lekki Deep Sea Port handled about ₦2 trillion in trade, mostly from imports, while Port Harcourt (Onne) processed a similar amount. Meanwhile, Murtala Muhammed International Airport, the only air cargo port among the top five, contributed just ₦647 billion (1.8%).

This chart highlights Nigeria’s significant reliance on Apapa Port, which, although efficient, poses a logistical risk if its capacity is overstretched. The significant imbalance also suggests the need to boost export capacity and diversify usage across other ports to enhance resilience and economic efficiency.

Source:

National Bureau of Statistics

Period:

Q1 2025
HTML code to embed chart
Want a bespoke report?
Reach out
Tags
Related Insights

Nigeria’s power grid is 69.9% powered by thermal plants
  • Thermal energy dominates Nigeria’s grid, supplying 69.9% of total power.
  • Hydro plants contribute 30.1%, making them the country’s second major source.
  • The heavy reliance on thermal generation shows Nigeria’s grid is still largely fossil-fuel driven.
  • Hydro remains a crucial but secondary source, supporting overall supply stability.

Nigeria's DisCos recorded ₦360bn revenue gap after collecting ₦1.12tn from ₦1.49tn billed in H1 2025
  • DisCos billed approximately ₦1.49 trillion but collected only ₦1.12 trillion in H1 2025.
  • Ikeja and Eko DisCos generated the highest revenues, collecting ₦206.22 billion and ₦210.59 billion, respectively.
  • Revenue collection gaps remain significant, with Jos, Kaduna, and Yola posting the weakest collection performances.
  • The wide gap between billings and actual collections suggests persistent challenges in customer payment compliance, metering, and distribution efficiency.

Nigeria has installed 3.65 million electricity metres since 2019; Ikeja DisCo leads with 823,000, and Aba Power at the bottom with 56,000
  • Approximately 3.65 million metres have been installed nationwide across all frameworks since 2019.
  • Ikeja DisCo leads by a wide margin with 823,000 installations, over twice the volume of most other DisCos.
  • Kaduna, Yola, and Aba Power recorded the lowest metre installations, each below 100,000.
  • The disparities in installation totals reveal uneven progress in achieving nationwide metering coverage.

More than 8 in 10 electricity customers of Ikeja and Eko DisCos are now metered
  • Ikeja (84.6%) and Eko (83.3%) lead Nigeria’s metering performance, keeping unmetered customers below 17%.
  • Eight out of the twelve DisCos have metering rates below 60%, showing a wide sector imbalance.
  • The worst-performing DisCos — Yola, Jos, Kaduna, and Kano — have over 65% unmetered customers.
  • Regional disparities are sharp: Lagos and Abuja outperform northern and south-eastern DisCos by large margins.

Nigeria’s public debt has soared since 2010, with domestic debt up 2,020% and external debt up 1,000% by mid 2025
  • Nigeria’s domestic debt jumped from ₦3.8 trillion in 2010 to ₦80.55 trillion by mid-2025.
  • Foreign debts increased from $4.27 billion in 2010 to $46.98 billion in 2025, reflecting growing reliance on external financing.
  • Debt accumulation surged notably after 2020, coinciding with pandemic spending, naira depreciation, and higher fiscal deficits.
  • The widening gap between revenue and debt service raises questions about Nigeria’s long-term debt sustainability.

Borno records lowest domestic debt in North-East Nigeria at ₦22.3 billion in Q2 2025
  • The six North-Eastern states collectively owe around ₦450 billion in domestic debt as of Q2 2025.
  • Borno State maintains the lowest debt in the region at ₦22.3 billion, showing signs of controlled borrowing amid post-conflict rebuilding.
  • Bauchi State has the highest domestic debt burden of ₦143.6 billion, accounting for about 31% of the region’s total.
  • The top three states, Bauchi, Taraba and Gombe, collectively account for more than two-thirds of the zone’s total subnational debt stock.

POPULAR TOPICS
SIGN UP TO OUR NEWSLETTER
Get periodic updates about the African startup space, access to our reports, among others.
Subscribe Here
Subscription Form

A product of Techpoint Africa. All rights reserved