Petrol prices surged by nearly 1000% in 9 years

Key Takeaways

  • In February 2016, petrol was at its lowest price of 99.80 per litre, marking the last time fuel prices remained below 100.
  • By November 2024, petrol prices soared to an all-time high of 1,214.17 per litre, reflecting the compounded effects of inflation, currency depreciation, and global oil price volatility.
  • Over the nine-year period, the average petrol price stood at 272.65 per litre.
  • Between January 2016 and December 2024, petrol prices increased by 1,079.52, a staggering 984.96% rise, emphasising the long-term upward trajectory influenced by economic challenges, subsidy removals, and fluctuating exchange rates.
  • The most volatile period recorded a month-to-month price surge of over 129.23%.

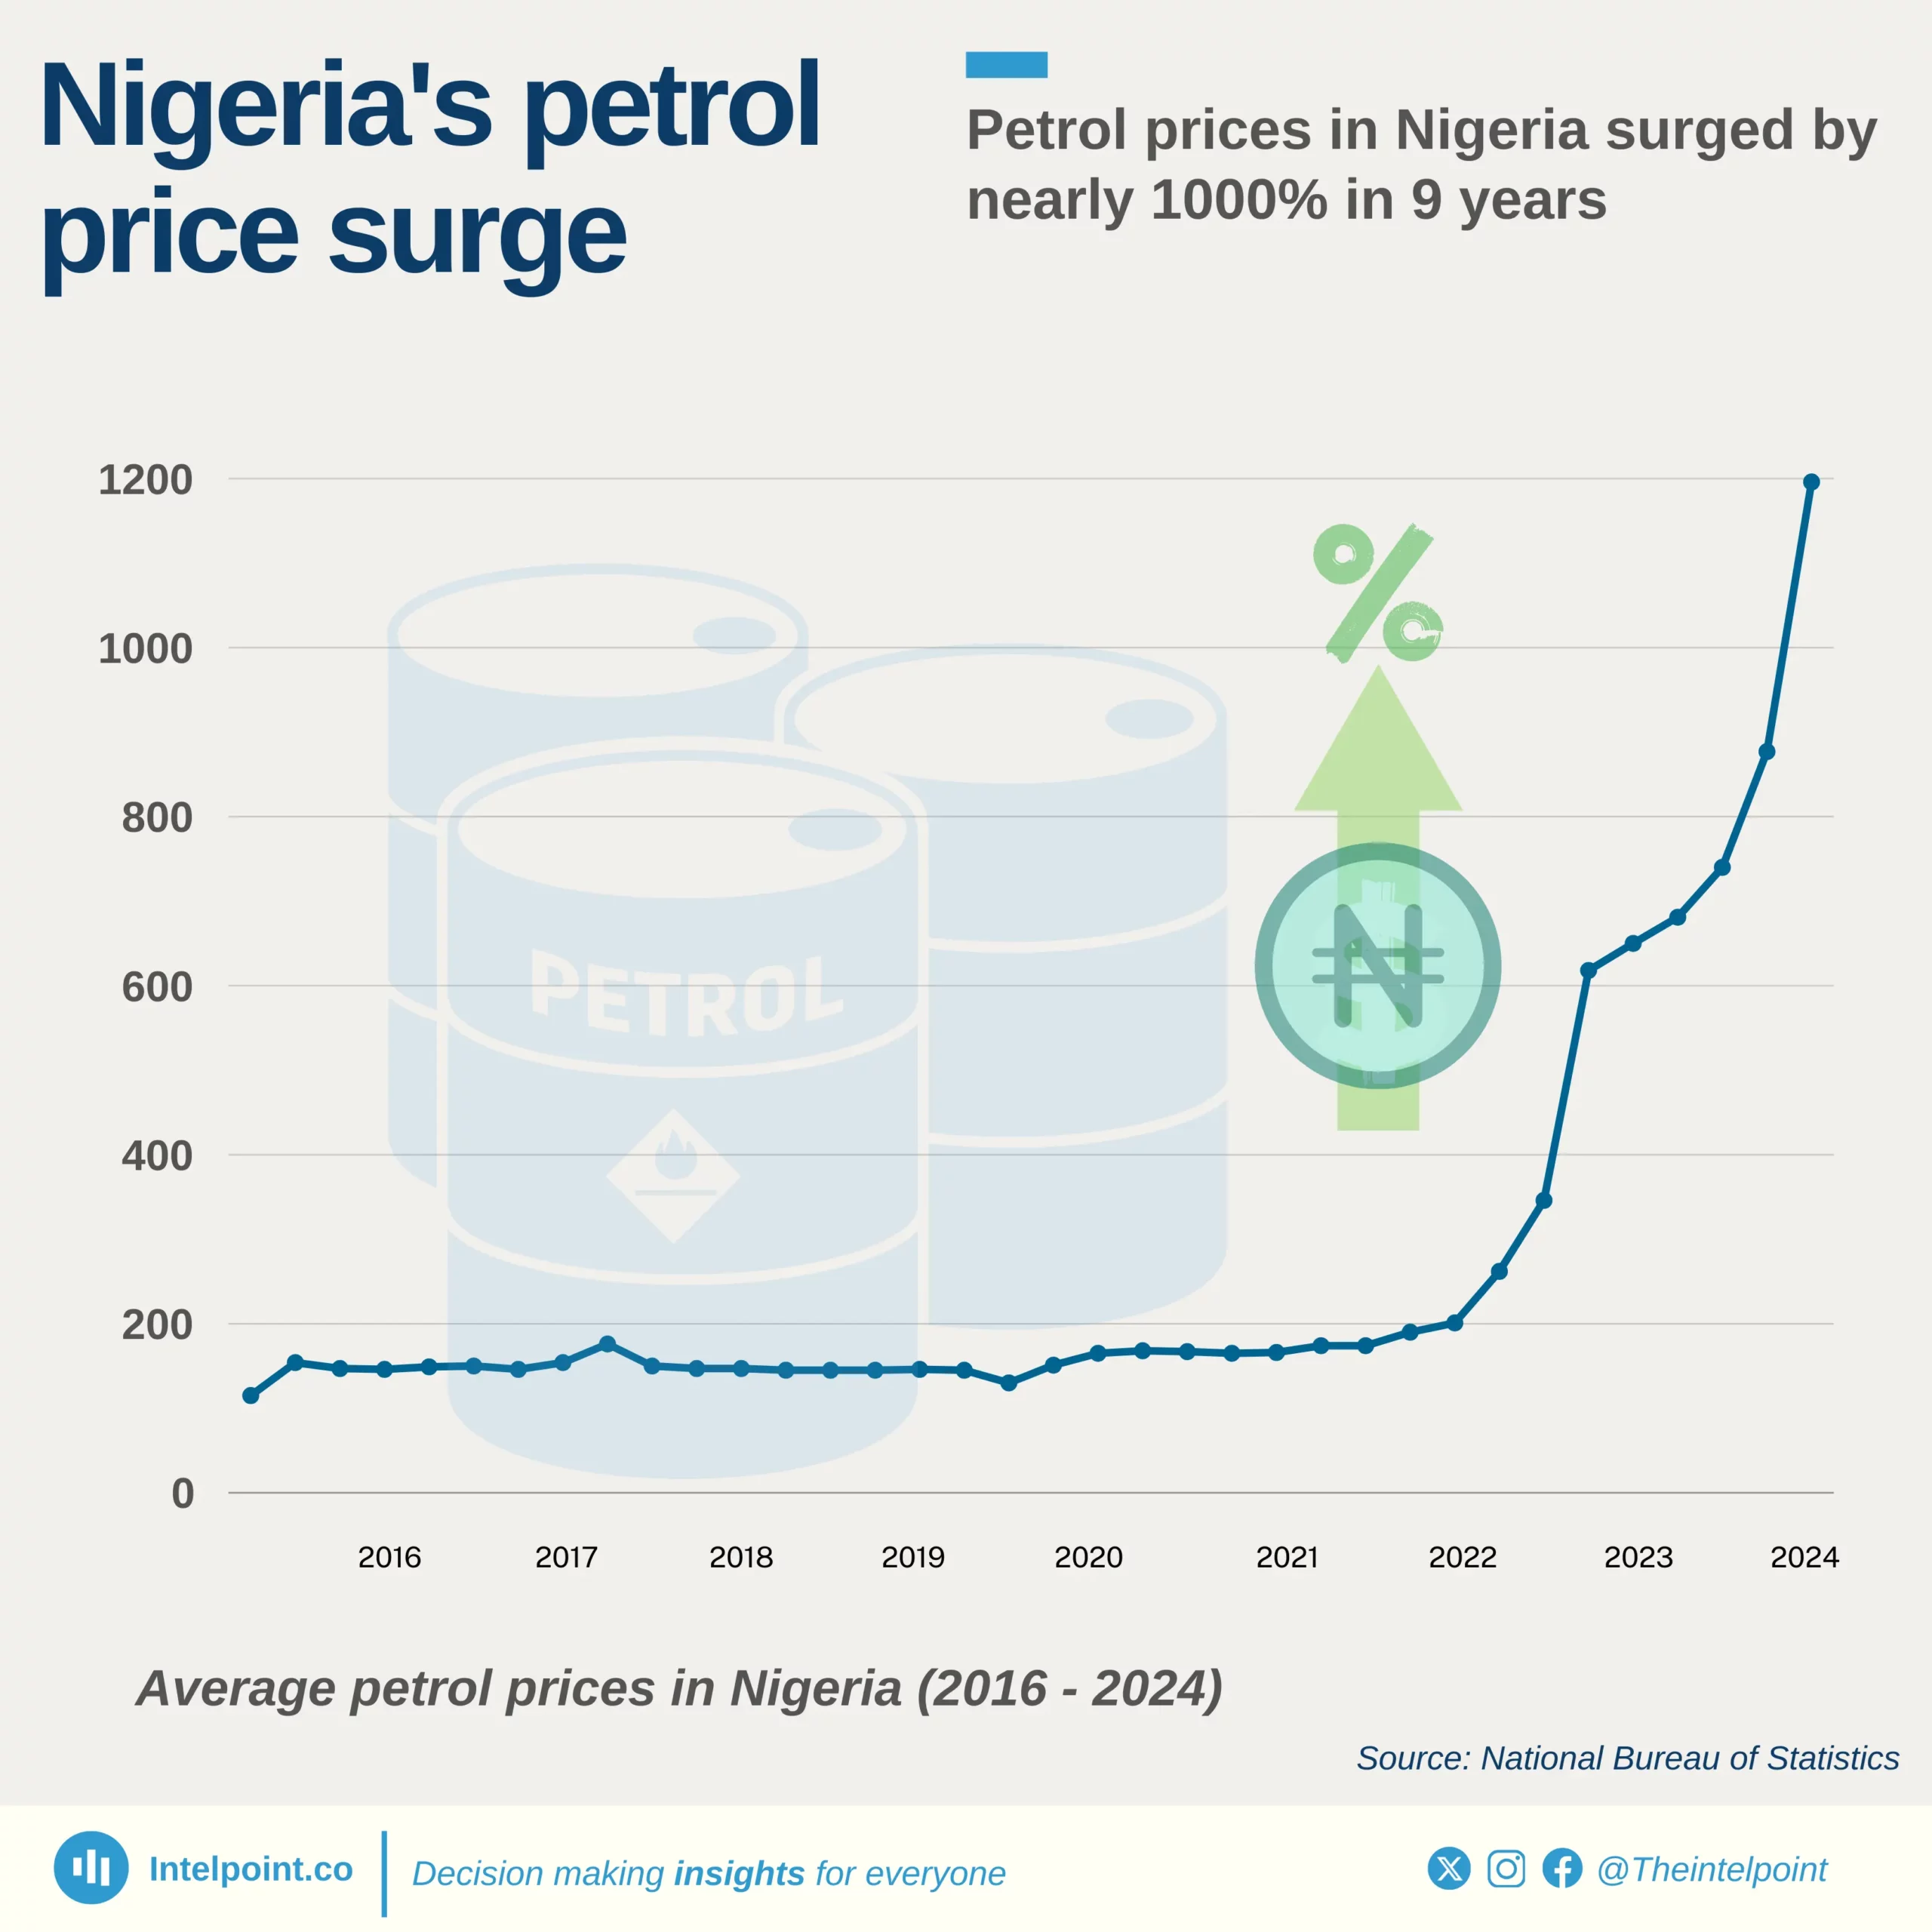
Over the past nine years, petrol prices in Nigeria have experienced a dramatic and relentless rise, climbing from 109.60 per liter in January 2016 to 1,189.12 per litre in December 2024, a staggering 984.96% increase. While the early years saw moderate fluctuations, the trend took a sharp upward trajectory in recent years, driven by economic shifts, subsidy removals, currency depreciation, and global oil price volatility.

The sharpest single-month price surge occurred in June 2023, when petrol prices skyrocketed by 129.23% compared to the previous month. This unprecedented leap marked a pivotal moment in Nigeria’s fuel pricing history, coinciding with the removal of fuel subsidies, which instantly doubled the cost of petrol and sent ripple effects across the economy.

The highest recorded price of 1,214.17 per liter came in November 2024, reflecting continued economic pressures, while the lowest price of 99.80 per litre was observed in February 2016, when subsidies still kept fuel costs relatively low. Despite these extremes, the average petrol price over the nine-year period was 272.65 per litre, showing that while drastic spikes occurred, there were also periods of relative stability.

Source:

National bureau of statistics

Period:

2016 to 2024
HTML code to embed chart
Want a bespoke report?
Reach out
Tags
Related Insights

Nigeria’s public debt has soared since 2010, with domestic debt up 2,020% and external debt up 1,000% by mid 2025
  • Nigeria’s domestic debt jumped from ₦3.8 trillion in 2010 to ₦80.55 trillion by mid-2025.
  • Foreign debts increased from $4.27 billion in 2010 to $46.98 billion in 2025, reflecting growing reliance on external financing.
  • Debt accumulation surged notably after 2020, coinciding with pandemic spending, naira depreciation, and higher fiscal deficits.
  • The widening gap between revenue and debt service raises questions about Nigeria’s long-term debt sustainability.

Borno records lowest domestic debt in North-East Nigeria at ₦22.3 billion in Q2 2025
  • The six North-Eastern states collectively owe around ₦450 billion in domestic debt as of Q2 2025.
  • Borno State maintains the lowest debt in the region at ₦22.3 billion, showing signs of controlled borrowing amid post-conflict rebuilding.
  • Bauchi State has the highest domestic debt burden of ₦143.6 billion, accounting for about 31% of the region’s total.
  • The top three states, Bauchi, Taraba and Gombe, collectively account for more than two-thirds of the zone’s total subnational debt stock.

In just six months, Nigeria spent over $2.3 billion servicing external debts
  • Nigeria paid $816.3 million to the International Monetary Fund, accounting for over 35% of total external debt service payments.
  • Eurobond payments followed closely, with $687.8 million paid, reflecting Nigeria’s heavy reliance on commercial debt instruments.
  • Multilateral lenders like IDA and AfDB collectively received about $463 million, signalling continued exposure to concessional financing.
  • China’s share shrinking: Payments to Chinese lenders (EXIM + CDB) totalled $235.6 million, less than 11% of total outflows, suggesting reduced Chinese debt servicing in H1 2025.

Over 60% of Nigeria’s ₦1.7 trillion domestic debt service in Q2 2025 was spent on Federal Government Bonds
  • FGN bonds dominated: ₦1.07 trillion went to Federal Government Bonds, accounting for about 63% of total domestic debt servicing.
  • Treasury bills followed: Payments on NTBs reached ₦537.9 billion, making up roughly 31% of the total.
  • Sukuk and promissory notes together cost ₦90.8 billion, reflecting Nigeria’s mix of infrastructure and settlement instruments.
  • Green and savings bonds remained minimal, together below ₦5 billion, showing limited traction for retail and sustainability-focused debt.

93% of Nigeria's public debt is owed by the Federal Government
  • The Federal Government’s share of total public debt rose from 79.5% in 2019 to 92.6% in 2025.
  • States’ share has more than halved, from 20.5% to 7.4% in six years.
  • Total public debt grew from $83.9 billion to $99.7 billion, peaking at $113.4 billion in 2023.
  • Nigeria’s debt burden is increasingly concentrated at the centre, amplifying federal repayment risks and reducing fiscal independence for states.

Over 60% of Nigerians use crypto for savings and long-term investing
  • Wealth-building dominates motivation: 45.4% cite “active wealth building” as their primary motive, and an additional 21.8% cite “long-term financial security”.
  • Payments and utility are minor drivers: Only 3.3% report “daily utility” and 2.2% “digital commerce” as their chief motive for using crypto.
  • Hedging and cross-border flows matter: 8.7% use crypto for currency hedging, and 4.1% for cross-border payments, showing a dual role of investment plus international value flows.
  • Nigerian retail users treat crypto like a conventional financial instrument rather than only as a means of payment or speculation.

POPULAR TOPICS
SIGN UP TO OUR NEWSLETTER
Get periodic updates about the African startup space, access to our reports, among others.
Subscribe Here
Subscription Form

A product of Techpoint Africa. All rights reserved