Nigeria's Federal Government is responsible for over 91% of the nation's public debt

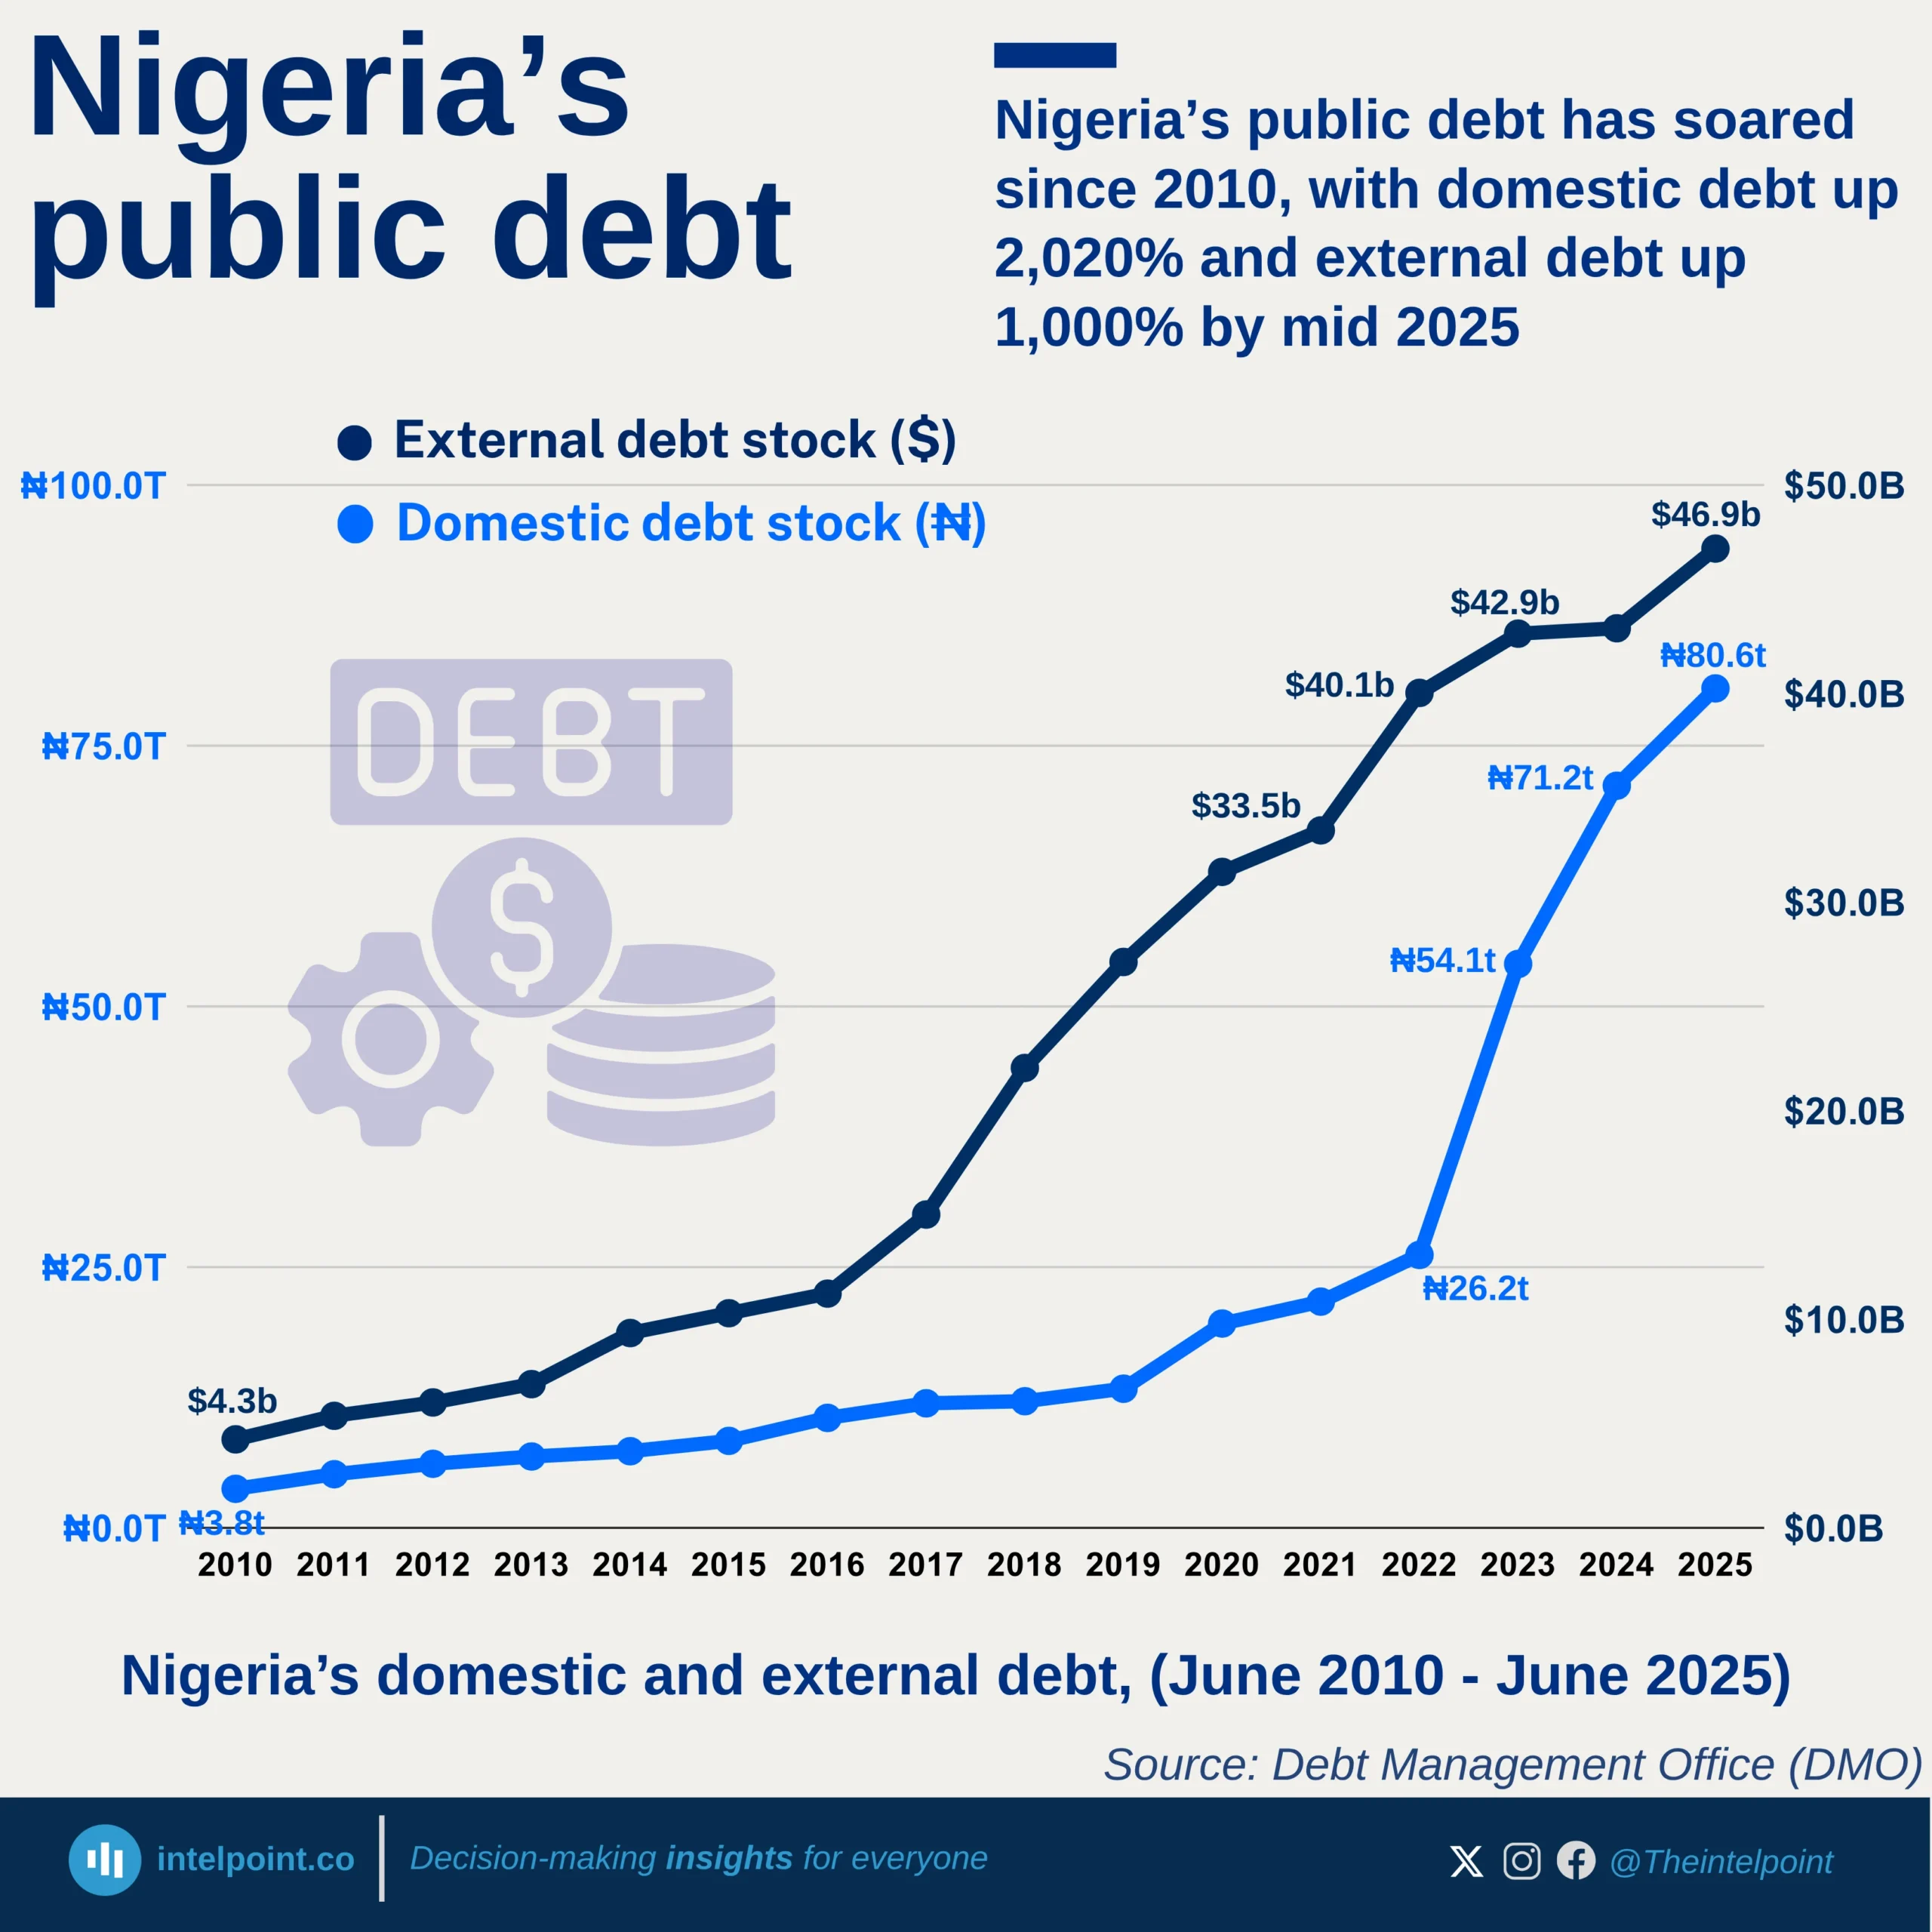
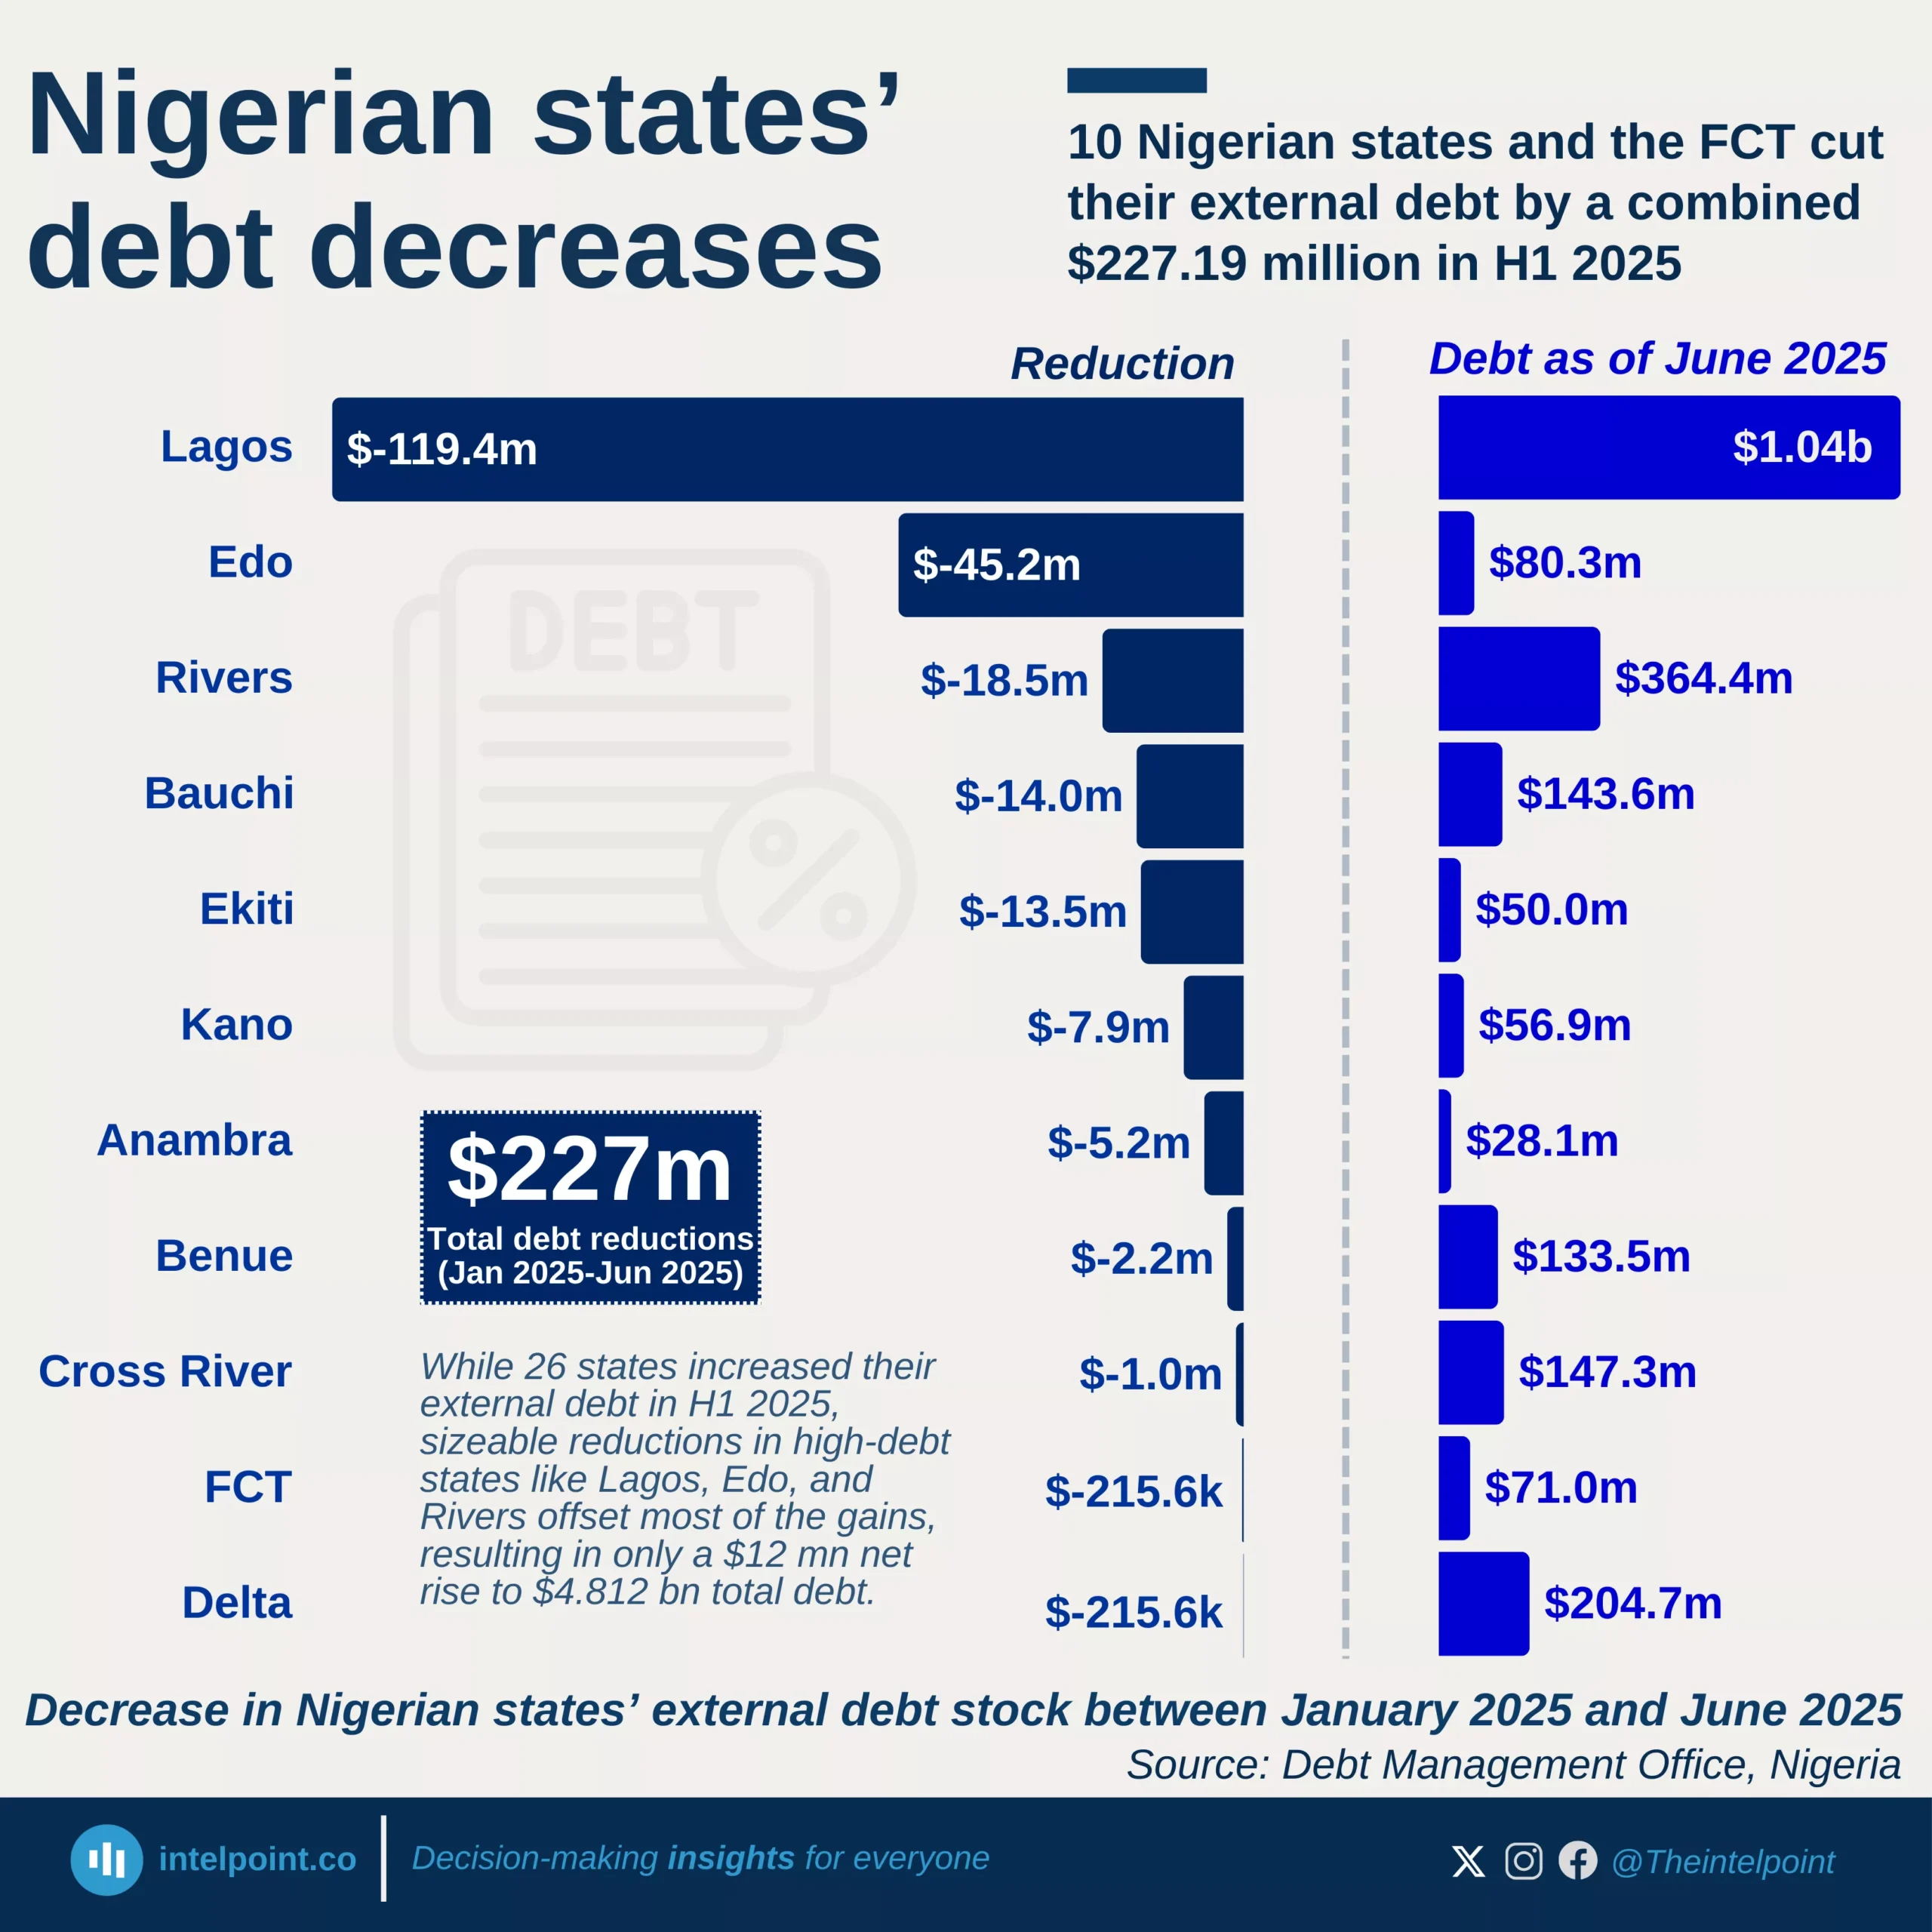
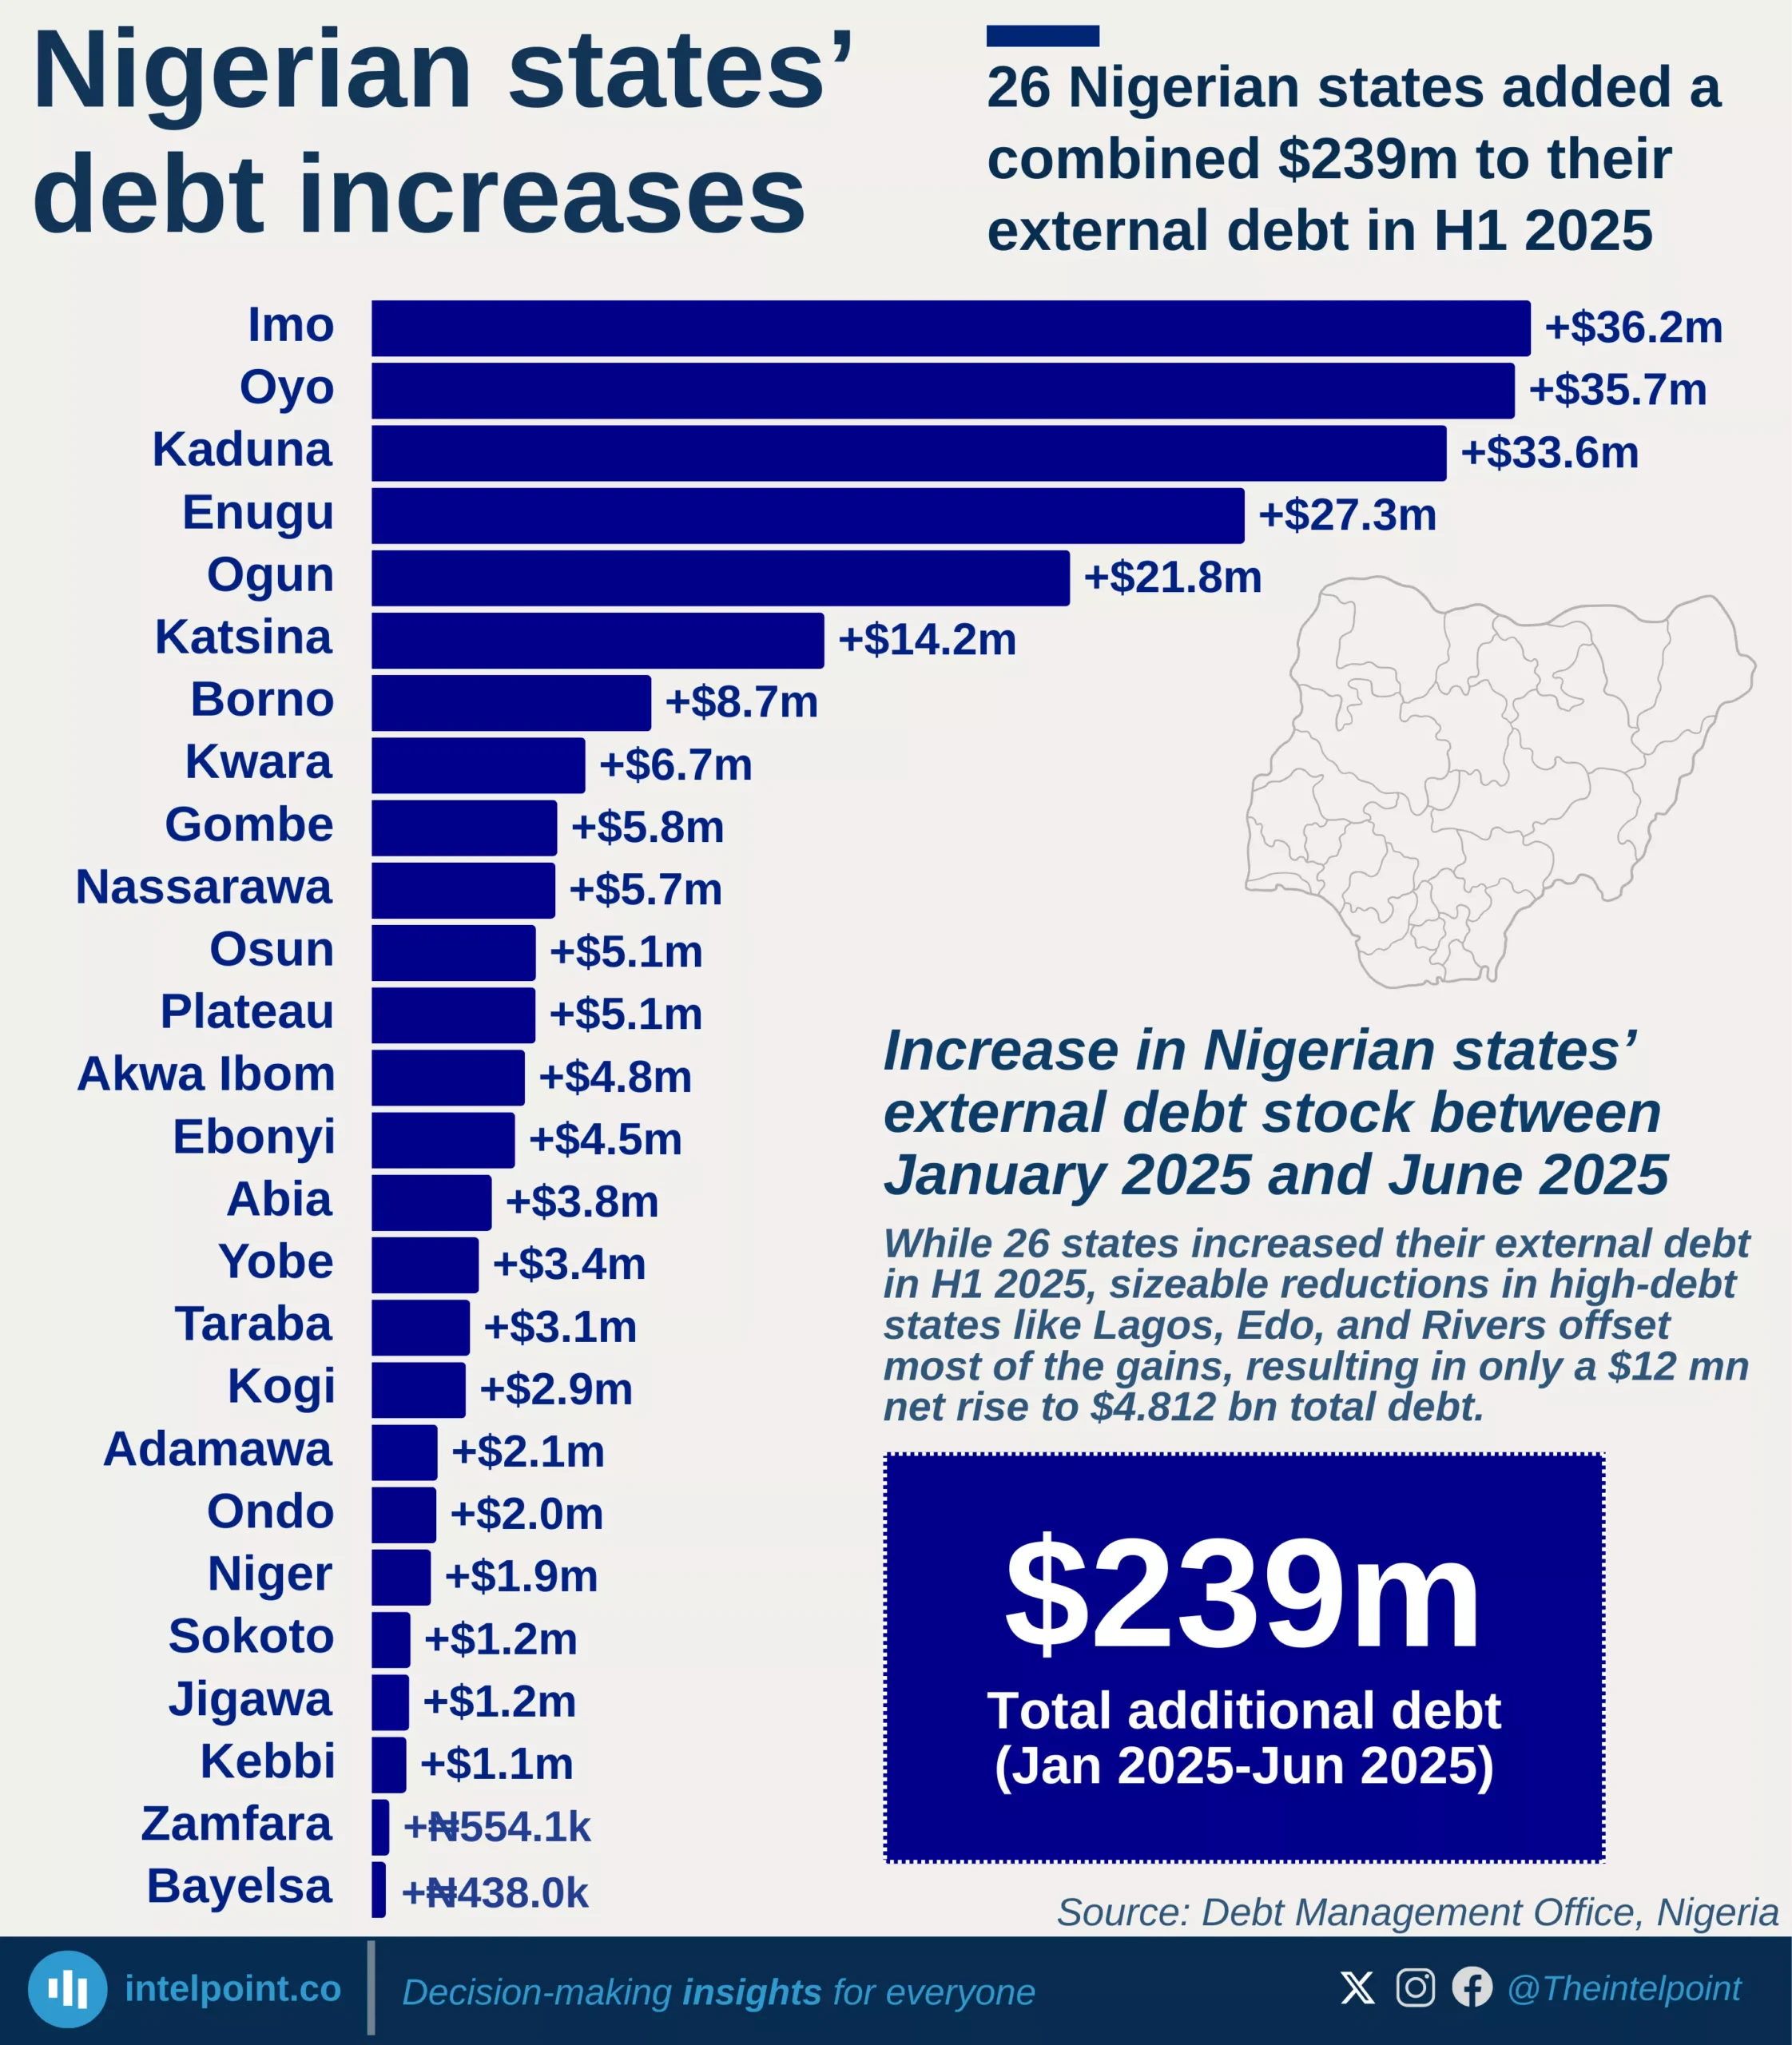
States' share of Nigeria's public debt has dropped from 20.5% in 2019 to 8.5% in 2024, while the federal government’s debt has risen to over 91% of the total, in dollar terms.

The FG's debt grew from $66.7 billion to $83.6 billion in this period, while the states' debt dropped from $17.2 billion in 2019 to $7.8 billion, marking a shift in borrowing dynamics at federal and state levels.

Notably, states and FCT debt decreased in dollar terms but increased in naira terms, while FG debt rose in both dollar and naira terms over the same period.
Source:

Debt Management Office

Period:

2019 - 2024
HTML code to embed chart
Want a bespoke report?
Reach out
Tags
Related Insights

Nigeria’s public debt rises to $99.7 billion (₦152.4 trillion) as of June 2025
  • Nigeria’s public debt rose to $99.7 billion, up from $91.3 billion in June 2024, marking a return to growth after a dollar-value decline in 2024.
  • The debt in local currency climbed to ₦152.4 trillion, reflecting both borrowing and continued naira depreciation.
  • The increase underscores ongoing domestic financing challenges and vulnerability to exchange-rate fluctuations.
  • The growth in dollar terms points to renewed external borrowing as the government manages debt obligations post-2024 volatility.

Debt service costs in South Africa surpassed health spending in 2020/21 and reached R426.3B in 2025
  • Debt service costs in South Africa overtook government health spending in 2020/21.
  • In South Africa's 2025 budget, debt service costs stand at R426.3B, compared to R296.1B for health.
  • Debt service costs grew at 11.3% CAGR (2017–2025), more than double the 5.0% CAGR of government health expenditure.
  • The gap between debt and health spending widened sharply after 2020/21, with debt consistently pulling ahead.

Nigeria has paid $57.67 billion in external debt interest in 54 years, with payments rising 1,140% since 2009
  • Nigeria spent $57.67B on external debt interest from 1970 to 2023.
  • Payments were low initially but rose steadily as borrowing increased.
  • In the 1990s, interest payments fluctuated due to debt rescheduling and restructuring agreements.
  • In 2005, payments jumped to $5.31B following a strategic debt buyback that accelerated obligations.
  • Annual payments climbed 1,139.6%, from $0.31B to $3.79B, showing rising debt service costs.

While Angola's debt service-to-GDP hits 68%, Algeria’s is 0.1%, showing huge variety in debt burdens
  • Angola and Ethiopia account for the highest debt service-to-GDP ratios in Africa, both exceeding 67%.
  • East Africa dominates the high debt-servicing bracket, with five countries among the top ten most burdened.
  • Algeria has the lowest debt service-to-GDP ratio on the continent at just 0.10%.
  • There’s a wide gap between the top and bottom debt service burdens, reflecting divergent fiscal paths across Africa.
  • Low debt servicing doesn’t automatically mean economic strength—it may reflect limited borrowing capacity.

While many other African nations face a high debt burden, Algeria's already low debt keeps falling to a projected 0.09% in 2025
  • Algeria’s debt service per GDP dropped from 0.77% in 2009 to a projected 0.09% in 2025.
  • The country’s debt service per GDP declined at a -11.9% CAGR from 2009–2025.
  • A high of 0.73% occurred in 2012 before the consistent decline resumed.
  • By 2015, the country's debt service fell to 0.27%, showing progress in reduction.
  • The lowest point is forecast for 2025, at 0.09% of GDP.
  • Algeria’s debt burden is among the lowest in Africa, contrasting with the rising trend in many other nations.
  • This low debt service level allows for greater fiscal flexibility in public spending and investment.

Nigeria's debt service per GDP increased from 0.7% in 2015 to 10.2% in 2024, with 2025 forecasted to reach 15.1%
  • Nigeria's debt service per GDP rose from 0.9% in 2009 to a projected 15.1% in 2025.
  • Overall CAGR from 2009 to 2025 is 17.8%.
  • President Muhammadu Buhari’s tenure saw the fastest growth (29.1% CAGR).
  • Under President Goodluck Jonathan, growth was slower (6.5% CAGR).
  • President Bola Ahmed Tinubu’s term so far shows a 27.6% CAGR.

POPULAR TOPICS
SIGN UP TO OUR NEWSLETTER
Get periodic updates about the African startup space, access to our reports, among others.
Subscribe Here
Subscription Form

A product of Techpoint Africa. All rights reserved