Top 10 Countries With The Most Number of U.S. Military Bases

Key Takeaways

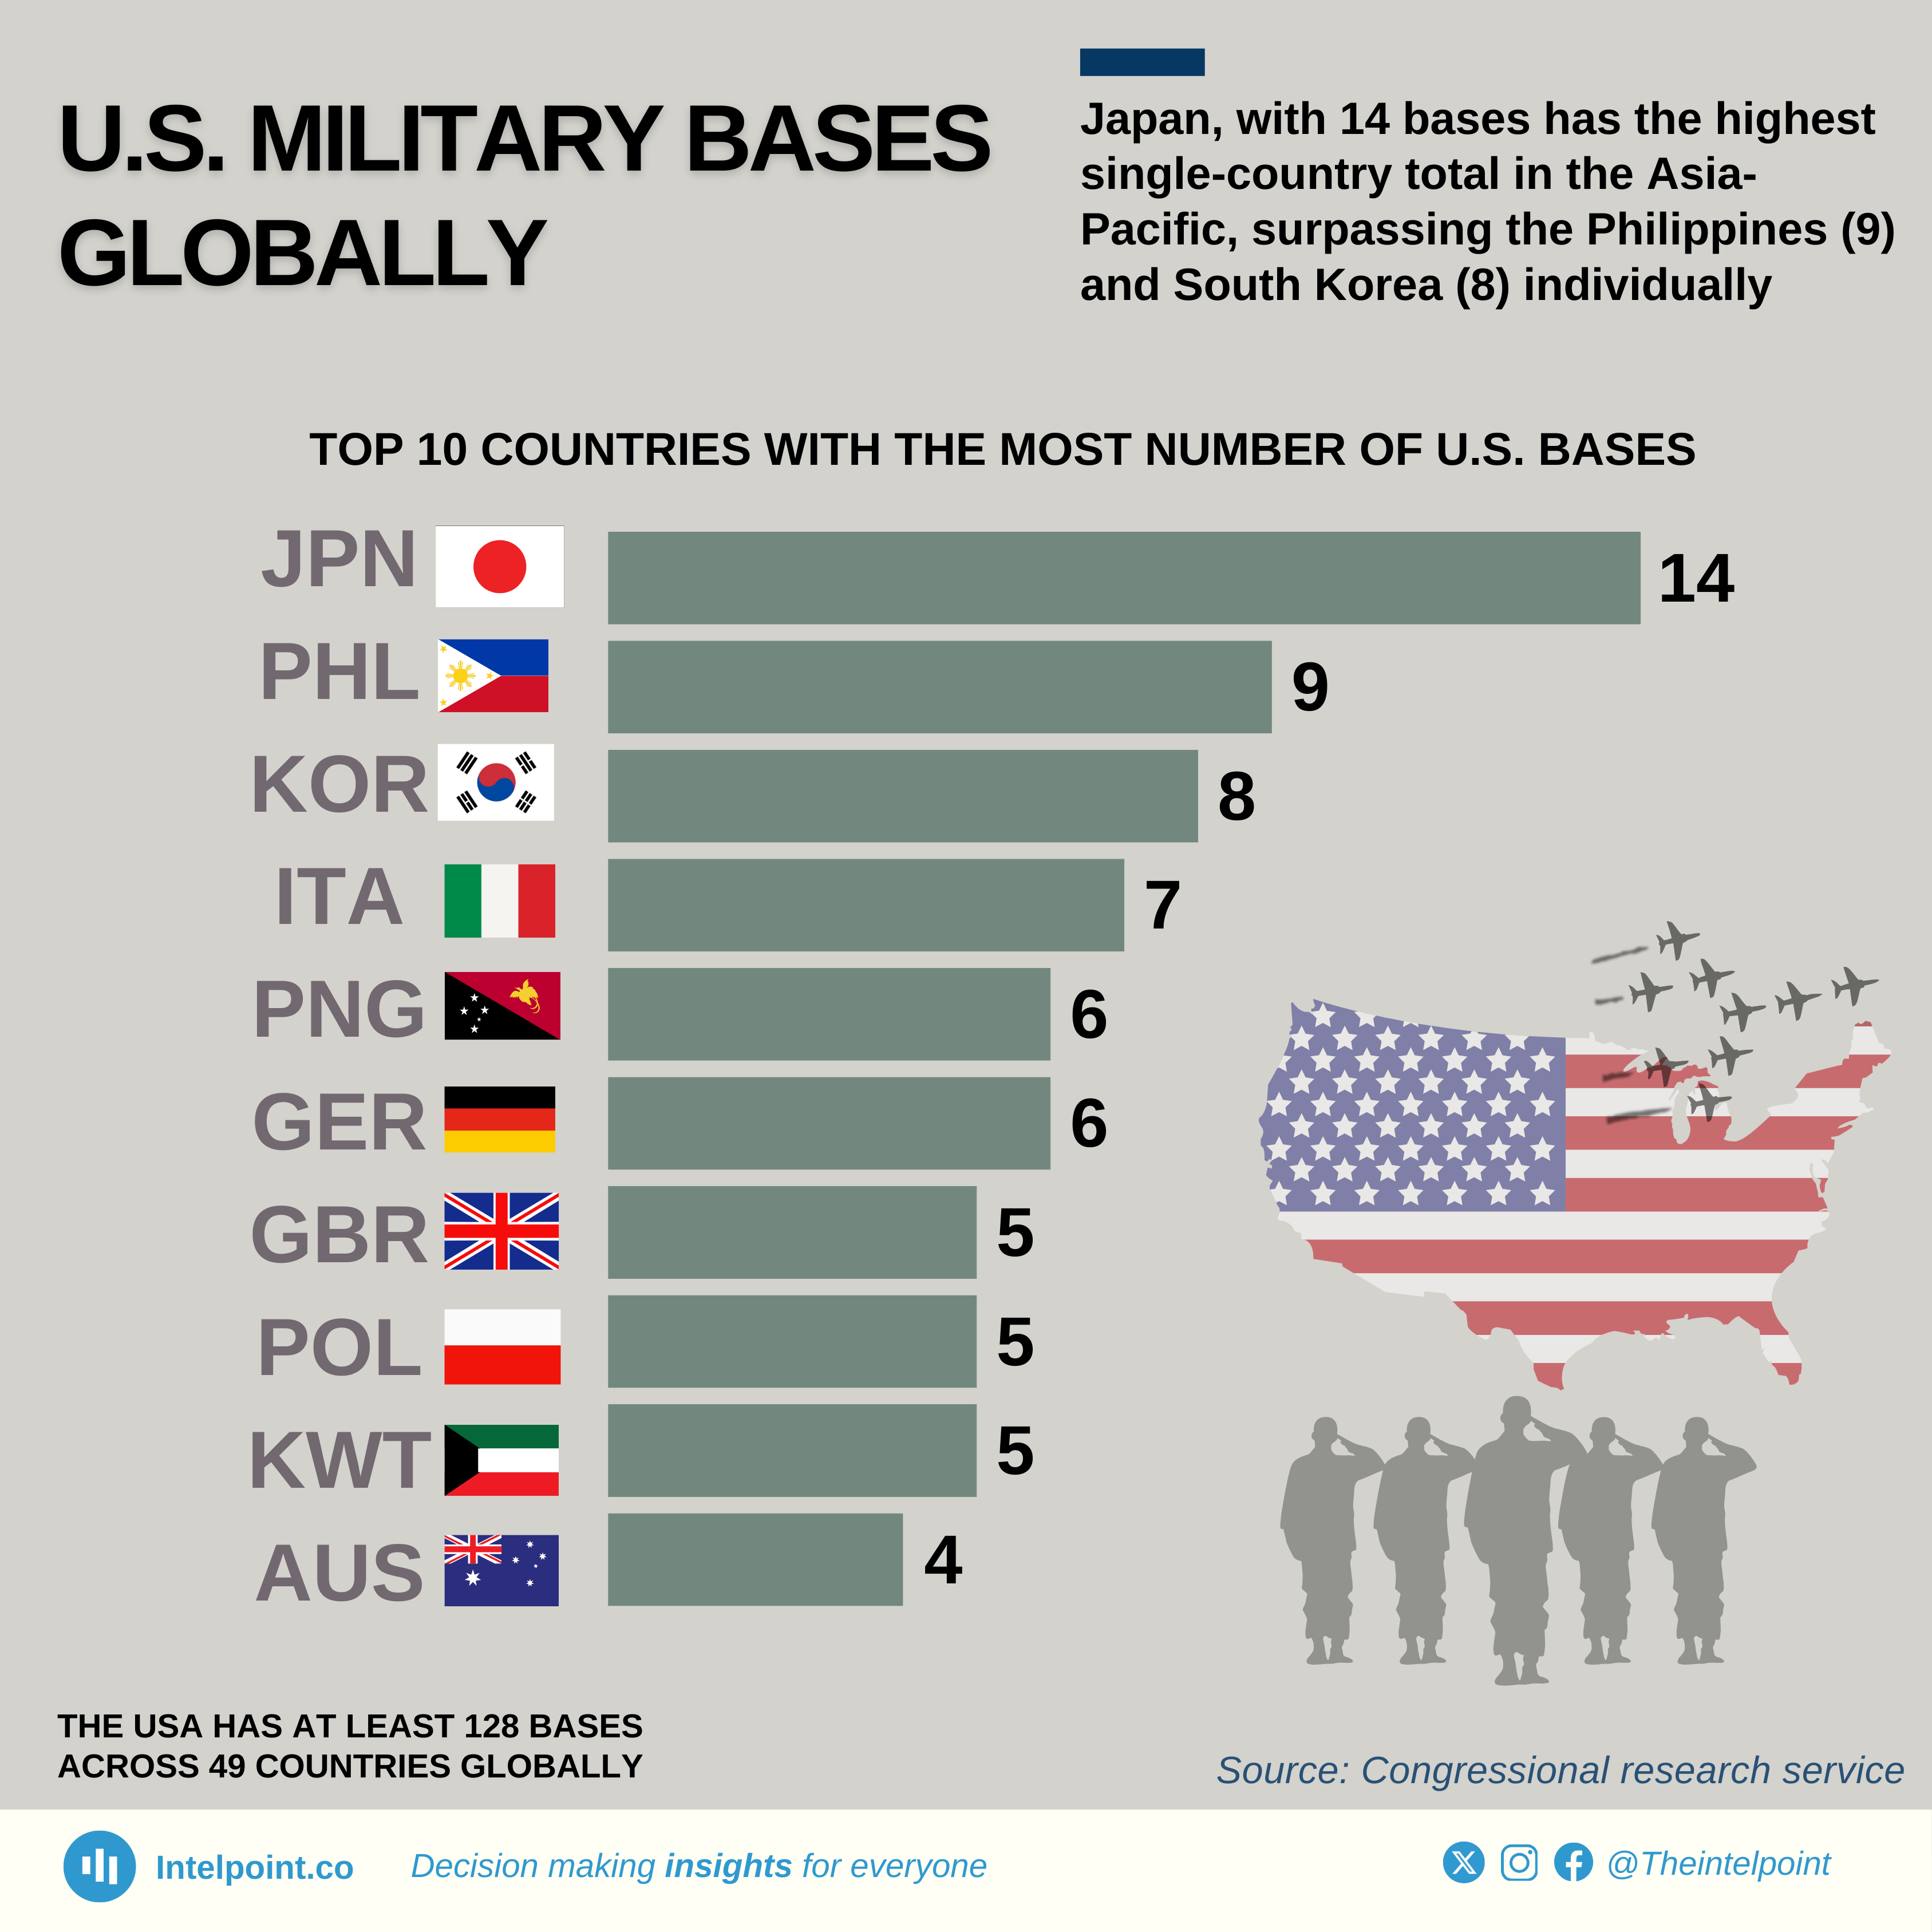
  • Japan leads with 14 bases. It hosts the most U.S. bases globally, exceeding individual counts in the Philippines (9) and South Korea (8).
  • Asia-Pacific Dominance: The region (Japan, Philippines, South Korea, Australia, and Papua New Guinea) accounts for 41 bases, nearly 1/3 of the global total.
  • The Asia-Pacific region hosts 41 U.S. bases, while Europe (Italy, Germany, Poland, UK) has 23. This indicates a growing strategic pivot towards the Pacific compared to traditional European deployments.
  •  Kuwait (5 bases) stands out as the primary hub for U.S. military operations in the Middle East, highlighting its role as a key staging ground for regional security.
  • The top 10 host countries account for 69 of the 128 total bases (over 53%), meaning nearly half of U.S. overseas bases are spread across the remaining 39 countries.

The U.S. maintains 128 bases across 49 countries, with Japan alone hosting 14 — the highest single-nation total. While Japan leads individually, the Philippines (9) and South Korea (8) collectively hold 17 bases in the Asia-Pacific, highlighting the region’s strategic priority.

Europe’s footprint spans Italy (7), Germany (6), and Poland (5), reflecting NATO’s eastern focus, while Kuwait (5) anchors Middle East operations. Emerging deployments in Papua New Guinea (6) highlight Pacific militarisation efforts, contrasting with legacy hubs like Germany.
Source:

Congressional research service

Period:

2024
HTML code to embed chart
Want a bespoke report?
Reach out
Tags
Related Insights

Nigerian states with the largest increase in FAAC allocations
  • Nigeria's 36 states received a combined ₦4.14 trillion in FAAC allocations in Jan-May 2026, up ₦735.4 billion (21.6%) from a year earlier.
  • Thirty-five states received higher allocations than a year earlier, while Rivers was the only state to record a decline (₦7.15 billion).
  • Lagos recorded the largest increase in FAAC allocations (₦119.5 billion), more than three times the increase recorded by Oyo (₦38.3 billion).
  • Oyo, Kano, Borno, and Jigawa rounded out the top five states with the largest increases in FAAC allocations.

Ethiopia achieved Africa’s fastest growth in real GDP per person over the 25 years to 2025
  • Ethiopia recorded Africa's fastest real GDP per capita growth between 2000 and 2025.
  • Rwanda ranked second, while Sierra Leone, Tanzania and Djibouti completed the top five.
  • Ethiopia's real GDP per capita rose 322%, from $910 to $3,843.
  • Mauritius recorded Africa's largest absolute gain in real GDP per capita.
  • Nigeria ranked 15th, with real GDP per capita increasing 76.7%.

Holding companies accounted for nearly 68% of Nigeria’s US direct investment balance in 2025
  • Nigeria held Africa’s fourth-largest US direct investment balance in 2025, at $4.56 billion.
  • The balance fell by $1.98 billion from $6.54 billion in 2024, a decline of 30.3%.
  • Nonbank holding companies accounted for $3.08 billion, or 67.7% of Nigeria’s total balance.
  • Manufacturing represented $552 million, or 12.1%, while other industries accounted for $921 million.
  • Holding-company assets may ultimately be deployed in other sectors, so the classification does not show their final use.

US direct investment balance in Africa fell to $37.9 billion in 2025, its lowest since 2008
  • US direct investment in Africa peaked at $69 billion in 2014 after expanding rapidly from the mid-2000s.
  • By 2025, the balance had fallen 45.1% from its peak to $37.9 billion, its lowest since 2008.
  • Mining drove the cycle, accounting for 88% of the 2010–2014 increase and 97% of the subsequent decline.
  • Africa’s share of the global US direct investment balance remained below 3% throughout 1985–2025.
  • The post-2014 decline was interrupted by brief recoveries in 2017 and 2021–2022.

The top ten countries held 98% of Africa’s US direct investment balance in 2025
  • Mauritius held Africa’s largest US direct investment balance in 2025, at $8.4 billion.
  • South Africa followed with $7.9 billion, ahead of Egypt’s $6.7 billion and Nigeria’s $4.6 billion.
  • Africa’s total balance fell by 8.4% to $37.91 billion, its third consecutive annual decline.
  • The top ten countries held 98% of Africa’s total, leaving only $0.7 billion across the rest.
  • Manufacturing led South Africa’s balance, mining dominated Egypt’s, and holding companies accounted for most of Nigeria’s.

South Africa and Egypt accounted for a third of Africa’s estimated $1.93tn government debt in 2025
  • Government debt across 51 African countries was estimated at $1.93 trillion in 2025.
  • South Africa and Egypt had the largest estimated stocks and jointly accounted for 33.8% of the total.
  • Sudan had the highest debt-to-GDP ratio at 187.6%, followed by Senegal at 130.2%.
  • The estimates use IMF debt ratios and current-dollar GDP, not national authorities’ reported debt stocks.
  • Differences in government coverage, instruments and valuation mean the figures are comparable estimates, not fully harmonised official data.

POPULAR TOPICS
SIGN UP TO OUR NEWSLETTER
Get periodic updates about the African startup space, access to our reports, among others.
Subscribe Here
Subscription Form

A product of Techpoint Africa. All rights reserved