In the last one year, petrol prices in Nigeria fluctuated, reaching the maximum average price (₦1,262) in March 2025, before dropping gradually

  • Petrol prices in Nigeria rose by 52% between August 2024 (₦830.5) and March 2025 (₦1,261.7).
  • The highest monthly increase was in September 2024 (+24.1%), while the sharpest drop came in April 2025 (-17.1%).
  • By July 2025, prices had eased to ₦1,025, still 23% higher than a year earlier.
  • NNPC retail outlets offered significantly lower prices than the national average, with Abuja as low as ₦880 at the March 2025 peak.
  • Dangote Refinery offered relatively competitive pricing, ranging from ₦840 to ₦899, creating an alternative supply option.

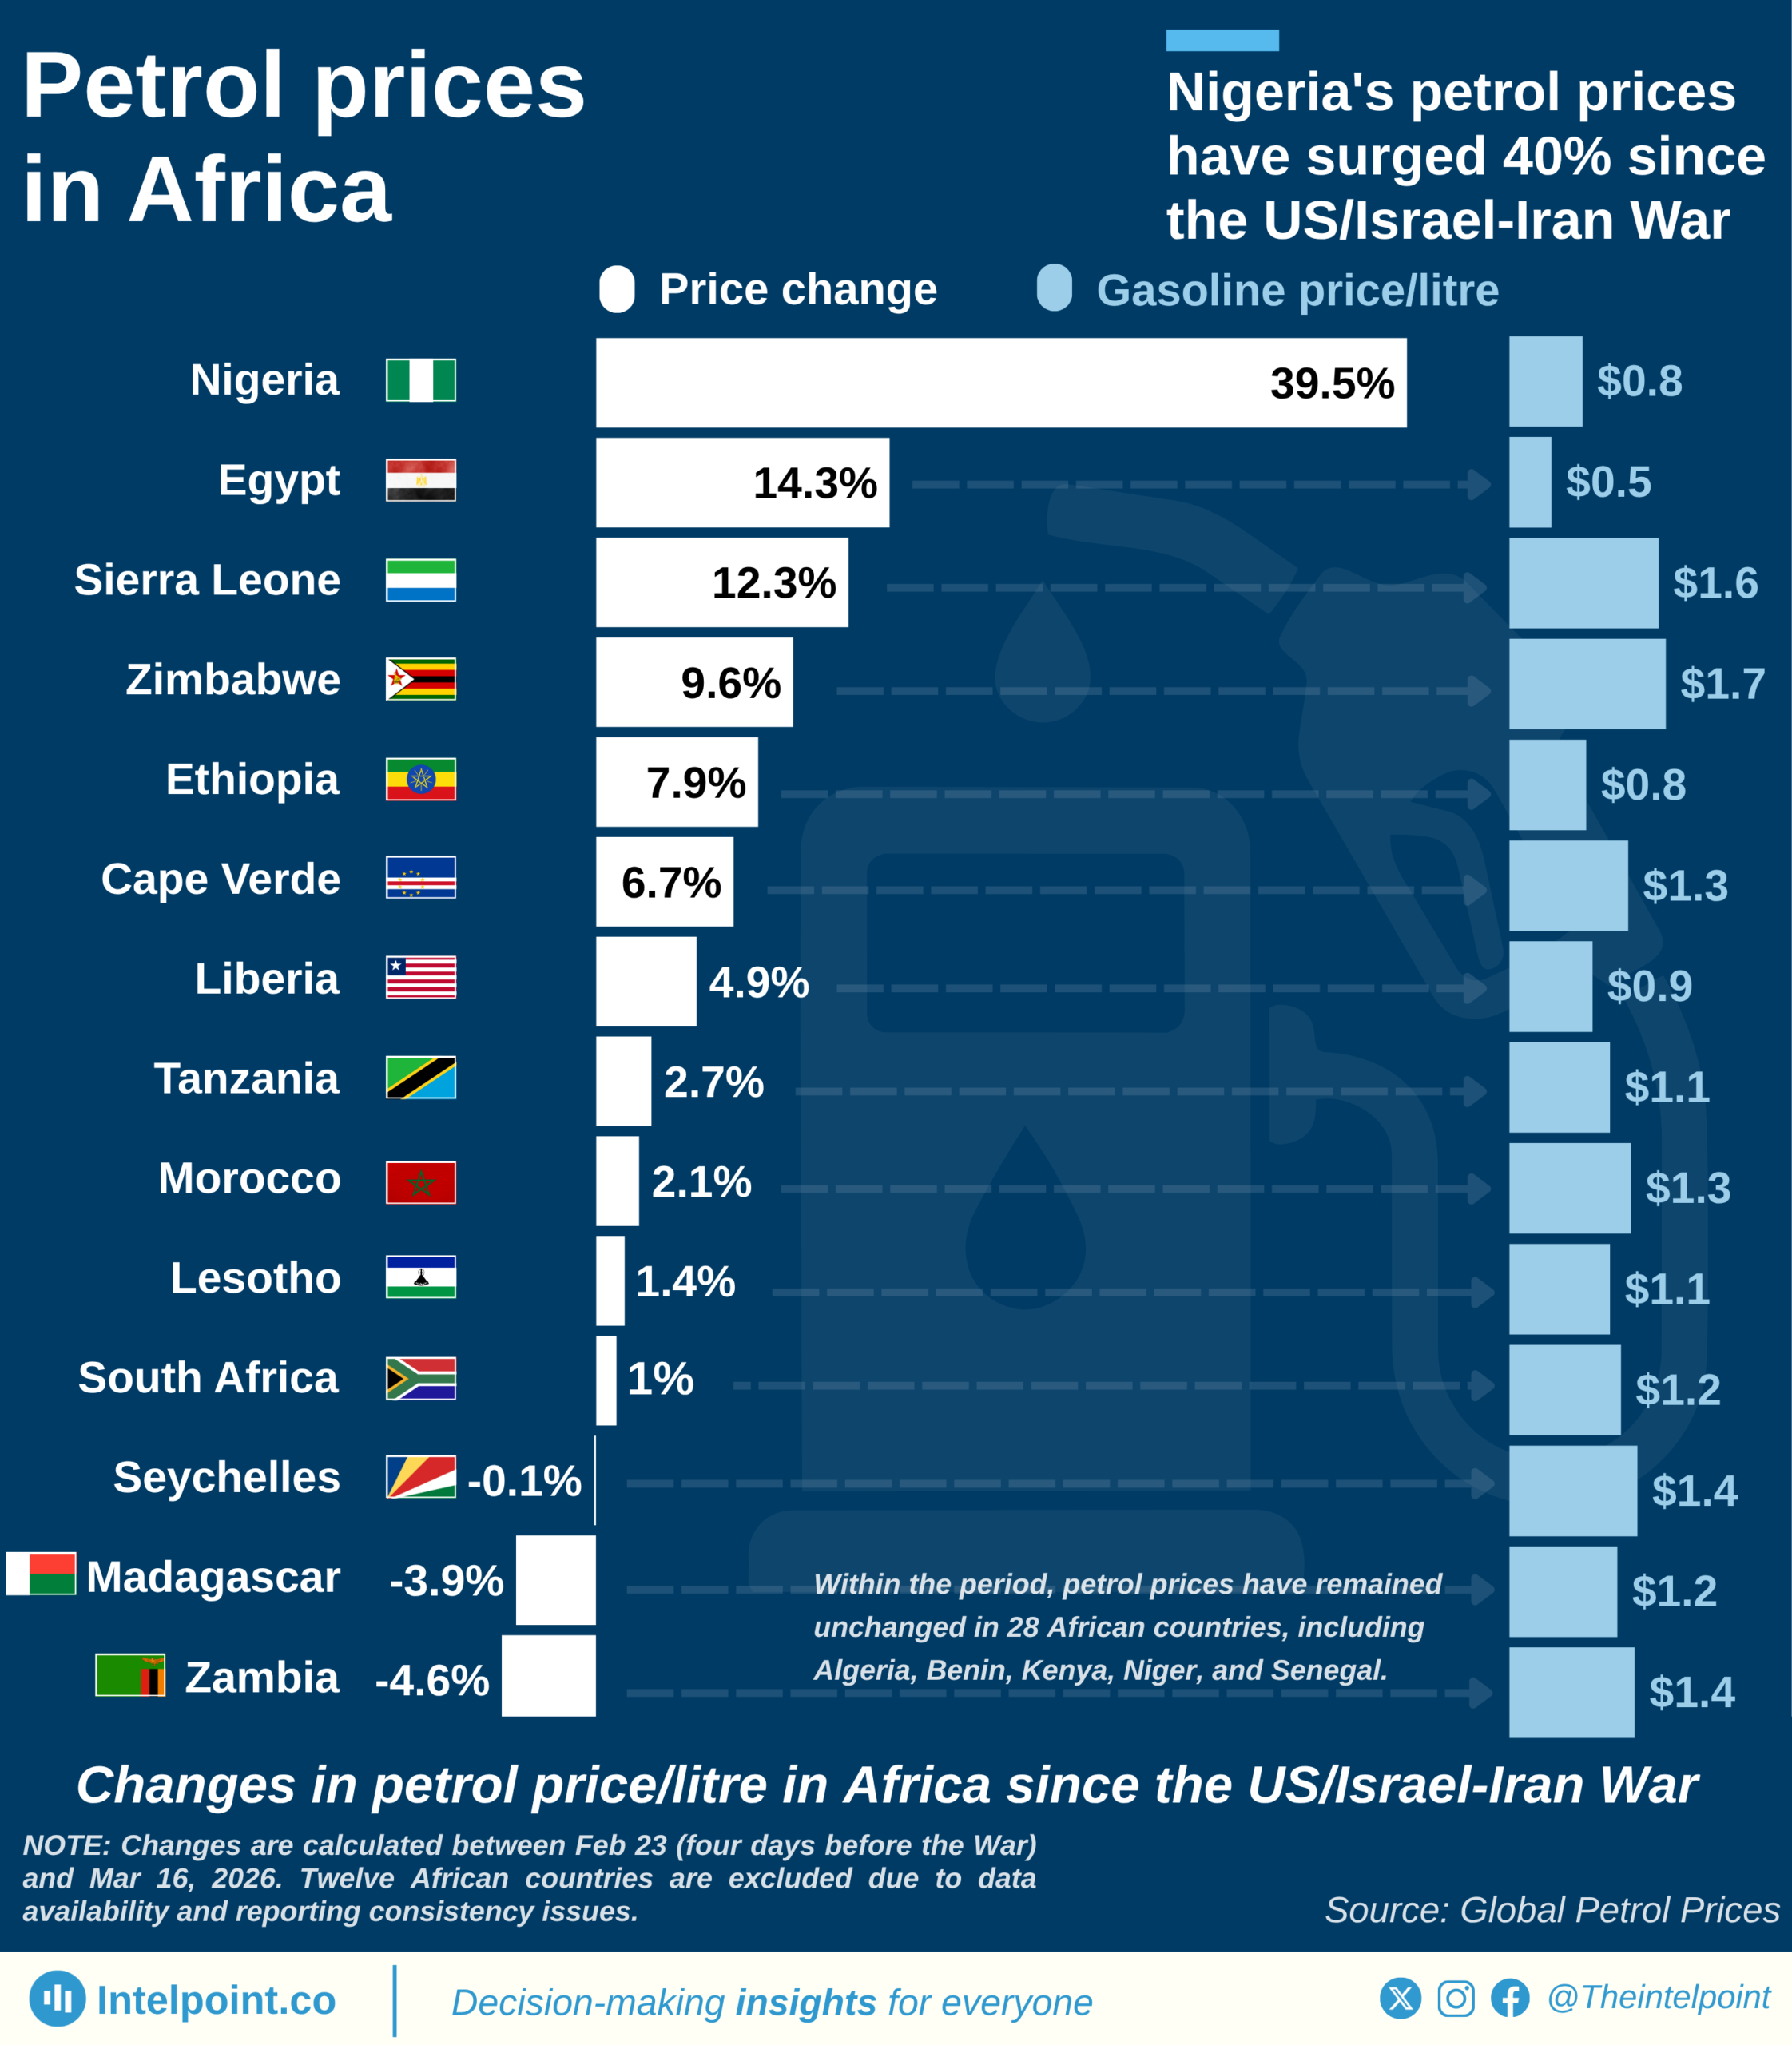
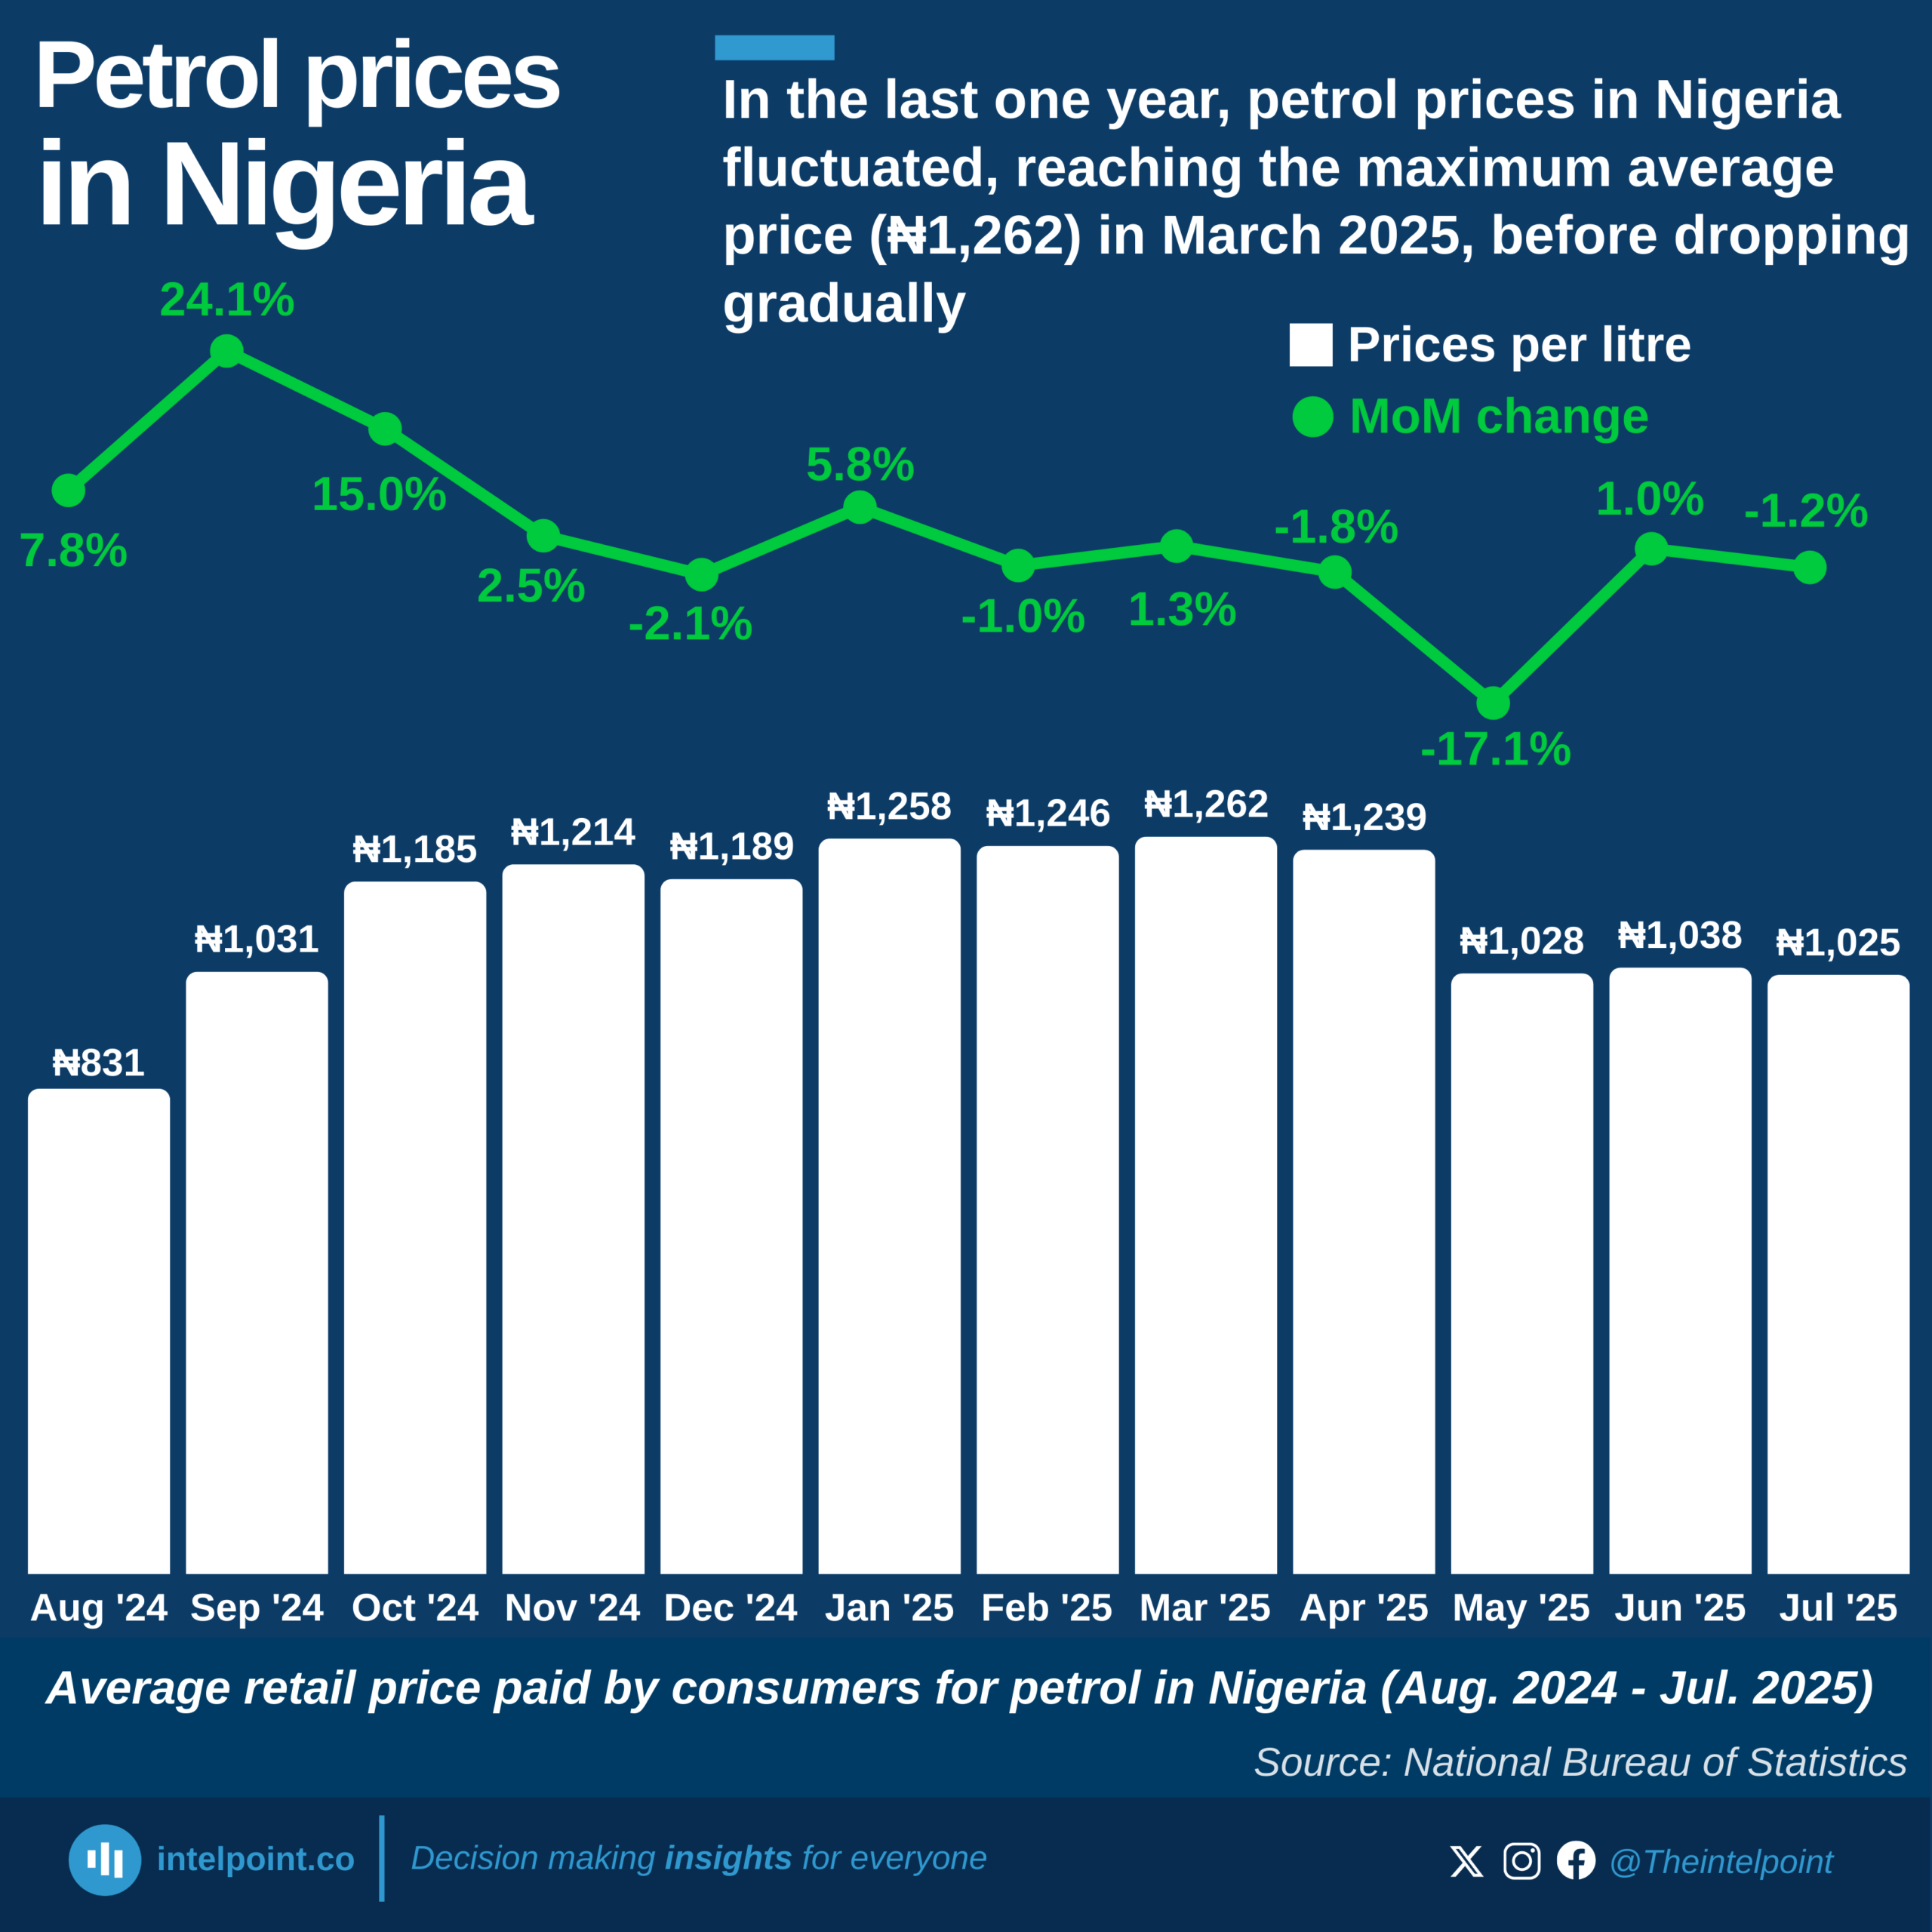
Nigeria’s petrol prices have experienced sharp fluctuations over the past year. The average national petrol price climbed from ₦830.5 in August 2024 to a peak of ₦1,261.7 in March 2025, before dropping back to around ₦1,025 in July 2025. This volatility highlights the ongoing instability in Nigeria’s fuel market, influenced by policy changes, global oil trends, and domestic supply factors.

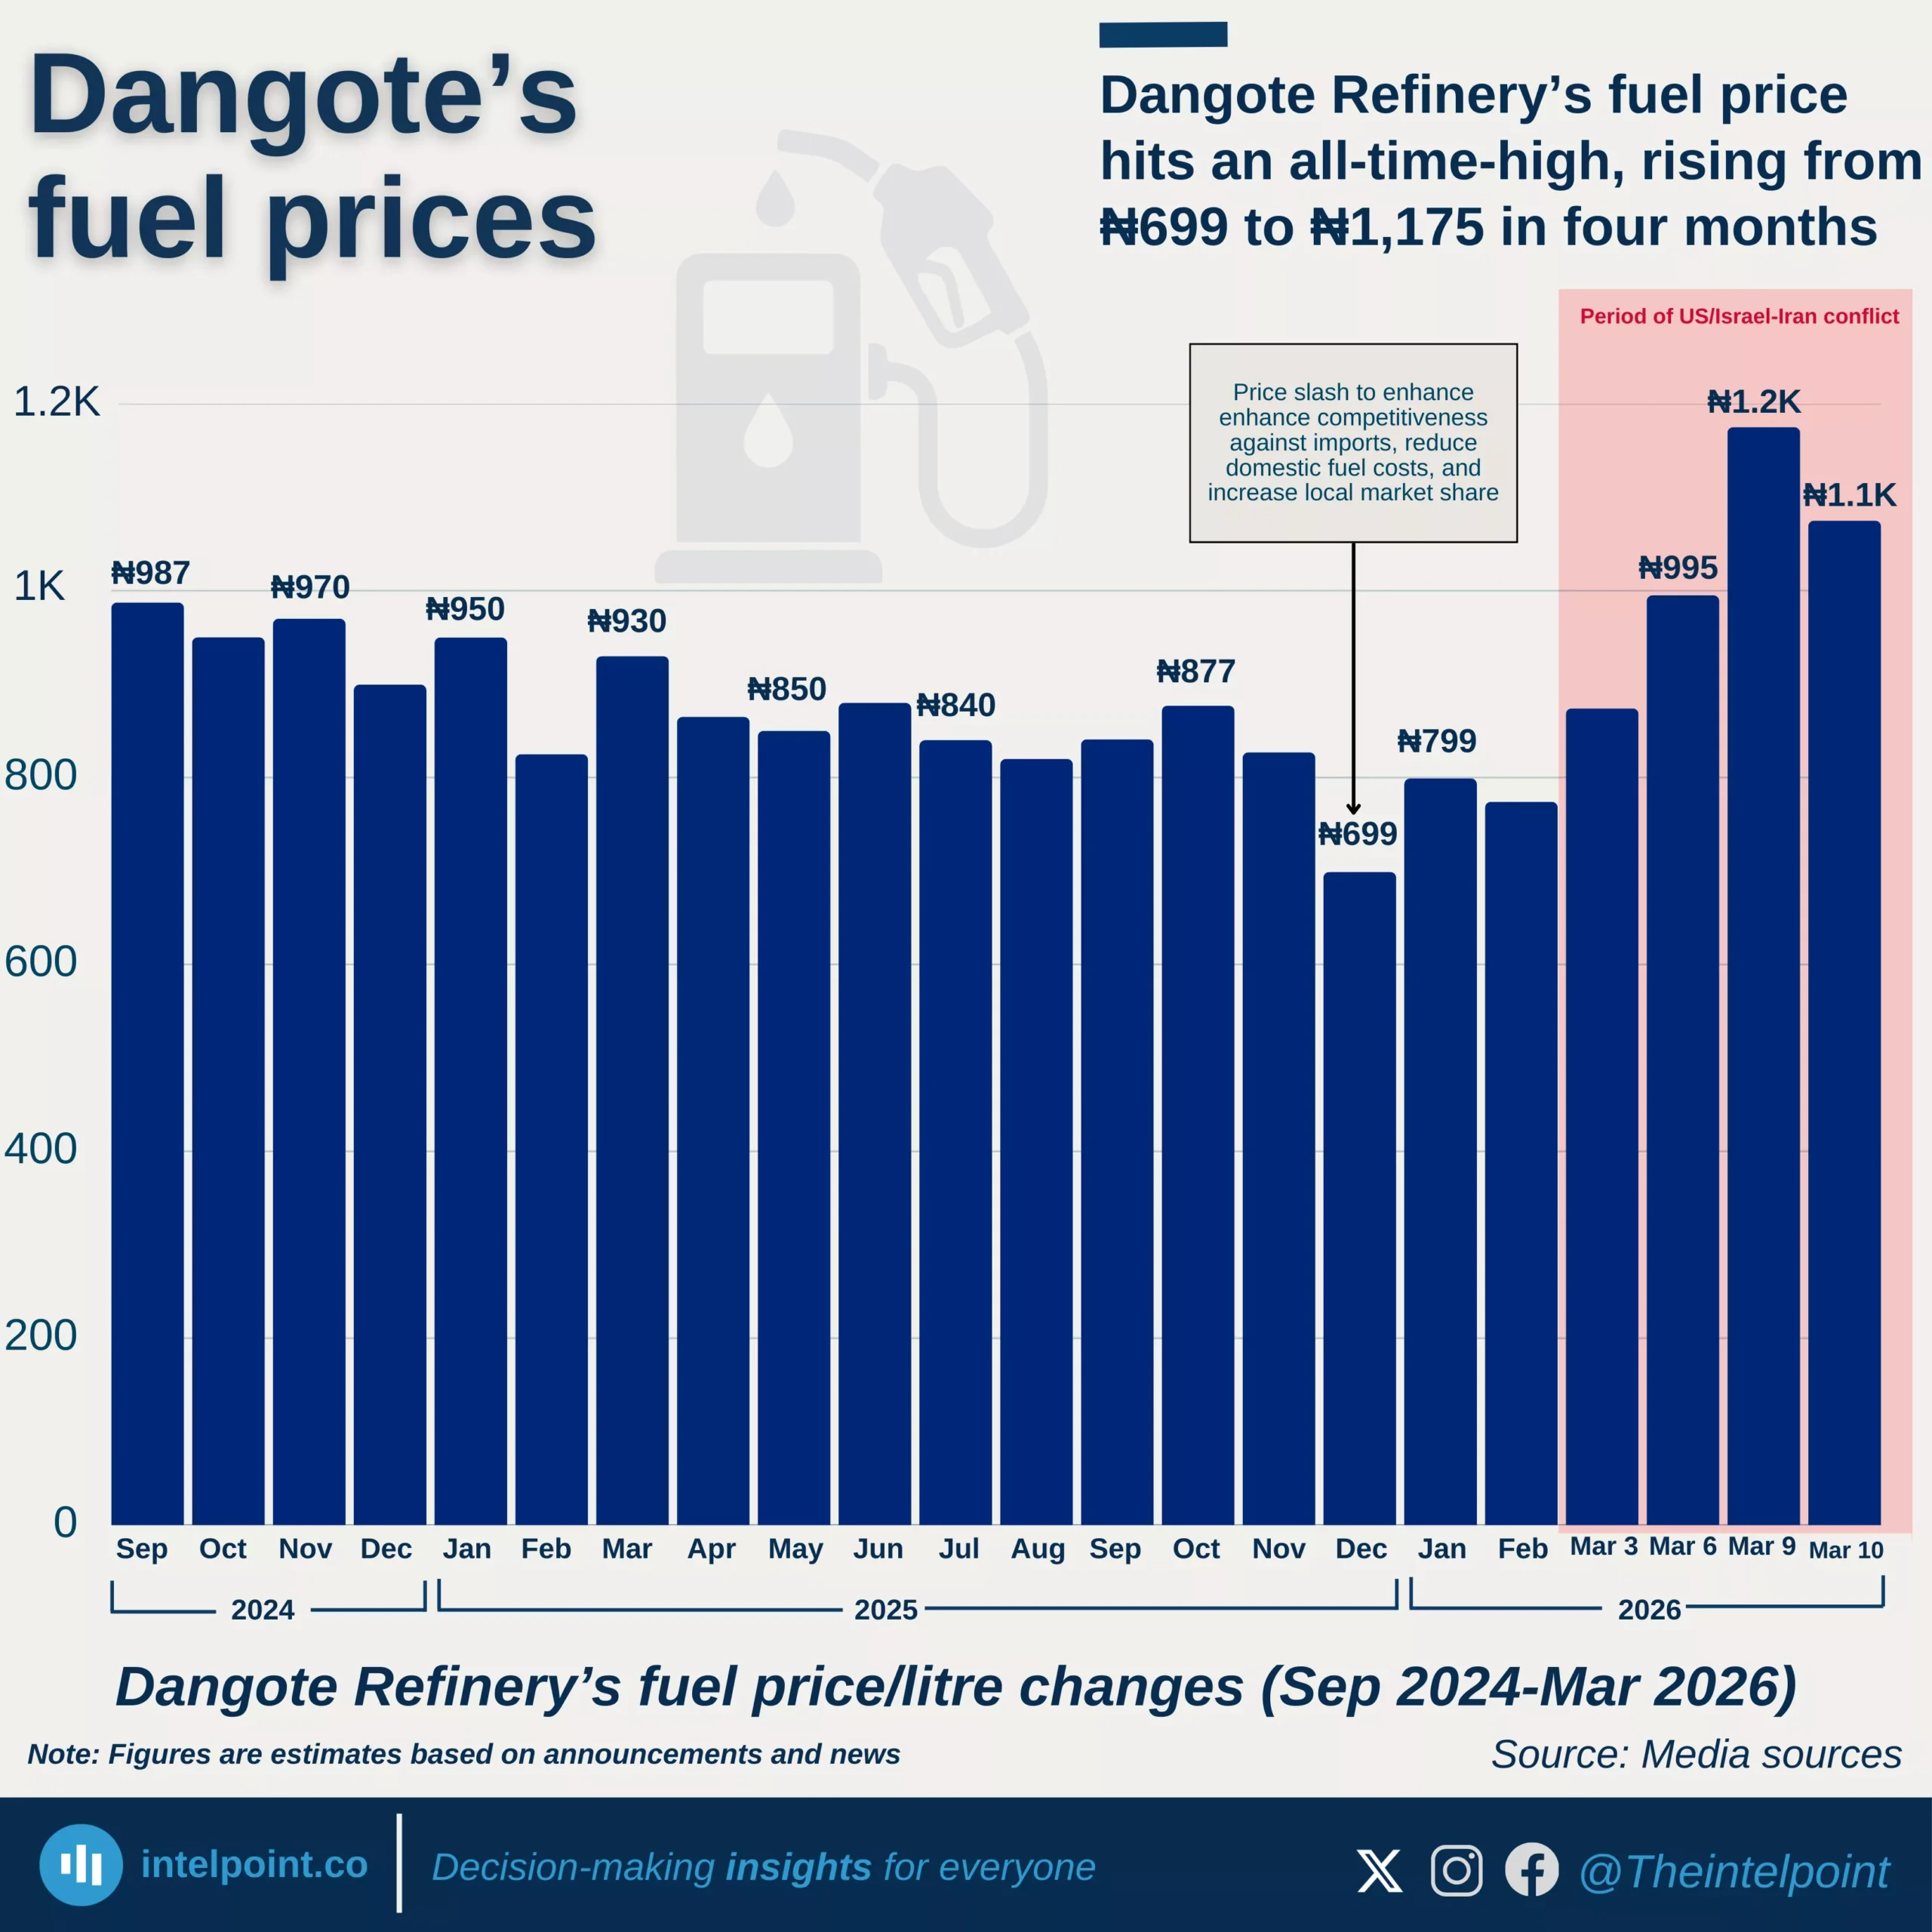
A closer look also reveals differences across regions and suppliers. While the national average peaked at ₦1,261.7 in March 2025, NNPC prices were much lower, with Abuja recording as low as ₦880 and Lagos at ₦860. Dangote Refinery's prices also varied, ranging from ₦899 in December 2024 to ₦840 by July 2025.

Source:

National Bureau of Statistics

Period:

August 2024-July 2025
HTML code to embed chart
Want a bespoke report?
Reach out
Tags
Related Insights

Nigeria’s renewable energy capacity held steady at 2.1–2.3 GW from 2015 to 2021, then surged from 2022 onward
  • Nigeria’s renewable energy capacity grew from 2.1 GW in 2015 to 3.7 GW in 2024.
  • This represents a 76% increase over the decade.
  • The compound annual growth rate (CAGR) was 5.7% between 2015 and 2024.
  • From 2015 to 2020, capacity was stagnant at around 2.2 GW.
  • The biggest growth year was 2022, with a sharp 34.9% increase.
  • Capacity stagnated in 2023 at 3.1 GW before climbing again in 2024.
  • Nigeria’s renewable growth remains modest compared to its population size and energy demand.

From 2015 to 2024, Morocco's renewable capacity grew from 2.4 GW to 4.0 GW, a 67% increase
  • Morocco’s renewable energy capacity grew from 2.4 GW in 2015 to 4.0 GW in 2024.
  • This represents a 67% increase over the decade.
  • The compound annual growth rate (CAGR) was 5.3% between 2015 and 2024.
  • Capacity was stagnant at 2.4 GW from 2015 to 2017 before growth resumed.
  • The biggest single-year increase happened in 2022, with a 13.7% jump.
  • Capacity additions slowed in 2023 (3.7 GW) and 2024 (4.0 GW).

From 2015 to 2024, South Africa's renewable energy capacity more than tripled, from 3.4 GW to 13.5 GW
  • South Africa’s renewable energy capacity grew from 3.4 GW in 2015 to 13.5 GW in 2024.
  • The country recorded a CAGR of 14.7% over the period.
  • The biggest annual growth was in 2016, when capacity surged by 49.2%.
  • Stagnation occurred in 2021 (0.8% growth) and 2023 (0.0%), reflecting project delays or policy issues.
  • The most recent increase was in 2024, when capacity rose to 13.5 GW, showing renewed momentum.
  • South Africa’s renewable energy capacity is more than three times Nigeria’s 3.7 GW in 2024.

From 2015 to 2024, Kenya's renewable capacity almost doubled, increasing from 1.6 GW to 3.1 GW
  • Kenya’s renewable energy capacity grew from 1.6 GW in 2015 to 3.1 GW in 2024.
  • This represents a near doubling of capacity in less than a decade.
  • The compound annual growth rate (CAGR) was 6.9% between 2015 and 2024.
  • The largest single-year jump came in 2016 with a 23.2% increase.
  • Kenya faced a setback in 2021 when capacity dipped by -8.6%.
  • A strong rebound occurred in 2022 (+15.5%), reaffirming momentum.

In 2024, Egypt’s renewable capacity reached 11.8 GW, up 5.6 GW from 2015
  • Egypt’s renewable capacity grew from 6.2 GW in 2015 to 11.8 GW in 2024.
  • This represents a net increase of 5.6 GW over the decade.
  • Egypt recorded a 6.5% compound annual growth rate (CAGR) from 2015 to 2024.
  • Between 2015 and 2019, growth was very slow, with capacity almost flat.
  • The turning point came in 2020, when expansion began to pick up pace.
  • The largest jump occurred in 2022, with a 26.3% year-over-year increase.
  • By 2024, Egypt’s renewable capacity was more than three times Nigeria’s 2024 level of 3.7 GW.

Ethiopia’s renewable energy capacity grew at an 8.6% compound annual rate from 2015 to 2024
  • Ethiopia’s renewable capacity grew from 2.6 GW in 2015 to 6.0 GW in 2024.
  • The country achieved an 8.6% compound annual growth rate over this period.
  • Ethiopia’s capacity is higher than Nigeria’s 3.7 GW in 2024, despite Nigeria’s larger economy.
  • The biggest surge occurred in 2017, with a 64.9% year-over-year increase.
  • Growth was steady but modest between 2017 and 2021, averaging small annual increments.
  • A slight dip occurred in 2023, but Ethiopia recovered to 6.0 GW in 2024.

POPULAR TOPICS
SIGN UP TO OUR NEWSLETTER
Get periodic updates about the African startup space, access to our reports, among others.
Subscribe Here
Subscription Form

A product of Techpoint Africa. All rights reserved