For every $1 Ghana earns from exporting pharmaceutical products, it spends about $22 on imports

Key takeaways:

  • For every $1 Ghana earns from pharmaceutical exports, it spends about $22 on imports, underscoring the country’s overwhelming dependence on foreign pharmaceutical products.
  • Ghana is a net importer of medicine and has been for nearly two decades.
  • By 2015, Ghana’s pharmaceutical imports reached its peak with $348.12m while exports were $3.10m, meaning imports were nearly 100 times larger.
  • In 2016, Ghana recorded its highest-ever export performance at $78.33 million, but even then, imports stood at $154.96m, almost two times higher.

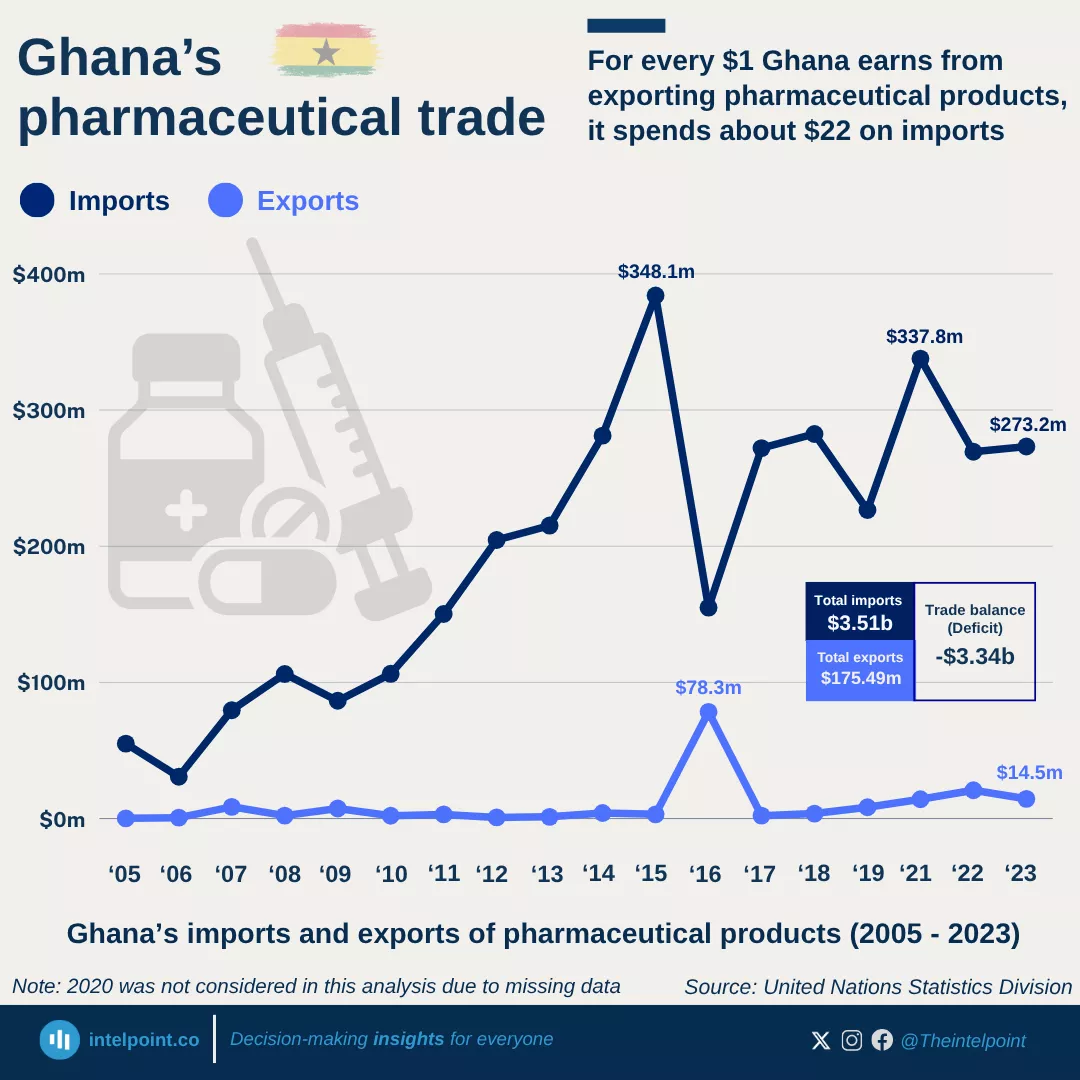
Ghana has remained a net importer of pharmaceuticals for nearly two decades. Between 2005 and 2023, imports consistently outweighed exports by a wide margin. In 2005, Ghana imported $55.03 million worth of pharmaceuticals but exported only $191,000. A similar pattern followed in 2006 ($30.72m vs. $668,000) and 2007 ($79.59m vs. $8.63m).

From 2009 to 2014, import bills rose steadily, peaking at $348.12 million in 2015 against just $3.10 million in exports. The lone exception came in 2016, when exports reached a record $78.33 million — yet imports were still almost double at $154.96 million.

Overall, for every $1 Ghana earns from pharmaceutical exports, it spends about $22 on imports, underscoring its enduring dependence on foreign pharmaceutical supplies despite modest export gains.

Source:

United Nations Statistics Division

Period:

2005 - 2023
HTML code to embed chart
Want a bespoke report?
Reach out
Tags
Related Insights

After three years of decline, China-Nigeria export trade hit a new peak of $24.9bn in 2025
  • Export value more than doubled from $9.72 billion in 2016 to $24.91 billion in 2025.
  • Trade rose steadily between 2016 and 2019, then surged sharply in 2021.
  • Exports declined for three consecutive years (2022–2024) after the 2021 peak.
  • 2025 marks the highest export value in the ten-year period.

China's top 10 African export destinations take about 66% of its exports to the continent in 2025
  • Nigeria leads by a clear margin, receiving the highest export value at $24.91bn.
  • Large, diversified economies dominate the top tier, with South Africa and Egypt ranking among the biggest destinations.
  • Resource-linked trade remains significant, with countries like Liberia and Algeria absorbing substantial export value.
  • Trade reach is geographically diverse, spanning West, East, and North Africa, including GhanaTanzaniaKenyaMorocco, and Guinea.

Post-pandemic trade reset lifts China–Africa exports to a record $225bn in 2025
  • Exports more than doubled in a decade, with trade rising from $92.27 billion in 2016 to $225 billion in 2025, a 144% increase.
  • The largest single jump occurred between 2020 and 2021, when exports surged by more than $34 billion.
  • From 2021 to 2024, exports climbed every year, reaching $178.91 billion before the latest surge.
  • The increase from $178.91 billion in 2024 to $225 billion in 2025 signals a new growth surge after several years of gradual increases.

Agricultural products led Kenya’s 2024 export economy, with coffee, tea, and spices generating $1.7 bn
  • Agriculture dominated Kenya’s exports, with coffee, tea, and spices alone contributing $1.7 billion, the largest single export category.
  • Mineral fuels were a surprisingly strong second, delivering $1.1 billion, and showing Kenya’s growing role in regional fuel distribution.
  • Horticultural exports (flowers, live plants, and trees) contributed $790 million, reinforcing Kenya’s global strength in floriculture.
  • All other export categories fall below $300 million individually, reflecting a long list of small but diverse export segments such as textiles, vegetables, and pharmaceuticals.

Mining led South Africa’s 2024 exports with 18.7%, as gems and precious metals generated over $20 bn
  • Gems and precious metals were the largest single export category, contributing $20.6 billion.
  • Ores and industrial minerals followed closely with $17.2 billion, showing the country’s reliance on mining.
  • Vehicles and machinery were significant non-mineral exports, with a combined $18.3 billion.
  • Agricultural and light industry products like fruits, nuts, and beverages contributed modestly, strengthening mining and manufacturing’s position as the core export drivers.

Cocoa accounted for 4.6% of Nigeria’s 2024 exports, making it the country’s second-largest export after oil
  • Mineral fuels (including crude oil) accounted for $49.3 billion, or 86.8% of total exports in 2024.
  • Non-oil exports remained marginal, with the second-largest item, cocoa, contributing only 4.6%.
  • Fertilisers, ores, slag, ash, and oilseeds collectively made up less than 5%, indicating limited diversification.
  • All other export categories each contributed 1% or less, underscoring Nigeria’s narrow export base.

POPULAR TOPICS
SIGN UP TO OUR NEWSLETTER
Get periodic updates about the African startup space, access to our reports, among others.
Subscribe Here
Subscription Form

A product of Techpoint Africa. All rights reserved