Ethiopia’s FDI inflows rose from $10M in the 1990s to $3.98B in 2024, with its sharpest growth phase recorded from 2014–2016

Key Takeaways

  • Ethiopia recorded a total of $46.43 billion in foreign direct investment between 1990 and 2024.
  • Its annual FDI inflows surged from just $10 million in 1990 to $3.98 billion in 2024, reflecting massive investor interest over time.
  • The country experienced three major FDI booms in 1997–2004, 2011–2014, and 2015–2016, driven by policy reforms and industrial expansion.
  • After a pandemic-era dip in 2020, Ethiopia rebounded strongly in 2021 with $4.26 billion in inflows, maintaining high investment momentum through 2024

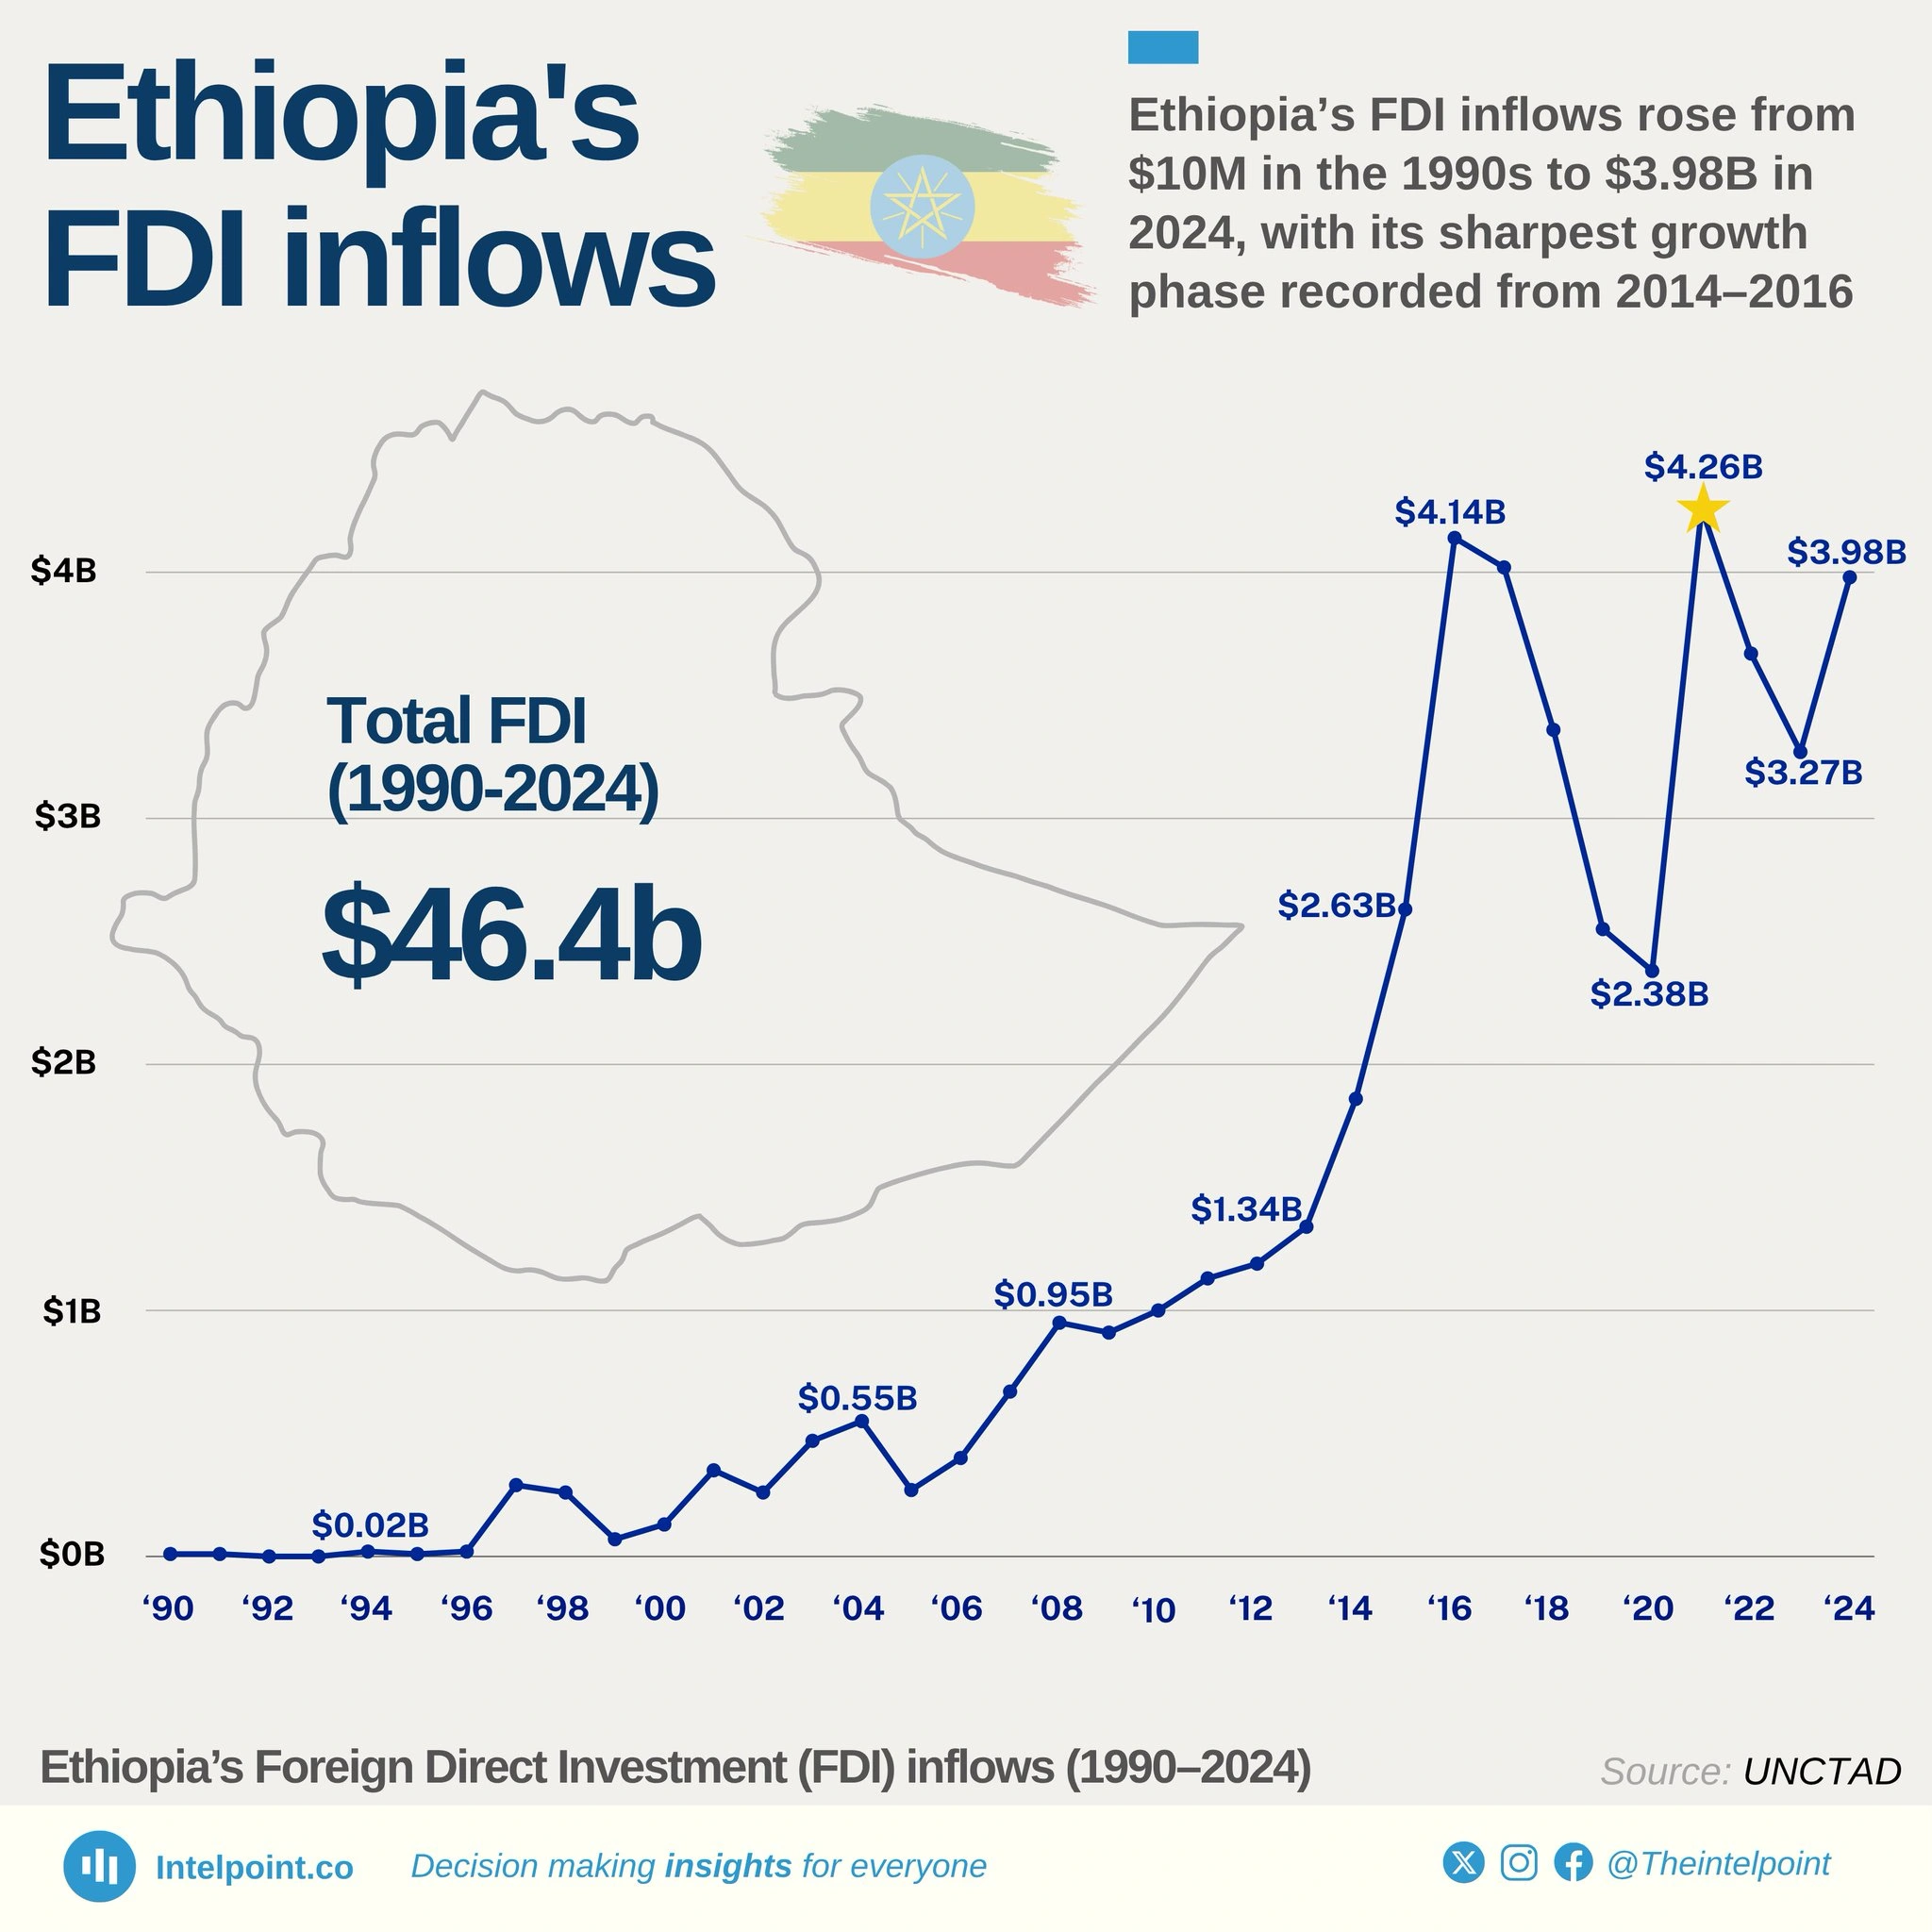
Ethiopia’s FDI inflows were minimal in the early 1990s, staying at or below $0.02 billion annually until 1996. A notable increase occurred in 1997, when inflows jumped to $0.29 billion, followed by $0.26 billion in 1998. After a brief decline in 1999 and 2000, inflows rose again, reaching $0.47 billion by 2003 and $0.55 billion in 2004.

There was a dip in 2005 to $0.27 billion, but flows picked up from 2006 onwards, crossing the $1 billion mark for the first time in 2010. From there, FDI inflows continued to grow steadily: $1.13 billion in 2011, $1.86 billion by 2014, and a sharp rise to $2.63 billion in 2015 and $4.14 billion in 2016.

After peaking in 2016, inflows declined slightly to $4.02 billion in 2017, then fell to $2.38 billion by 2020. A strong rebound followed in 2021, reaching $4.26 billion, before easing down to $3.67 billion in 2022, $3.27 billion in 2023, and then climbing back up to $3.98 billion in 2024.

Source:

UNCTAD

Period:

1990 - 2024
HTML code to embed chart
Want a bespoke report?
Reach out
Tags
Related Insights

Morocco hit its $3.5B FDI peak twice, in 2014 and 2018
  • Morocco recorded a total of $54.58 billion in FDI over the past 34 years.
  • Morocco's FDI inflows peaked twice, in 2014 and 2018, both $3.5 billion.
  • The lowest FDI inflow Morocco recorded was in 1990, amounting to $0.17 billion.
  • From 2006 onward, Morocco's FDI inflows remained mostly above $1 billion, with fluctuations.
  • The most recent year, 2024, showed a modest recovery after a significant dip in 2023.

South Africa witnessed a record FDI inflow spike in 2021 with $40.22b, followed by a sharp decline in 2022
  • In 2021, there was a record-breaking spike to $40.22 billion, far exceeding all previous years.
  • This surge was temporary, as FDI dropped to $9.28B in 2022 and fell further to $2.47B in 2024.
  • Other notable peaks occurred in 2008 ($9.21B) and 2013 ($8.30B).
  • The data reflects volatile investor behaviour, influenced by constant global investors.
  • South Africa’s 2021 FDI spike came from a share swap between Naspers and its Dutch unit, Prosus.

DR Congo’s FDI inflows rose from near-zero in the 1990s to $3.11B in 2024, with its highest growth phase occurring between 2007 and 2012
  • The 1990s saw multiple years of flat or negative FDI, including -$0.02B in 1995 and -$0.04B in 1997.
  • FDI surged to $1.81B in 2007 and $2.94B in 2010, marking a turning point.
  • The all-time high was $3.31B in 2012, with 2024 following closely at $3.11B.
  • From 2015 to 2024, annual FDI remained steadily above $1B, signalling sustained investor confidence.

Algeria’s FDI peaked at $2.75B in 2009, plunged to a -$580M outflow in 2015, then jumped 476% from $250M in 2022 to $1.44B in 2024.
  • Peak FDI was in 2009 with $2.75 billion, the highest recorded in the 1990–2024 period.
  • The year 2015 saw a rare negative inflow of -$580 million, marking Algeria’s only net FDI loss in the last three decades.
  • FDI inflows rose significantly between 2005 and 2011, consistently staying above $1 billion each year.
  • After the 2015 drop, inflows recovered modestly, hovering between $1.1B and $1.6B from 2016 to 2020.
  • FDI weakened again post-2020, falling to just $250 million in 2022, before rebounding to $1.44 billion by 2024.

Egypt rebounded from a $480 million FDI loss in 2011 to $46.6 billion in 2024, an over 9,000% surge, marking its highest inflow in 30+ years
  • Egypt attracted $46.6B in FDI in 2024, the highest in 35 years and nearly quadruple 2023’s $9.8B inflow.
  • Average FDI between 1990–2023 was just $4.9B, meaning 2024’s figure is over 9× the long-term average.
  • Prior to 2024, FDI peaked at $11.6B in 2007, with only three other years, 2008, 2022, and 2023 crossing the $9B mark.
  • In 2011, Egypt recorded –$0.48B in FDI, meaning more foreign investment left the country than came in, largely due to the Arab Spring unrest.
  • The 2005–2010 period was previously Egypt’s strongest run, averaging over $8B annually before political instability triggered sharp declines.

95% of Kenya’s $27.5 billion in FDI came after 2007, with inflows peaking at $2.23 billion in 2011
  • Kenya recorded $27.5B total FDI between 1990 and 2024, with most inflows occurring after 2007.
  • From 1990 to 2006, Kenya averaged just $0.04B annually, a sign of limited foreign investor confidence in early years.
  • A major turnaround began in 2007, with FDI jumping from $0.05B to $0.90B, and peaking at $2.23B in 2011.
  • Between 2007 and 2024, Kenya received over 92% of its total FDI, a sharp shift in its investment profile.
  • FDI has stayed above $1B annually since 2009, signalling consistent investor interest in Kenya’s growing economy.

POPULAR TOPICS
SIGN UP TO OUR NEWSLETTER
Get periodic updates about the African startup space, access to our reports, among others.
Subscribe Here
Subscription Form

A product of Techpoint Africa. All rights reserved