DR Congo’s FDI inflows rose from near-zero in the 1990s to $3.11B in 2024, with its highest growth phase occurring between 2007 and 2012

Key Takeaways

  • The 1990s saw multiple years of flat or negative FDI, including -$0.02B in 1995 and -$0.04B in 1997.
  • FDI surged to $1.81B in 2007 and $2.94B in 2010, marking a turning point.
  • The all-time high was $3.31B in 2012, with 2024 following closely at $3.11B.
  • From 2015 to 2024, annual FDI remained steadily above $1B, signalling sustained investor confidence.

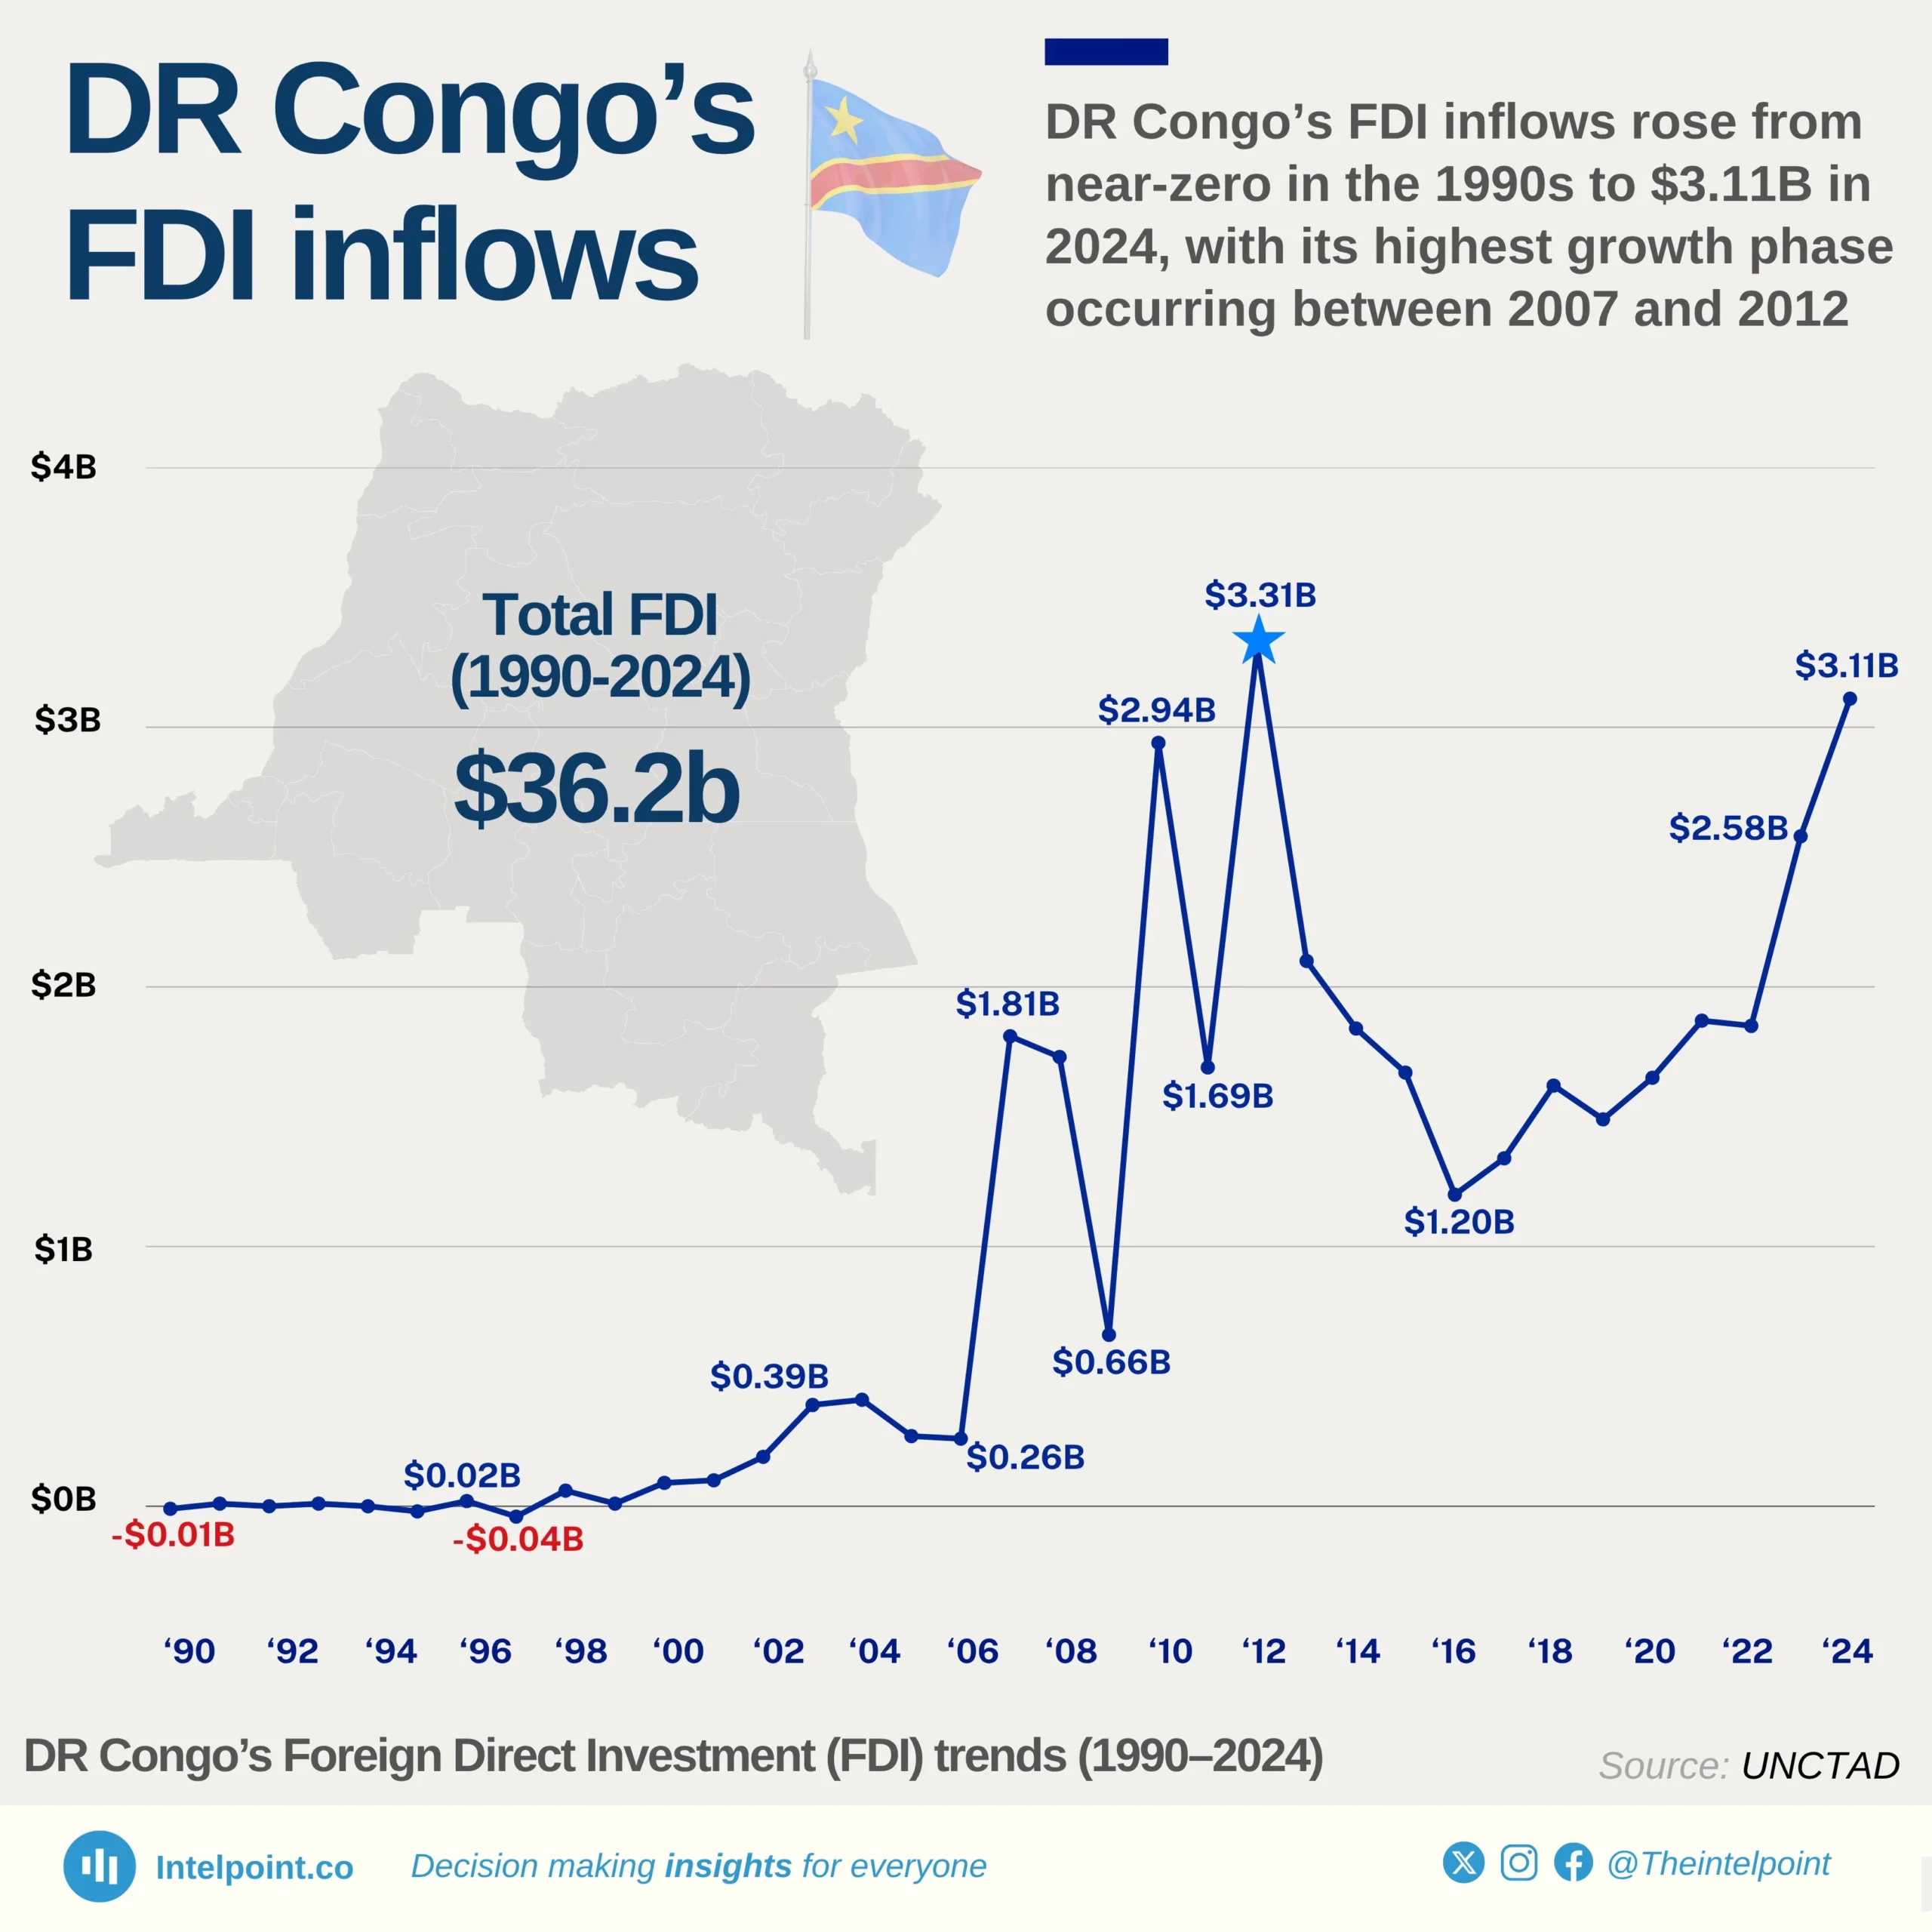
Over the last three decades, DR Congo's FDI landscape has evolved significantly. The 1990s were marked by stagnation, with FDI inflows hovering near zero and occasionally turning negative, an indicator of political and economic instability. However, starting in the early 2000s, inflows began a consistent upward climb, hitting $1.81B by 2007 and peaking at $3.31B in 2012.

Since then, DR Congo has maintained relatively stable FDI, with inflows averaging above $1.2B yearly from 2015 onward. The latest figure in 2024, $3.11B, signals a renewed investor appetite and positions DR Congo among the key African economies drawing sustained foreign capital.

Source:

UNCTAD

Period:

1990 - 2024
HTML code to embed chart
Want a bespoke report?
Reach out
Tags
Related Insights

Algeria’s FDI peaked at $2.75B in 2009, plunged to a -$580M outflow in 2015, then jumped 476% from $250M in 2022 to $1.44B in 2024.
  • Peak FDI was in 2009 with $2.75 billion, the highest recorded in the 1990–2024 period.
  • The year 2015 saw a rare negative inflow of -$580 million, marking Algeria’s only net FDI loss in the last three decades.
  • FDI inflows rose significantly between 2005 and 2011, consistently staying above $1 billion each year.
  • After the 2015 drop, inflows recovered modestly, hovering between $1.1B and $1.6B from 2016 to 2020.
  • FDI weakened again post-2020, falling to just $250 million in 2022, before rebounding to $1.44 billion by 2024.

Egypt rebounded from a $480 million FDI loss in 2011 to $46.6 billion in 2024, an over 9,000% surge, marking its highest inflow in 30+ years
  • Egypt attracted $46.6B in FDI in 2024, the highest in 35 years and nearly quadruple 2023’s $9.8B inflow.
  • Average FDI between 1990–2023 was just $4.9B, meaning 2024’s figure is over 9× the long-term average.
  • Prior to 2024, FDI peaked at $11.6B in 2007, with only three other years, 2008, 2022, and 2023 crossing the $9B mark.
  • In 2011, Egypt recorded –$0.48B in FDI, meaning more foreign investment left the country than came in, largely due to the Arab Spring unrest.
  • The 2005–2010 period was previously Egypt’s strongest run, averaging over $8B annually before political instability triggered sharp declines.

95% of Kenya’s $27.5 billion in FDI came after 2007, with inflows peaking at $2.23 billion in 2011
  • Kenya recorded $27.5B total FDI between 1990 and 2024, with most inflows occurring after 2007.
  • From 1990 to 2006, Kenya averaged just $0.04B annually, a sign of limited foreign investor confidence in early years.
  • A major turnaround began in 2007, with FDI jumping from $0.05B to $0.90B, and peaking at $2.23B in 2011.
  • Between 2007 and 2024, Kenya received over 92% of its total FDI, a sharp shift in its investment profile.
  • FDI has stayed above $1B annually since 2009, signalling consistent investor interest in Kenya’s growing economy.

Rwanda’s FDI has never crossed $1B in any year, peaking at $820M in 2024, with a 35-year total of $6.28B
  • Rwanda attracted a total of $6.28 billion in foreign direct investment (FDI) over 35 years, from 1990 to 2024.
  • The highest annual inflow recorded was $820 million in 2024, making it the country’s strongest FDI year yet.
  • Between 2020 and 2024, Rwanda pulled in $2.70 billion, accounting for over 40 percent of its total investment since 1990.
  • From 1990 to 2004, annual FDI barely exceeded $100 million, with several years recording zero inflows.
  • Even during its best-performing years, Rwanda’s FDI never hit the $1 billion threshold.

Egypt, South Africa, and Nigeria lead Africa’s $1.21 trillion cumulative FDI inflows since 1990, with $195B, $151B, and $111B respectively
  • Egypt leads with $195.2 billion in cumulative FDI inflows as of 2024.
  • South Africa follows with $151.0 billion, and Nigeria is third with $110.7 billion.
  • Only these three countries have crossed the $100 billion mark over the 34-year span.
  • Morocco and Mozambique are neck-and-neck, with around $58–59 billion each.
  • Ghana and Ethiopia show strong mid-tier performances, both near or above $45 billion.
  • DR Congo, Algeria, and Congo round out the top 10 — all with over $30 billion in long-term FDI.

After peaking at $3.88B in 2019, Ghana’s FDI fell to $1.31B in 2023, a 66% drop in four years
  • FDI inflows surged from just $0.01 billion in 1990 to a record $3.88 billion in 2019, marking a 388x increase over 30 years.
  • Between 2006 and 2019, Ghana consistently attracted over $1 billion annually, with nine of those years surpassing $3 billion.
  • The highest FDI year on record was 2019, likely reflecting peak investor confidence before the pandemic.
  • Since 2021, FDI has remained below $2 billion, with 2023 recording $1.31 billion and 2024 only slightly higher at $1.67 billion.
  • Ghana’s FDI trend reflects a pattern of post-2000 acceleration, plateauing around 2012–2015, then declining sharply post-2020.

POPULAR TOPICS
SIGN UP TO OUR NEWSLETTER
Get periodic updates about the African startup space, access to our reports, among others.
Subscribe Here
Subscription Form

A product of Techpoint Africa. All rights reserved