DR Congo was Africa's highest charcoal producer in 2023, with charcoal output containing 274.62 PJ of energy

Key takeaways:

  • The Democratic Republic of Congo is the highest charcoal-producing country in Africa with 274.62PJ (petajoules) of charcoal produced in 2023.
  • Nigeria is the ninth country on the list, with 43.76PJ.
  • The total amount of charcoal produced in Africa in 2023 was 1,367.26PJ.
  • Africa claims 69.2% of the total quantity of charcoal produced globally.

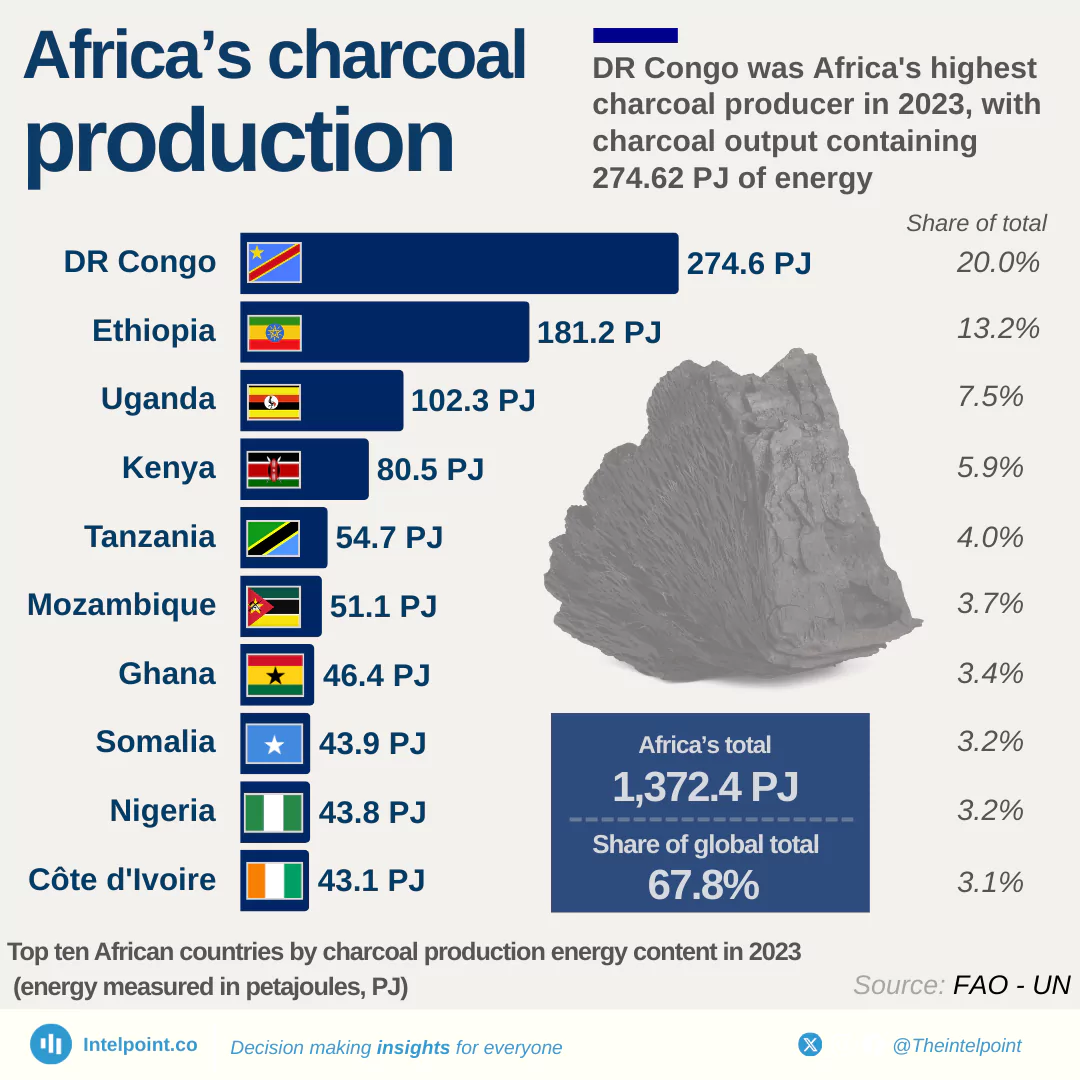
Charcoal, a solid biofuel derived from organic, renewable biomass sources, is a vital source of heat energy. In Sub-Saharan African countries like Democratic Republic of Congo, Nigeria, Côte d'Ivoire and Ghana, over 60% of households rely on charcoal as a primary cooking fuel.

In 2023, Africa produced 1,367.26PJ of charcoal, making up 69.2% of the total quantity produced globally. The Democratic Republic of Congo produced over 20% of Africa's total output. In the Democratic Republic of Congo, charcoal is a critical source of heat energy and income, especially in urban and peri-urban areas. Over 90% of urban households in the cities like Kinshasa, Goma, Kisangani, and Bunia rely on charcoal for cooking due to unstable/unreliable electricity, easy storage and transportation.

Nigeria produced over 3% of Africa's total charcoal output, ranking it the 9th highest charcoal-producing country in Africa. It can be seen that although DRC and Nigeria are both Sub-Saharan African countries, they have varying values of production due to demand and percentage of usage.

Source:

Food and Agriculture Organization of the United Nations

Period:

2023
HTML code to embed chart
Want a bespoke report?
Reach out
Tags
Related Insights

Nigeria’s renewable energy capacity held steady at 2.1–2.3 GW from 2015 to 2021, then surged from 2022 onward
  • Nigeria’s renewable energy capacity grew from 2.1 GW in 2015 to 3.7 GW in 2024.
  • This represents a 76% increase over the decade.
  • The compound annual growth rate (CAGR) was 5.7% between 2015 and 2024.
  • From 2015 to 2020, capacity was stagnant at around 2.2 GW.
  • The biggest growth year was 2022, with a sharp 34.9% increase.
  • Capacity stagnated in 2023 at 3.1 GW before climbing again in 2024.
  • Nigeria’s renewable growth remains modest compared to its population size and energy demand.

From 2015 to 2024, Morocco's renewable capacity grew from 2.4 GW to 4.0 GW, a 67% increase
  • Morocco’s renewable energy capacity grew from 2.4 GW in 2015 to 4.0 GW in 2024.
  • This represents a 67% increase over the decade.
  • The compound annual growth rate (CAGR) was 5.3% between 2015 and 2024.
  • Capacity was stagnant at 2.4 GW from 2015 to 2017 before growth resumed.
  • The biggest single-year increase happened in 2022, with a 13.7% jump.
  • Capacity additions slowed in 2023 (3.7 GW) and 2024 (4.0 GW).

From 2015 to 2024, South Africa's renewable energy capacity more than tripled, from 3.4 GW to 13.5 GW
  • South Africa’s renewable energy capacity grew from 3.4 GW in 2015 to 13.5 GW in 2024.
  • The country recorded a CAGR of 14.7% over the period.
  • The biggest annual growth was in 2016, when capacity surged by 49.2%.
  • Stagnation occurred in 2021 (0.8% growth) and 2023 (0.0%), reflecting project delays or policy issues.
  • The most recent increase was in 2024, when capacity rose to 13.5 GW, showing renewed momentum.
  • South Africa’s renewable energy capacity is more than three times Nigeria’s 3.7 GW in 2024.

From 2015 to 2024, Kenya's renewable capacity almost doubled, increasing from 1.6 GW to 3.1 GW
  • Kenya’s renewable energy capacity grew from 1.6 GW in 2015 to 3.1 GW in 2024.
  • This represents a near doubling of capacity in less than a decade.
  • The compound annual growth rate (CAGR) was 6.9% between 2015 and 2024.
  • The largest single-year jump came in 2016 with a 23.2% increase.
  • Kenya faced a setback in 2021 when capacity dipped by -8.6%.
  • A strong rebound occurred in 2022 (+15.5%), reaffirming momentum.

In 2024, Egypt’s renewable capacity reached 11.8 GW, up 5.6 GW from 2015
  • Egypt’s renewable capacity grew from 6.2 GW in 2015 to 11.8 GW in 2024.
  • This represents a net increase of 5.6 GW over the decade.
  • Egypt recorded a 6.5% compound annual growth rate (CAGR) from 2015 to 2024.
  • Between 2015 and 2019, growth was very slow, with capacity almost flat.
  • The turning point came in 2020, when expansion began to pick up pace.
  • The largest jump occurred in 2022, with a 26.3% year-over-year increase.
  • By 2024, Egypt’s renewable capacity was more than three times Nigeria’s 2024 level of 3.7 GW.

Ethiopia’s renewable energy capacity grew at an 8.6% compound annual rate from 2015 to 2024
  • Ethiopia’s renewable capacity grew from 2.6 GW in 2015 to 6.0 GW in 2024.
  • The country achieved an 8.6% compound annual growth rate over this period.
  • Ethiopia’s capacity is higher than Nigeria’s 3.7 GW in 2024, despite Nigeria’s larger economy.
  • The biggest surge occurred in 2017, with a 64.9% year-over-year increase.
  • Growth was steady but modest between 2017 and 2021, averaging small annual increments.
  • A slight dip occurred in 2023, but Ethiopia recovered to 6.0 GW in 2024.

POPULAR TOPICS
SIGN UP TO OUR NEWSLETTER
Get periodic updates about the African startup space, access to our reports, among others.
Subscribe Here
Subscription Form

A product of Techpoint Africa. All rights reserved