China's importation of Liquefied Natural Gas (LNG) falls by over 55% in 2 years, falling from $44B in 2021 to $19B in 2023

Key takeaways:

  • China's total LNG imports dropped by over 55%, from $44 billion in 2021 to $19.4 billion in 2023, showing a significant reduction in demand and a shift in sourcing.
  • Australia, which was China’s largest LNG supplier in 2021 ($16.3 billion), is no longer among the sources in 2023, signaling a shift in China’s energy diversification strategy.
  • Russia and Turkmenistan have emerged as dominant suppliers in 2023, with Turkmenistan leading at $9.61 billion and Russia following at $6.44 billion
  • The U.S. has nearly disappeared from China's LNG market, dropping from $6.22 billion in 2021 to just $52,400 in 2023, a staggering 99.99% decline, likely due to geopolitical tensions and trade policies.

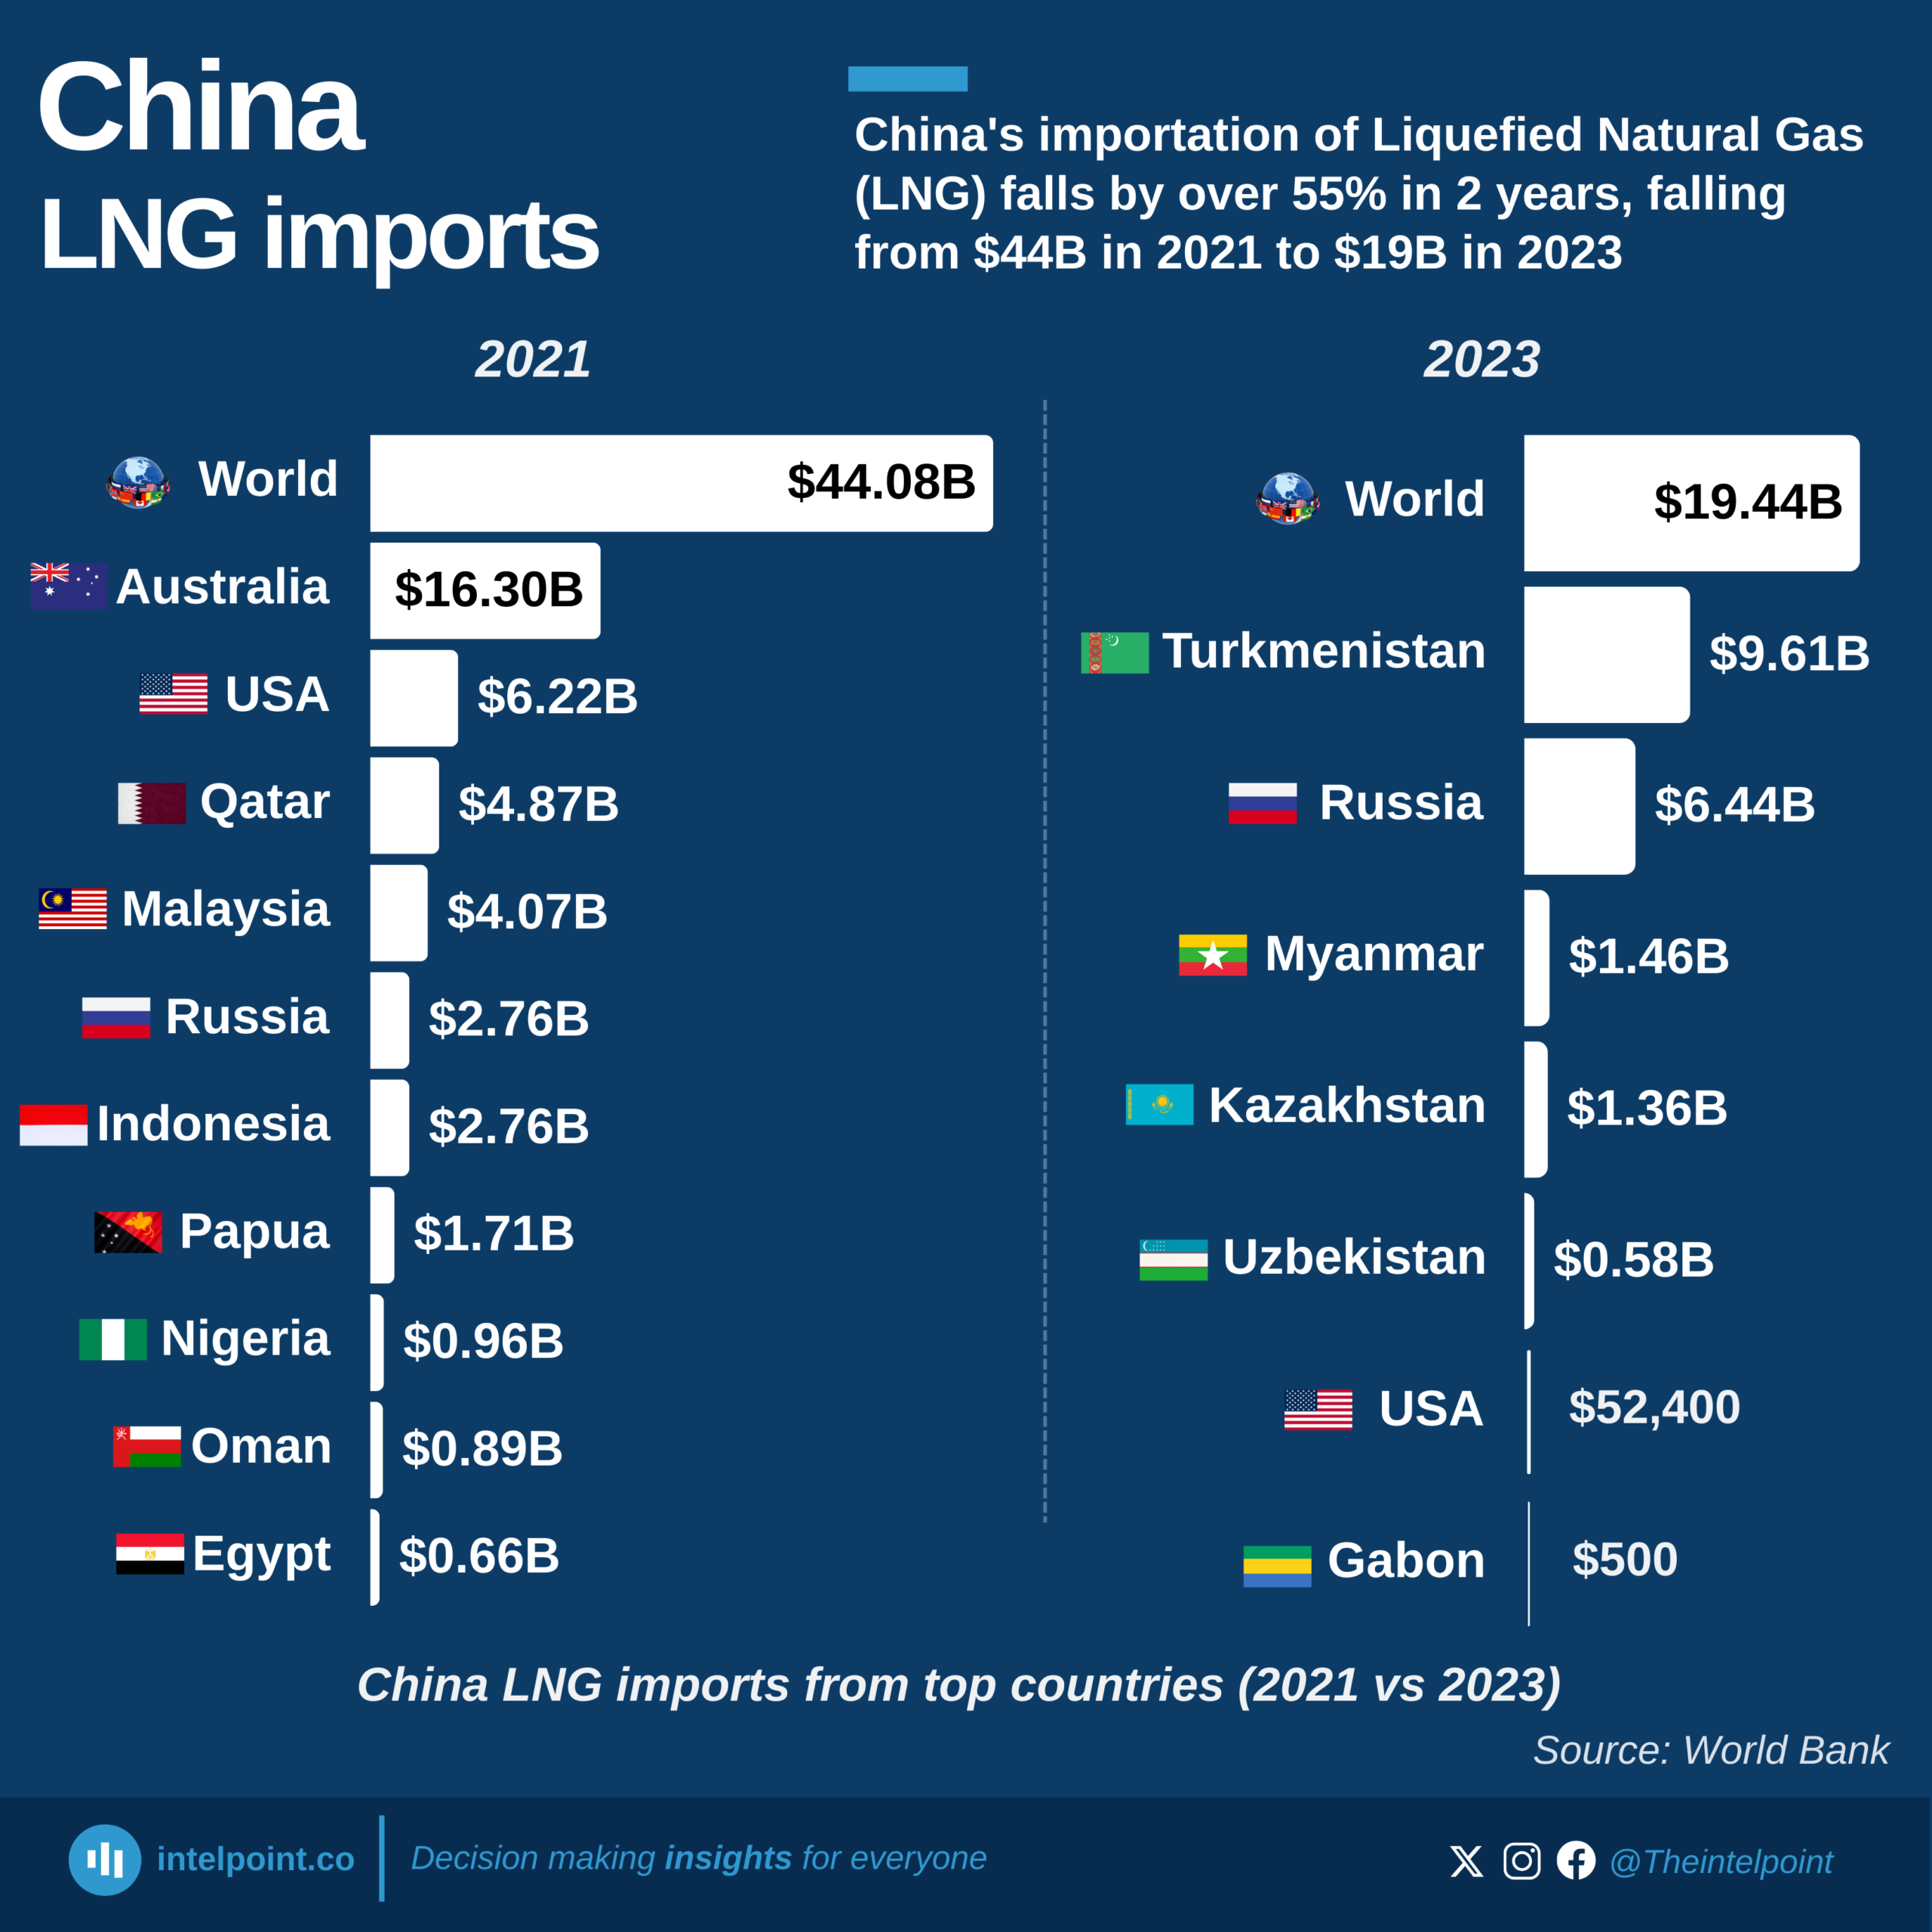
China’s importation of Liquefied Natural Gas (LNG) has declined, dropping from $44 billion in 2021 to just $19.4 billion in 2023. This steep fall of over 55% reflects a major shift in China’s energy-sourcing strategy. In 2021, Australia led as the top supplier with $16.3 billion in LNG exports to China, but by 2023, the entire landscape had changed, with Turkmenistan ($9.61 billion) and Russia ($6.44 billion) emerging as the dominant suppliers.
2021 also saw importations from Nigeria and other 26 countries, but in 2023, importations were just from 7 countries with Nigeria out of the scene.
This shift is not just about numbers, it tells a bigger story about geopolitical realignments and shifting trade preferences. The near disappearance of traditional suppliers like the U.S., Australia, and Qatar from China’s top LNG sources indicates a major transformation in global energy flows. The United States, which supplied $6.22 billion worth of LNG in 2021, saw its exports to China go down to an almost negligible $52,400 by 2023.

Source:

World Bank

Period:

2021 and 2023
HTML code to embed chart
Want a bespoke report?
Reach out
Tags
Related Insights

Eskom electricity tariff—categories and rates (2023/24, c/kWh)
  • Landlight tariffs (20A and 60A), offered primarily in rural areas, are Eskom’s highest tariff rates and are exclusive to direct (non-local authority) customers.
  • The Homelight 20A Block 1 tariff, which applies to consumption between 0–350 kWh, is the lowest among Eskom’s tariffs.
  • Landlight tariffs carry higher rates because they exclude other fixed charges such as: Ancillary service charge (c/kWh), Network demand charge (c/kWh), Network capacity charge (R/POD/day), and Service charge (R/POD/day). This structure makes Landlight more suitable for rural or low-income areas, where simplifying cost recovery is necessary.
  • Eskom classifies its tariffs into the following categories:
    • Residential Tariffs (for household electricity supply): Homelight 20A, Homelight 60A, Homepower, and Homeflex
    • Urban Tariffs (for large industrial and commercial users): Megaflex, Miniflex, Nightsave Urban (Large and Small), Business Rate, Public Lighting, Transflex (rail), and Gen-Wheeling/Offset tariffs
    • Rural Tariffs (for agricultural, business, and residential customers in rural areas): Ruraflex, Nightsave Rural, Landrate, and Landlight
    • Municipal Tariffs (for municipalities purchasing in bulk and for municipal services like water pumps or offices): Municrate, Municflex, and Public Lighting.
  • Customers with rooftop solar PV systems are required to be on the Homeflex tariff plan, which is based on Time-of-Use (ToU) pricing.
  • Several Eskom tariffs are Time-of-Use-based, where charges vary depending on peak, standard, and off-peak periods. These include: Nightsave Urban Large, Nightsave Urban Small, Megaflex, Miniflex, Homeflex, Nightsave Rural, Ruraflex, and Ruraflex Gen

South Africa electricity distribution (TWh), 2015-2024
  • Electricity distribution in South Africa reached its peak in 2018, a record high of 231 TWh.

  • The lowest electricity distribution was recorded in 2023, dropping to 206 TWh.

  • Load shedding has become a persistent challenge, with 2023 experiencing the highest number of load shedding days — 332 days in total.

  • Eskom accounts for about 80% of electricity distributed in South Africa.

Eskom’s average electricity tariff in cents per kilowatt hour (c/kWh), 2013/14—2023/24
  • Eskom’s average electricity tariff increased by approximately 162% between 2013/14 and 2023/24.
  • Tariffs are categorized into two groups based on distribution: Local Authority Tariffs and Non-Local Authority Tariffs.
  • Landlight Tariff (Non-Local Authority category) is the highest rate and in 2023/24 it stood at 608.61 c/kWh.
  • Homelight 20A (Block 1) is the lowest tariff also in the non-local authority category, at 168.78 c/kWh in 2023/24.
  • Eskom applies Time-of-Use (ToU) pricing, where tariffs vary by Time of day (peak, standard, off-peak periods) and Demand season (high-demand season: June to August and Low-demand season: September to May)


Nigeria has achieved a metering rate of 47%, with Ikeja DisCo leading the way at an impressive 78% progress
  • Ikeja DisCo leads with a 78.45% metering rate, having metered over 1.03 million customers.
  • Abuja DisCo follows closely with a 71.60% metering rate and over 924,000 metered customers.
  • Ibadan has the highest number of registered customers, but only a 44.23% metering rate.
  • Kaduna and Kano have alarmingly low metering rates of 24.92% and 24.77%, respectively.
  • Yola DisCo has the lowest metering rate at just 14.45% of its 824,700 customers.
  • Eko DisCo has a relatively high metering rate of 63.92% despite having fewer registered customers.
  • Only 4 out of 13 DisCos have metered at least half of their customer base as of March 2025.

While Kano soared with 331% growth in Q1 2025, Ibadan's deployments hit 42,685, marking a superior numerical increase of 5,596
  • Kano DisCo recorded the highest increase in metered customers with a 330.75% rise in just one quarter.
  • Aba DisCo more than doubled its metered customers, increasing by 116.87%.
  • Ikeja DisCo, despite being a top performer overall, saw a 23.62% drop in meter installations.
  • Enugu and Eko also recorded declines in quarterly deployments by 12.31% and 4.02% respectively.
  • Ibadan DisCo deployed the highest number of meters in Q1 2025 but grew at a moderate rate of 15.09%.
  • Yola DisCo experienced the steepest decline in the country, dropping by 56.70% in metered customers.

Coal demand falls by over 50% from 2007 peak, dropping from 1,705 Mtce to 833 Mtce in 2024
  • Coal demand peaked in 2007 at 1,705.1 Mtce, after a steady rise from 1,123.2 Mtce in 1974, marking a 52% increase over three decades.
  • A dramatic drop followed post 2007, with demand falling by 44.8% to 941.3 Mtce by 2020, a loss of over 763 Mtce in just 13 years.
  • Between 2020 and 2024, the decline continued, albeit more gradually, reaching 832.7 Mtce, indicating a consistent downward trend.
  • Coal consumption in 2024 is the lowest in five decades, even lower than 1974 levels, reflecting a major shift in global energy use.

POPULAR TOPICS
SIGN UP TO OUR NEWSLETTER
Get periodic updates about the African startup space, access to our reports, among others.
Subscribe Here
Subscription Form

A product of Techpoint Africa. All rights reserved