16 Nigerian public companies each have over ₦1 trillion in market capitalisation

Key takeaways

  • Airtel Africa leads the Nigerian stock market with a market cap of ₦8.11 trillion naira, followed by Dangote Cement at ₦8.10 trillion and BUA Foods at ₦7.52 trillion.
  • The largest public companies in Nigeria are mostly in financial services, industrial goods and consumer goods.
  • A total of 16 Nigerian public companies have surpassed the ₦1 trillion market cap threshold.
  • The lowest-ranked trillion-naira company, First HolCo, has a ₦1 trillion naira market cap.

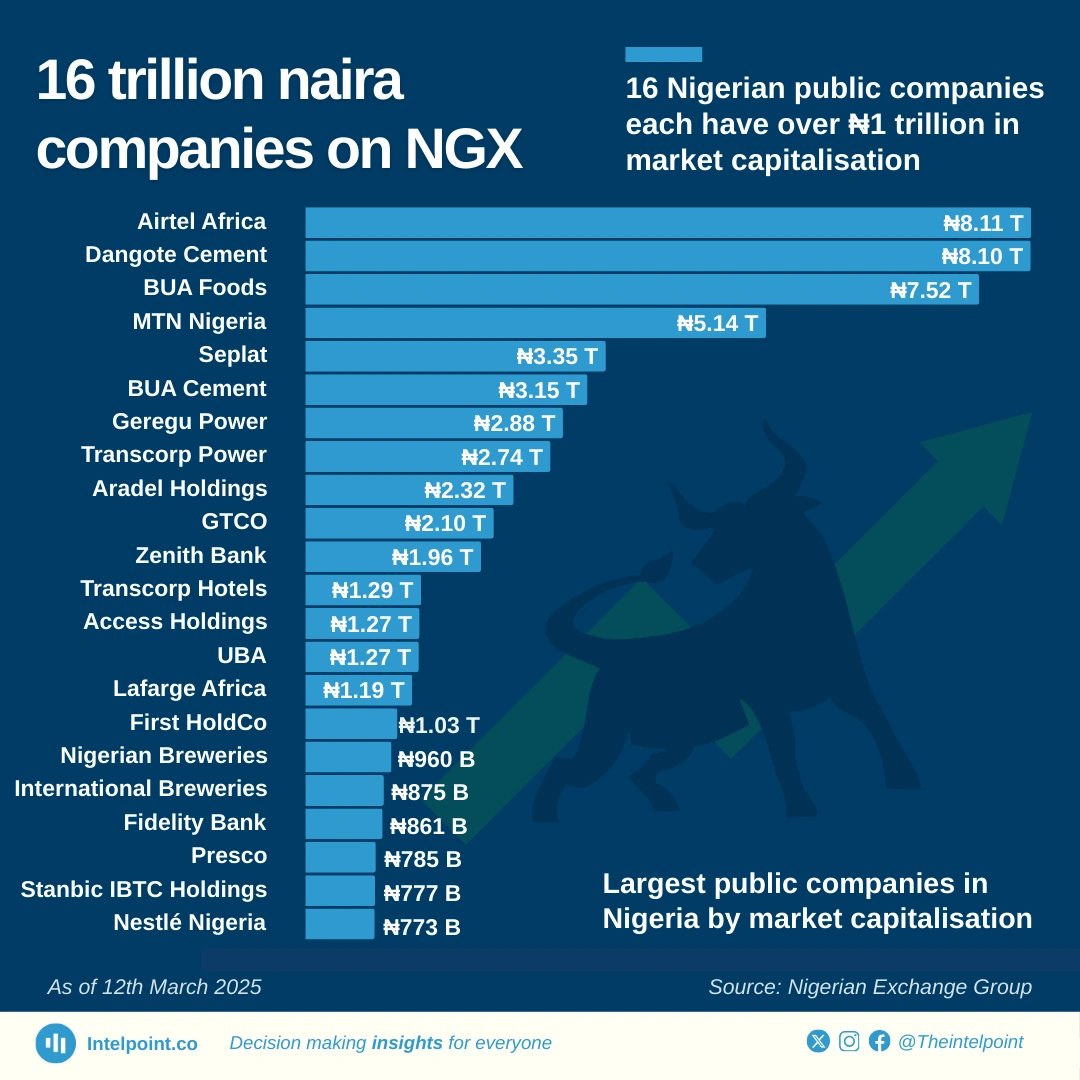
Airtel Africa holds the highest market capitalisation among Nigerian public companies, standing at ₦8.11 trillion, with Dangote Cement and BUA Foods following closely behind, reflecting strong dominance in the industrial and consumer goods sectors. MTN Nigeria leads ICT stocks after Airtel, as the only two companies in the sector to make the list. In total, 16 companies have crossed the ₦1 trillion mark, spanning industries like ICT, industrial goods, oil and gas, utilities, banking, and consumer goods, underscoring the influence of key sectors driving Nigeria’s economy.

Source:

Nigerian Exchange Group

Period:

March 12, 2025
HTML code to embed chart
Want a bespoke report?
Reach out
Tags
Related Insights

South Africa’s GDP per capita has grown in 21 of the past 24 years, climbing to a record high in 2024
  • South Africa’s GDP per capita rose from $440 in 2000 to an all-time high of $2,692 in 2024.
  • Growth was relatively steady in the 2000s, with notable jumps after 2006 and again in the post-pandemic years.
  • Despite dips in 2008 (global financial crisis) and 2020 (COVID-19 shock), the economy showed resilience with quick rebounds.
  • By 2024, South Africa achieved its strongest per capita GDP on record, cementing its role as one of Africa’s leading middle-income economies.
  • The country recorded growth in 21 of the past 24 years.

Algeria’s GDP per capita has risen four straight years since 2020, edging closer to its 2014 oil-driven peak
  • Algeria’s GDP per capita more than tripled in 25 years, rising from $1,772.9 in 2000 to $5,631.2 in 2024.
  • The 2000s boom saw rapid growth, peaking at $5,180.9 in 2008, fuelled by high oil and gas prices.
  • Between 2014 and 2016, GDP per capita fell from $6,094.7 to $4,425.0, reflecting oil price collapses and domestic fiscal strain.
  • After pandemic-era lows in 2020 ($3,743.5), Algeria rebounded to its second-highest level on record in 2024 ($5,631.2), regaining its regional standing.

Egypt’s GDP per capita has more than doubled since 2000, but has fallen sharply since its 2022 peak
  • Egypt’s GDP per capita grew from $1,366 in 2000 to $3,339 in 2024, a 144% increase over 25 years.
  • The economy peaked at $4,233 in 2022, marking the highest point in the series before a two-year decline.
  • Sustained growth was driven by the 2000s and 2010s, with resilience after the 2008 financial crisis and Arab Spring disruptions.
  • The dip after 2022 reflects external pressures, currency adjustments, and inflationary challenges, though per capita levels remain well above early 2000s baselines.

Burundi's GDP per capita
  • Burundi recorded its highest GDP per capita in 2015 ($280.97).

  • By 2024, GDP per capita dropped to $153.93, a decline of nearly 45% from its peak.

  • Burundi’s population exceeds 13 million (2024), which dilutes income per person even when overall GDP grows.

  • Structural challenges like limited industrialization, reliance on subsistence farming, and political instability contribute to stagnation.

  • Since 2015, Burundi has held the lowest GDP per capita in Africa—and at $153.9 in 2024, it is the poorest country in the world by GDP per capita.


Zimbabwe’s GDP per capita recorded a 472% increase over the 25-year period from 2000 to 2024
  • Zimbabwe’s GDP per capita nearly quintupled since 2000, marking a 472% increase over 25 years.
  • The country's GDP per capita declined consistently from 2001 to 2008.
  • It soared to $3,448.1 in 2017, which is still the highest in the country's history.
  • The GDP per capita plummeted to $2,271.9 in 2019, recording a (34.1%) decrease.

Seychelles' GDP per capita
  • Seychelles’ GDP per capita rose from $8.06k in 2000 to a peak of $19.14k in 2019, more than doubling in two decades.
  • After steady growth through the 2010s, the COVID-19 pandemic in 2020 cut GDP per capita to $14.04k, a 26% drop from 2019.
  • Recovery has been gradual, with GDP per capita rebounding to $18.26k in 2023, though still below the 2019 high.
  • By 2024, GDP per capita settled at $17.86k, showing resilience but reflecting ongoing global and domestic economic pressures.

POPULAR TOPICS
SIGN UP TO OUR NEWSLETTER
Get periodic updates about the African startup space, access to our reports, among others.
Subscribe Here
Subscription Form

A product of Techpoint Africa. All rights reserved