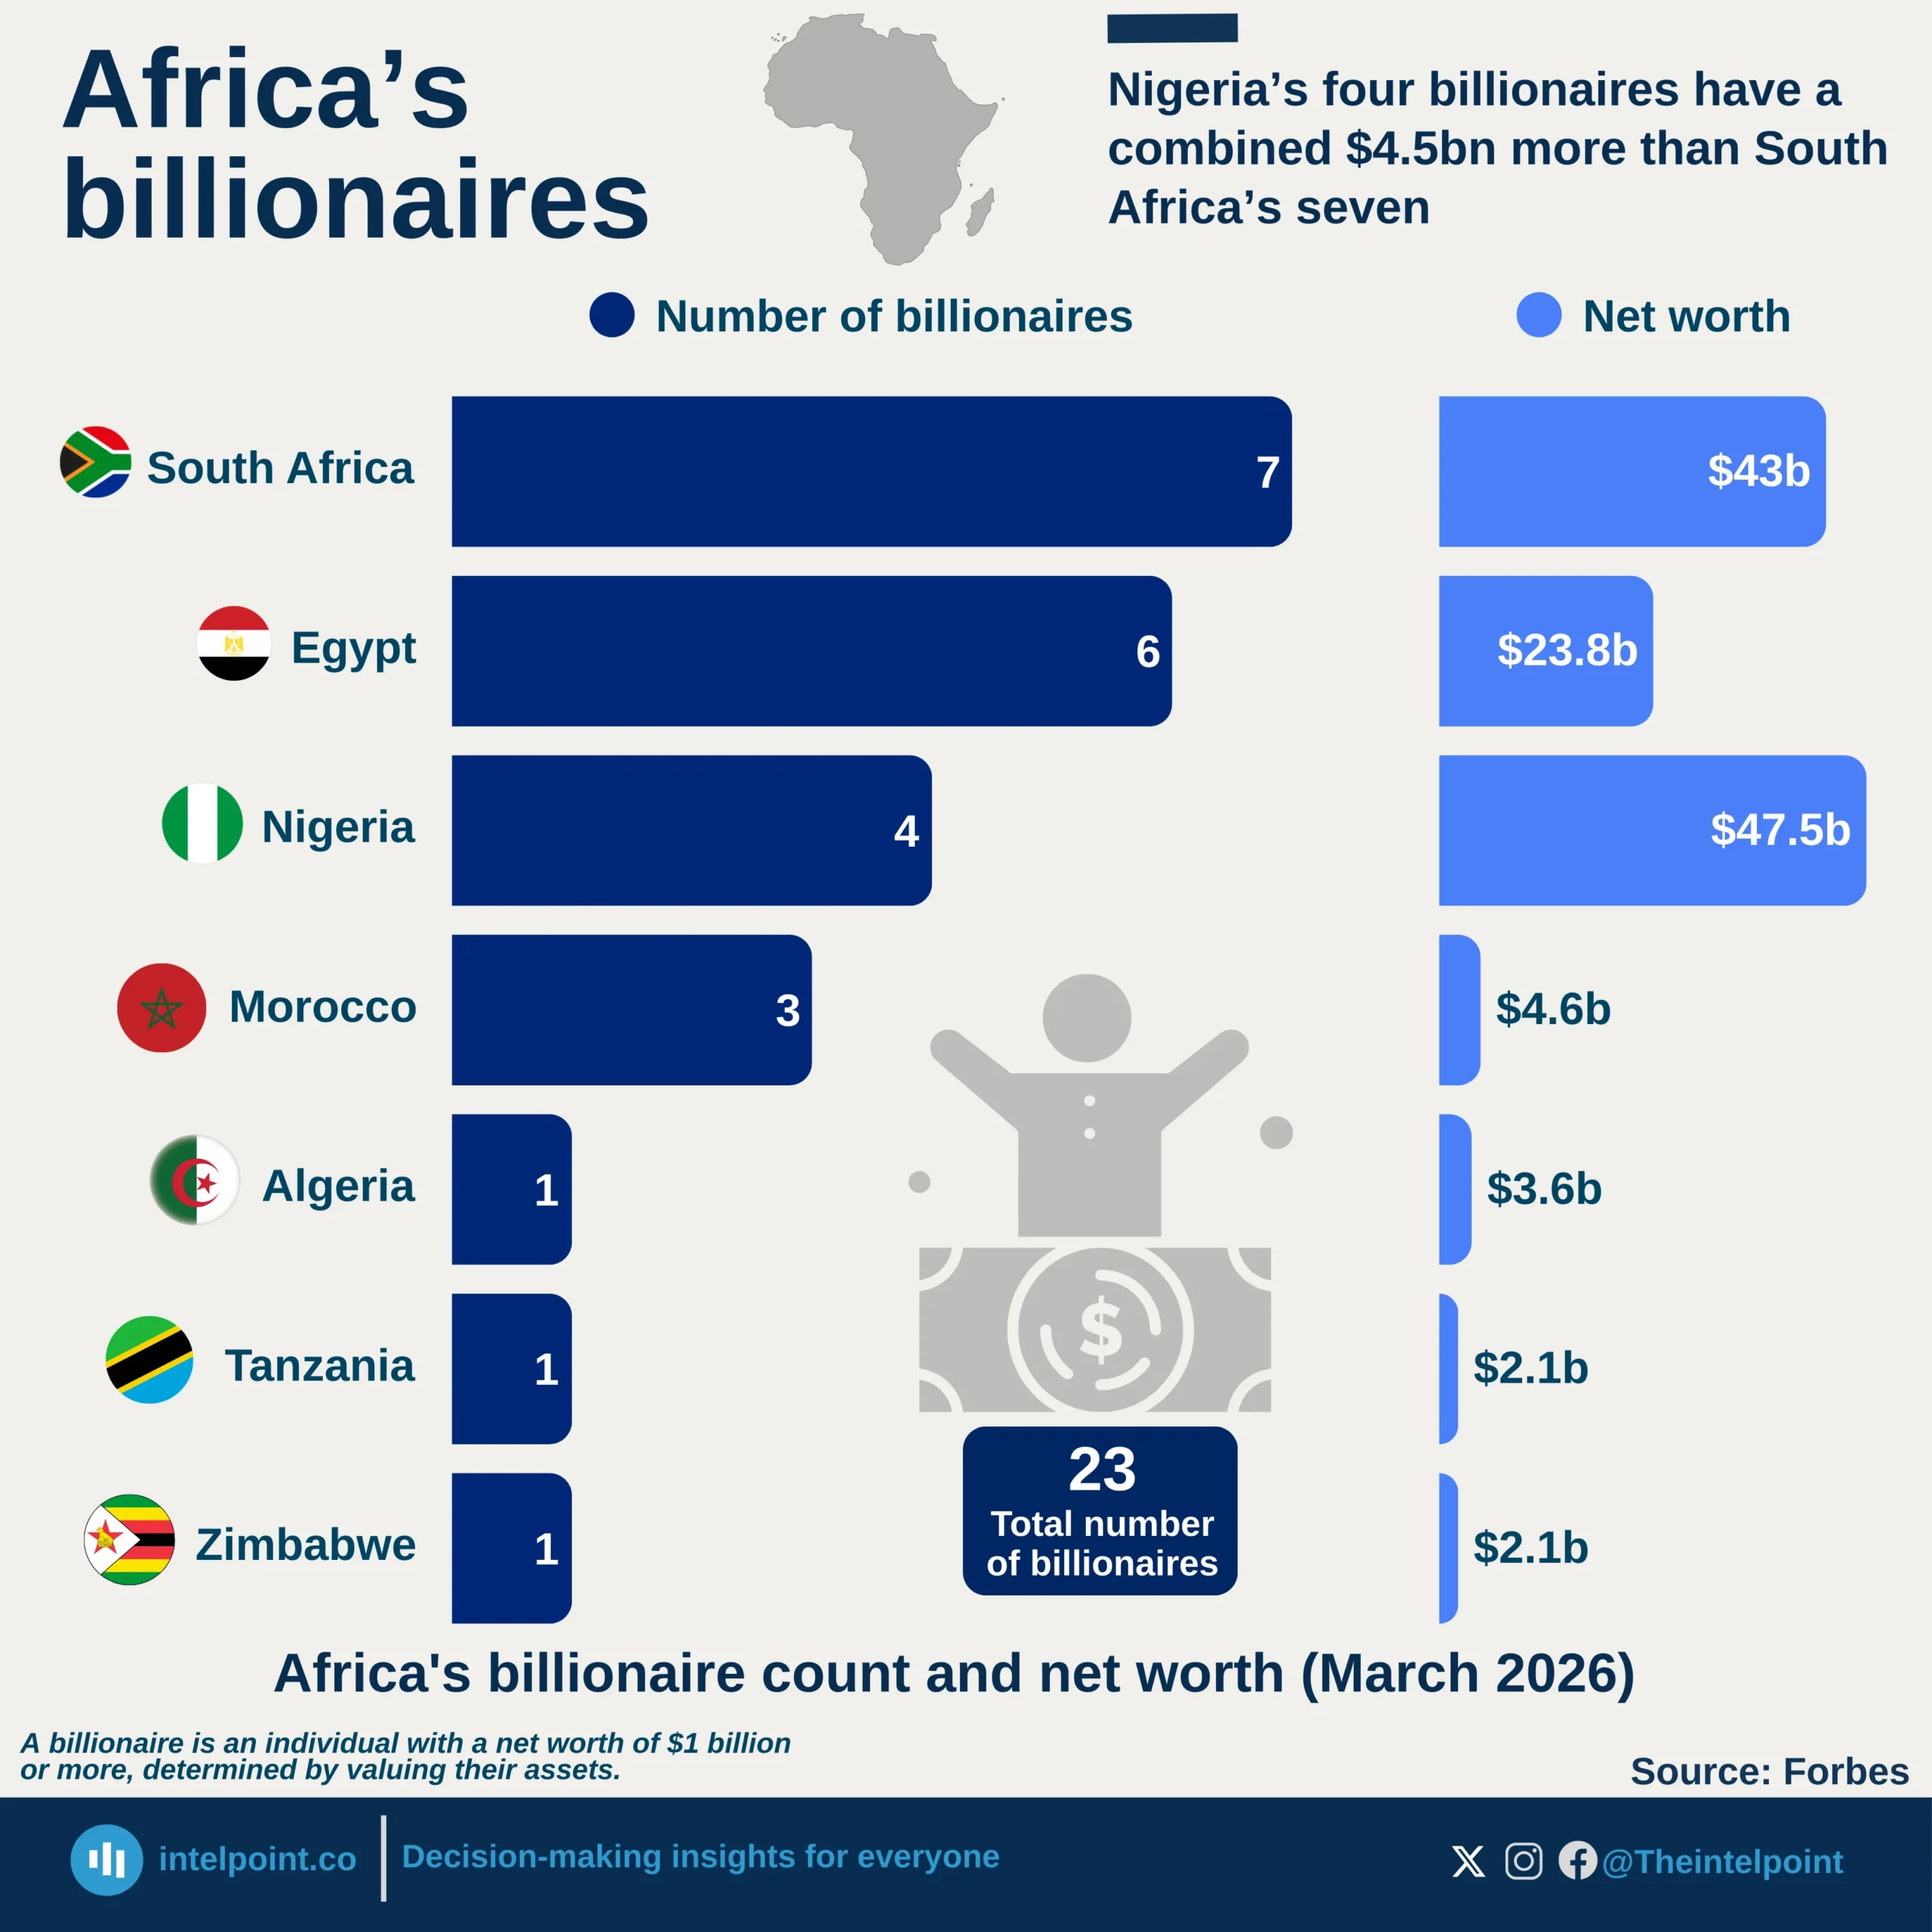
South Africa leads in headcount, with seven billionaires, more than other African countries.
Nigeria leads in wealth, with four billionaires worth $47.5 billion, $4.5 billion more than the combined $43 billion of South Africa's seven billionaires.
Nigeria's billionaires are richer individually, with an average net worth of $11.9 billion, compared with South Africa's $6.1 billion.
North Africa punches below its weight: Egypt, Morocco, and Algeria have ten billionaires combined but just $31.4 billion in total wealth.
East Africa barely registers: Tanzania and Zimbabwe each have just one billionaire, both worth $2.1 billion.
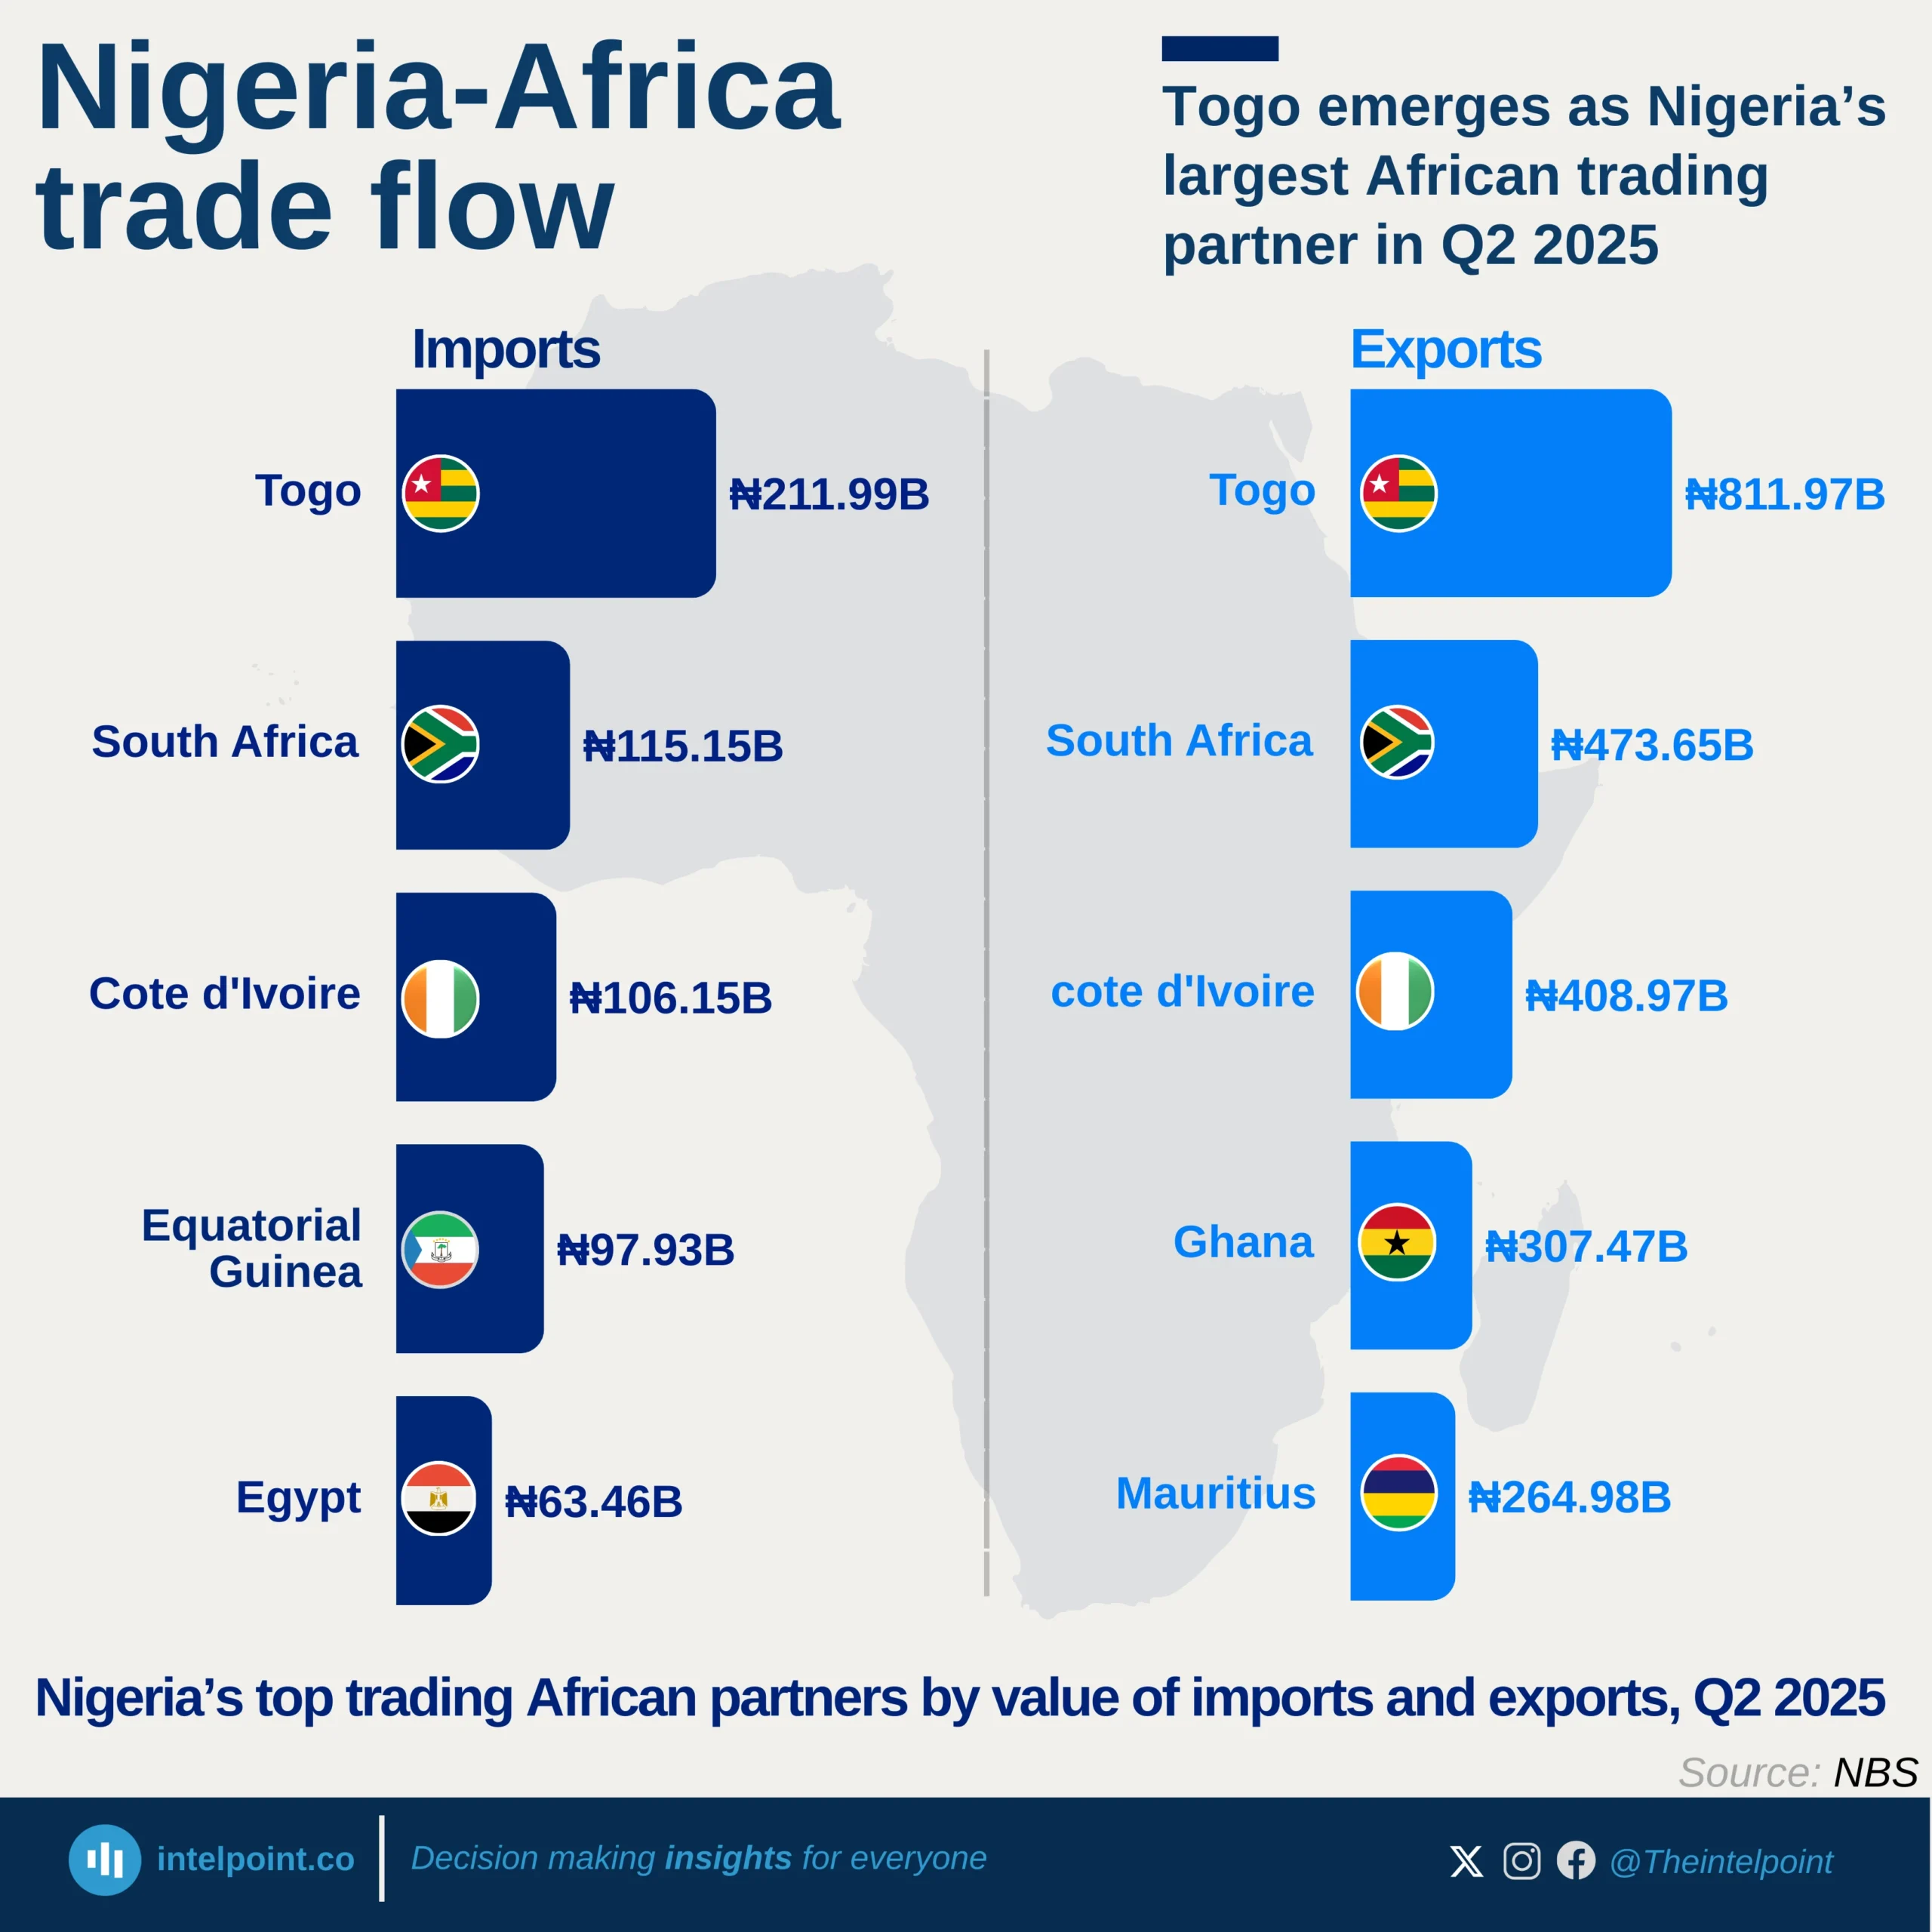
Togo leads on both sides of trade, supplying ₦211.99B in imports and receiving ₦811.97B in exports, making it Nigeria’s strongest African partner by value.
South Africa ranks second, with imports of ₦115.15B and exports of ₦473.65B, reflecting deep bilateral trade ties.
Côte d’Ivoire also features prominently, sending ₦106.15B worth of goods to Nigeria while importing ₦408.97B, showing balanced engagement.
West Africa dominates Nigeria’s intra-African trade, with Togo, Côte d’Ivoire, and Ghana collectively accounting for a significant share of regional exports.