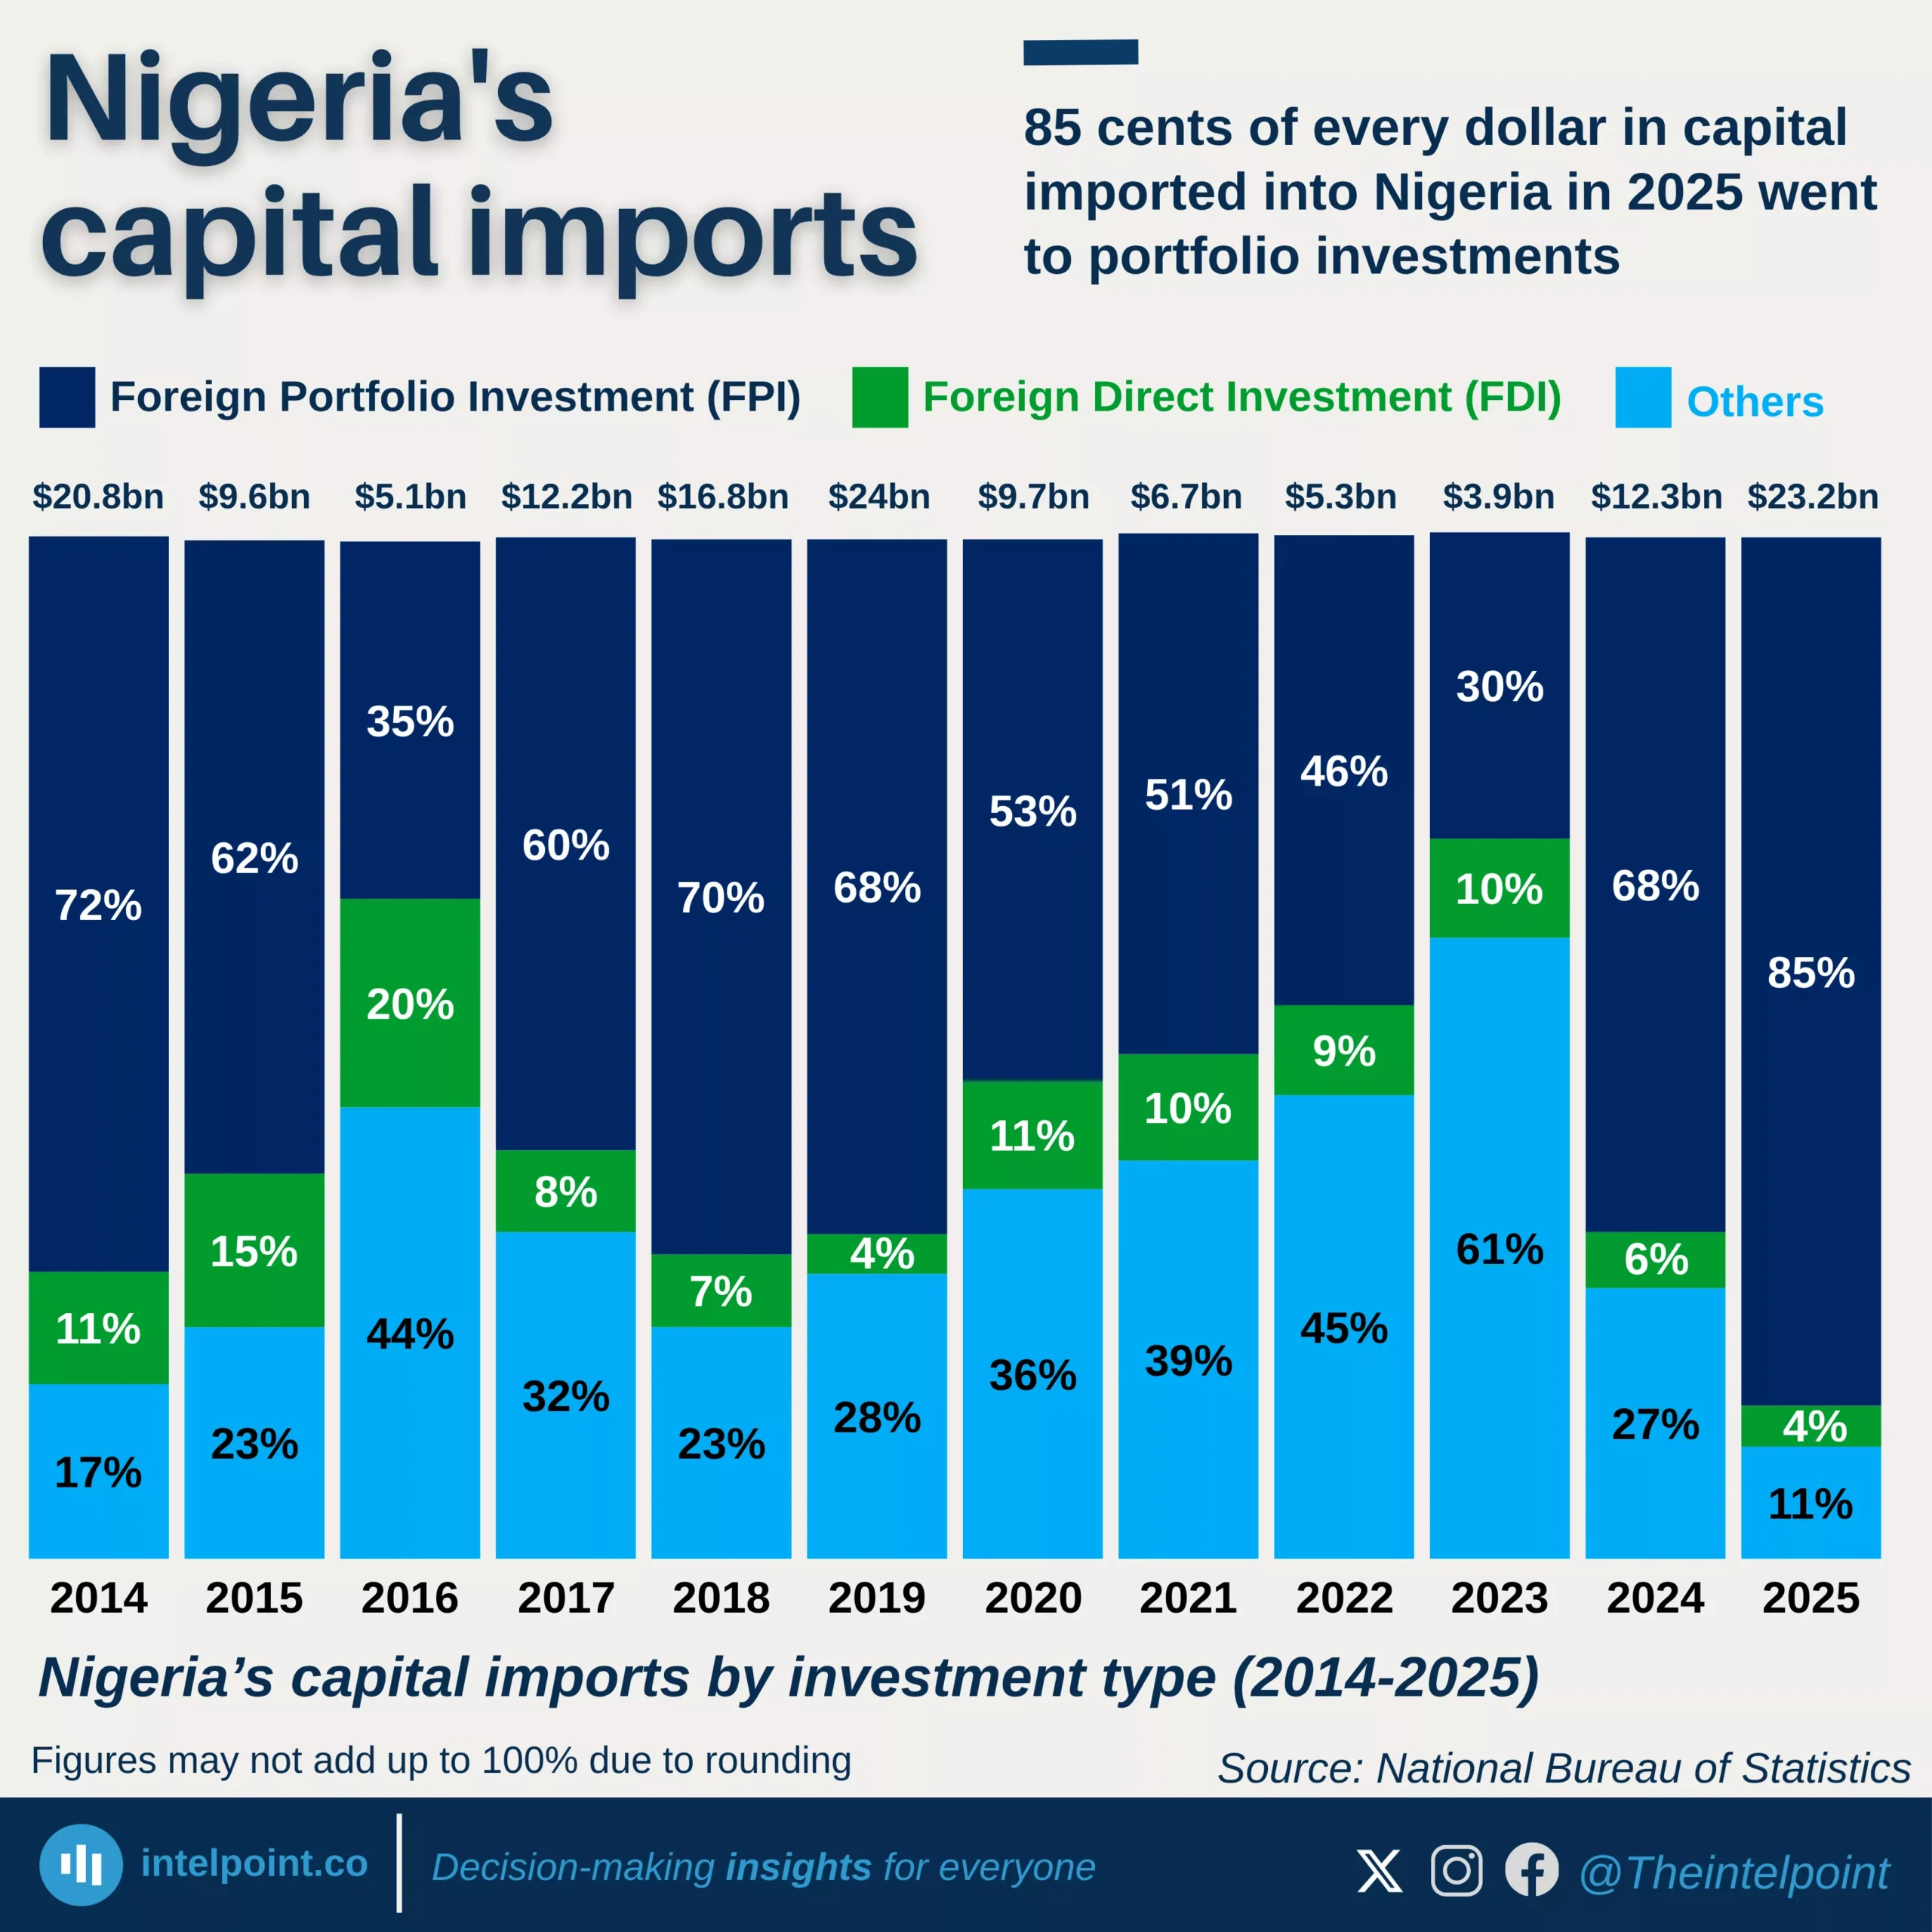
Bite-sized Insights about
 
Providing you with data-based insights about things happening around you.
Netherlands, US, and Germany dominated cocoa imports from 1961 to 2023
  • Netherlands imported the most cocoa beans — 25.48 million tonnes (1961–2023)
  • US (21.1M) and Germany (16.8M) followed in total volume
  • These three countries dominated the top 5 nearly every year
  • Malaysia, UK, France, and Belgium also ranked high over time
  • USSR stayed in the top 10 despite dissolving in 1991
  • Global cocoa imports grew from 1M tonnes in 1961 to nearly 4M in 2023

Between 1961 and 2022, African wine production decreased by 43%, with recent years’ production levels falling below the volume in the 1960s and 1970s
Key Takeaways:
  • African wine production peaked in 1965 at 2.39 million tonnes, the highest level recorded during the entire period.
  • The most dramatic single-year drop occurred between 1965 and 1966, when production fell by 40%, from 2.39 to 1.44 million tonnes.
  • A gradual recovery began in the early 2000s, with production consistently exceeding 1 million tonnes from 2003 onward.
  • The most recent peak occurred in 2021, with production reaching 1.23 million tonnes, a 48.5% decline from the 1965 high.
  • Despite this partial recovery, current production levels remain well below the highs of the 1960s.
  • As of 2022, African wine production stood at 1.16 million tonnes, representing a 43% decrease from 1961.

With a 51.24-point increase, Morocco showed the most significant AIDI growth among the top African economies
  • Morocco's AIDI score rose from 19.08 in 2003 to 70.32 in 2024, indicating substantial infrastructure progress over two decades.
  • Over the past 21 years, Egypt's infrastructure development, as measured by AIDI, has more than tripled.
  • Nigeria ranks 24th in infrastructure (AIDI) despite having the 4th largest GDP in Africa.
  • In 2024, Nigeria’s AIDI score was 25.70, significantly below peers like Morocco (91.43) and Egypt (82.54).
  • Algeria, with a GDP of $260.13B, achieved a strong AIDI score of 70.32, ranking 8th.
  • The AIDI gap highlights that economic size doesn’t guarantee infrastructure strength, underlining the need for intentional investment.

East Africa is heavily represented among the weakest African currencies in 2024, with Somalia leading at 28,118.33 SOS per US$
  • Eight East African nations made the list of the top 15 worst African currencies.
  • Somalia has the weakest African currency in 2024, with an exchange rate of 28,118.33 SOS per US$.
  • Guinea, with 8,613.26 GNF per US$, has the second weakest currency, but is still far behind Somalia.
  • Madagascar, Uganda, and Zimbabwe follow, each with exchange rates between 3,200 and 4,500 LCU per US$.
  • Nigeria’s currency traded at 1,478.97 Naira per US$, about 20 times stronger than Somalia's currency.
  • Despite economic turmoil, South Sudan’s currency remained below 2,200 SSP per US$, performing better than Somalia and Guinea.
  • The gap between Somalia and the rest of Africa’s currencies highlights extreme economic pressures unique to the Somali economy in 2024.

Egypt produced over 10.2 million tonnes of tomatoes at its 2009 peak, topping Africa for 63 straight years
  • Egypt led every single year from 1961 to the most recent year — 63 years of dominance.
  • Egypt peaked at over 10.2 million tonnes in 2009, no other African country came close.
  • As of 2023, Egypt ranked 5th globally, just ahead of Italy and behind the US.
  • Nigeria hit its highest level in 2015, with 4.2 million tonnes.
  • Nigeria was the only country that got within 1.5 million tonnes of Egypt in 13 different years.
  • Countries like Algeria, Morocco, and Tunisia remained consistent but far behind Egypt and Nigeria.
  • Egypt’s lead is backed by large-scale irrigation and strong export systems.
  • In 1987, Africa supplied 11.7% of the world’s tomatoes. But by 2023, its share dropped to 8.8%.

The top 15 countries accounted for 68.8% of global gold production in 2023, with four African nations among the leaders
Key takeaways:
  • China led global gold production with 378.16 tonnes, representing approximately 10.4% of global output.
  • The top five producers (China, Russia, Australia, Canada, and the United States) collectively produced 37% of the world’s gold.
  • African nations showed remarkable strength, with four countries in the top 15 (Ghana, Mali, South Africa, and Burkina Faso).
  • Ghana led Africa in gold production and ranked 6th globally, producing 135.11 tonnes in 2023.
  • China, Australia, and Russia together produced nearly 1,000 tonnes of gold, accounting for 27.3% of total world production.

Nigeria's naira depreciated by 129% in 2024, hitting an average of 1,479 NGN per US$
  • The Nigerian naira depreciated by a record-breaking 129.23% in 2024, the highest drop in the last decade.
  • From 2015 to 2022, the naira's depreciation was relatively controlled, rarely exceeding 20% year-on-year.
  • The exchange rate remained nearly flat from 2017 to 2019, showing signs of stability.
  • In 2023, the naira lost over half its value (51.46%), marking the beginning of the current volatility wave.
  • The exchange rate crossed the ₦1,000/$ threshold in 2024 for the first time in history.

Somalia's official exchange rate (SOS per US$) has generally trended upwards from 2015 to 2024, reaching 28,118.33 SOS per US$
  • Somalia’s currency has depreciated by 26.4% between 2015 and 2024.
  • The sharpest yearly depreciation was in 2019, at 4.64%.
  • From 2020 to 2021, the SOS saw its smallest year-on-year shift at 1.08%.
  • Despite fluctuations, every year from 2015 to 2024 recorded a net increase in SOS per US$.
  • 2017 recorded near-stable currency performance with just a 0.16% change from the previous year.

The average gold production in Africa between 2010 and 2023 was 840.59 tonnes, reaching a record high of over 1,000 tonnes in 2023
Key Takeaways:
  • Africa's gold production grew steadily from 621.78 tonnes in 2010 to 1,003.98 tonnes in 2023.
  • The continent experienced an overall increase of 61.5% in gold output over the 14 years.
  • The continent saw consistent year-on-year growth, with only minor declines in 2020 and 2022.
  • 2023 marked the highest production level in more than a decade.
  • The average annual growth rate in gold mine production over the period was approximately 4%.

Global gold mine production increased steadily from 2010 to 2023, marking a 29% overall rise despite temporary setbacks in 2019 and 2020
Key Takeaways:
  • Global gold production rose from 2,830.80 tonnes in 2010 to 3,646.07 tonnes in 2023.
  • The most significant year-over-year growth occurred between 2012 and 2013, with an increase of over 178 tonnes.
  • A temporary decline in production was recorded in 2019 and 2020, reflecting pandemic-related disruptions.
  • Production recovered quickly post-pandemic, reaching a record 3,646.07 tonnes by 2023.
  • Over the last fourteen years, gold mine output grew at an average annual rate of approximately 2%.
  • Growth from 2021 to 2023 was more moderate compared to earlier years.

1 2 3 26

Can’t find what you’re looking for? Please fill the form below
Contact Form Demo
SIGN UP TO OUR NEWSLETTER
Get periodic updates about the African startup space, access to our reports, among others.
Subscribe Here
Subscription Form

A product of Techpoint Africa. All rights reserved