On average, Nigeria’s NBS publishes Q1 GDP reports 53 days after the quarter ends. But in 2025, it's been 86 days—and still no release

  • Nigeria’s National Bureau of Statistics (NBS) usually releases Q1 GDP data 53 days after the quarter ends.
  • As of June 25, 2025, the Q1 2025 figures are 86 days overdue—that’s 33 days longer than average.
  • The delay coincides with a GDP rebasing exercise, updating the base year to 2019.
  • Q1 GDP reports have typically come out in May for the past eight years—until now.

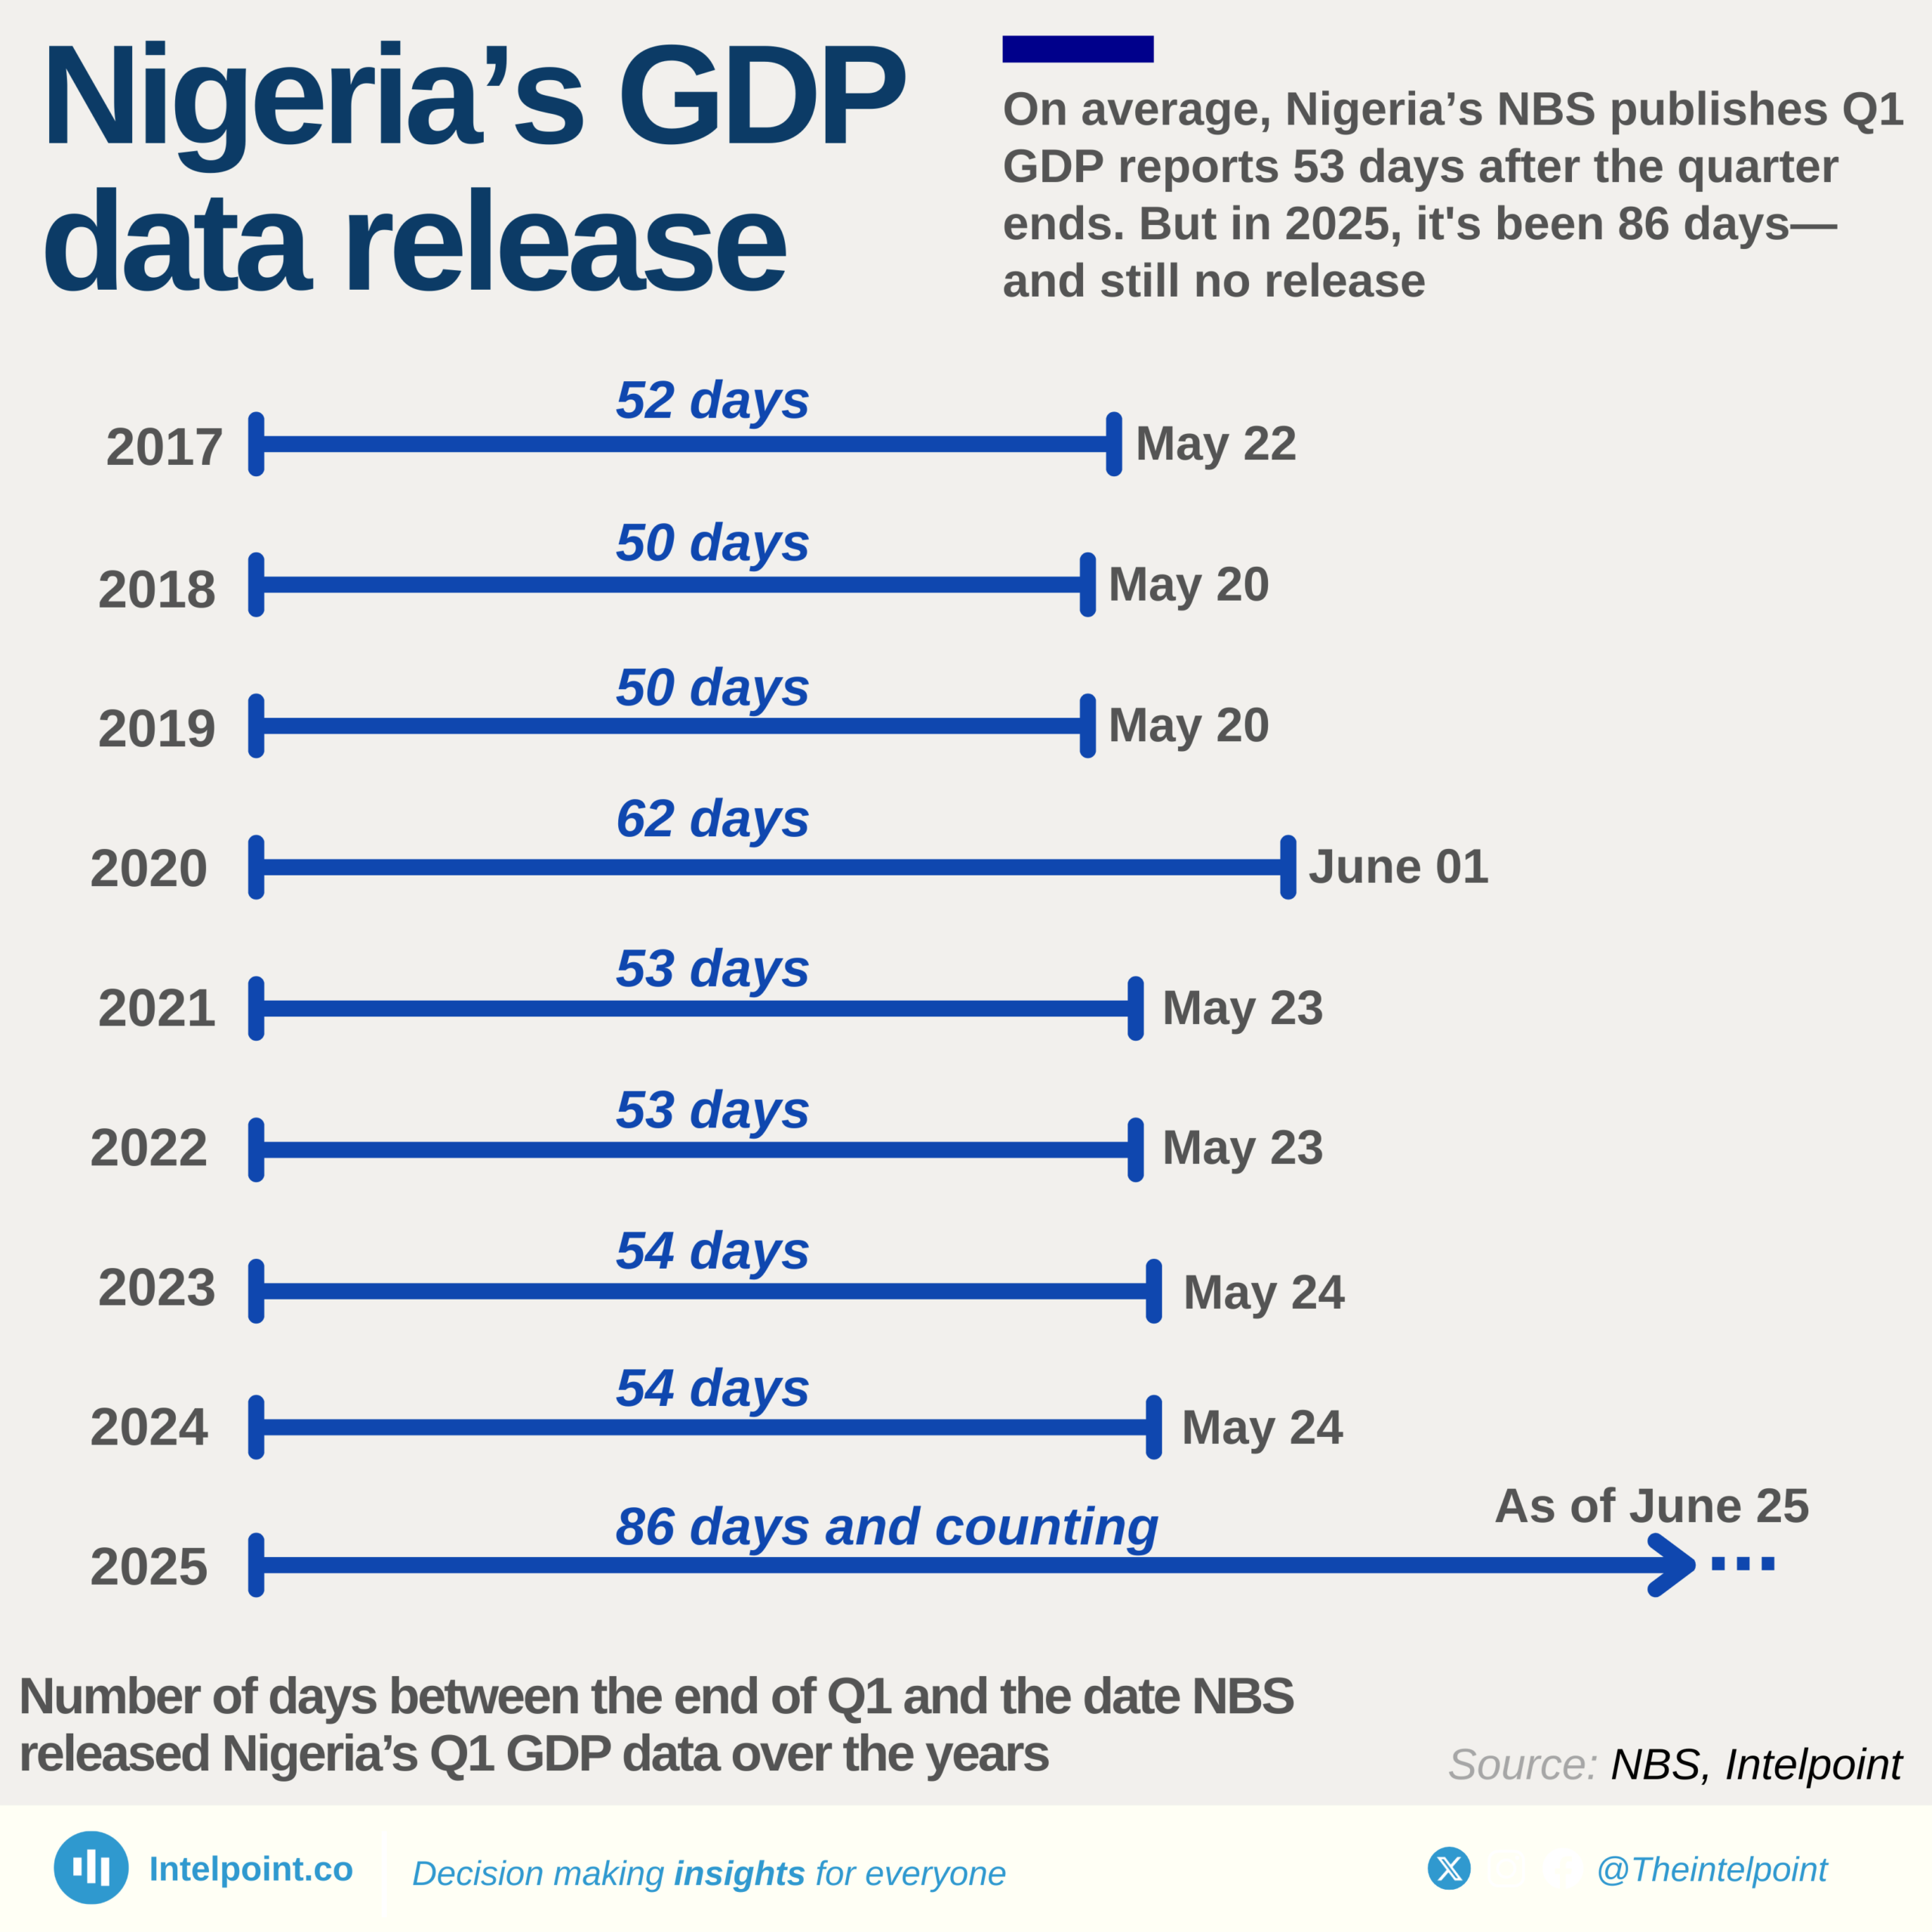
We tracked how long it typically takes Nigeria’s National Bureau of Statistics (NBS) to release Q1 GDP data. Between 2017 and 2024, the Q1 report was released, on average, 53 days after the end of March, typically around late May.

But 2025 has broken that pattern. As of June 25, the Q1 2025 GDP data is still missing, now 86 days and counting since the quarter ended—33 days later than the usual timeline.

Why the hold-up? Earlier in 2025, the NBS carried out a long-awaited GDP rebasing, adopting 2019 as the new base year. This update is meant to better reflect Nigeria’s evolving economy by capturing newer sectors and providing a more accurate picture of output. That complexity may explain the delay, but it also raises questions about transparency and consistency in national data releases.

Source:

NBS, Intelpoint

Period:

2017-2025
HTML code to embed chart
Want a bespoke report?
Reach out
Tags
Related Insights

Three African countries are projected to have debt exceeding their GDP in 2026
  • Sudan is projected to have Africa’s highest debt-to-GDP ratio in 2026, at 169.1%.
  • Only three African countries are projected to owe more than the size of their economies in 2026.
  • Senegal and Mozambique join Sudan among countries with debt-to-GDP ratios above 100%.
  • Africa’s average government debt-to-GDP ratio is projected at 60.7% in 2026.
  • Nigeria’s projected debt-to-GDP ratio of 32.3% is far below the African average.

Mauritius has the strongest productive capacity in Africa — ahead of Seychelles and South Africa
  • Mauritius leads Africa on the Productive Capacities Index with a score of 55.02, ranking 56th globally.
  • Seychelles, South Africa, and Cape Verde complete Africa’s top four, but none enters the global top 50.
  • Nigeria ranks much lower at 167th globally, with a score of 30.68, despite being one of Africa’s largest economies.
  • The ranking shows that economic size does not always translate into stronger productive foundations like human capital, ICT, energy, transport, and institutions.

Obasanjo led Nigeria's biggest GDP per capita rise at 268% in 8 years
  • Nigeria’s GDP per capita rose strongly from 1999 to 2014, then reversed.
  • The 2014 peak remains the defining turning point.
  • Obasanjo’s years show the fastest sustained climb from a very low base.
  • Yar’Adua’s short tenure still maintained upward momentum.
  • Jonathan’s period delivered the peak level, not the fastest growth rate.
  • Buhari’s tenure marks the longest clear decline in GDP per capita.
  • Tinubu’s period begins with another sharp fall.

Nigeria is Africa’s fastest country to attain $100bn GDP, reaching the mark in a record 34 years
  • Nigeria is the fastest to reach $100B — 34 years, achieving the milestone in 1994.
  • Ethiopia took the longest — 81 years, reaching the mark in 2022 after decades of gradual expansion.
  • Resource-driven economies reached the threshold faster, including Angola (36 years) and Algeria (43 years).
  • North African economies crossed earlier, with Egypt (1989) and Morocco (2008) benefiting from diversified economic bases.
  • South Africa reached $100B as early as 1988, reflecting its long-standing industrial and financial depth.
  • Ghana is among the slowest climbers (68 years), but its recent 2025 milestone shows the impact of sustained reforms and growth.
  • Speed varies widely (34 to 81 years), showing that growth paths across Africa are shaped by very different economic realities.

Egypt and Nigeria led Africa’s industrial output in 2024, with $145.5bn and $89bn, respectively
  • Egypt led with an estimated $145.5 billion, accounting for about 25% of Africa's total industrial output among its top 15 economies.
  • Nigeria followed with $89 billion, while South Africa, Algeria, and Morocco made up the rest of the top five.
  • The top five economies accounted for more than 70% of Africa’s total industrial value added.
  • Notable mid-tier performers, Ethiopia and DR Congo, reflected rapid industrial investment.
  • Using constant 2015 USD reveals real production strength, not nominal currency shifts.

West Africa has the highest concentration of remittance-dependent nations, with 10 countries in the top 20, led by The Gambia (21.1%)
  • The Gambia leads Africa in remittance-GDP ratio, with remittance accounting for 21.1% of its GDP in 2024.
  • Lesotho (20.9%) and Comoros (18.3%) closely follow as highly remittance-dependent economies.
  • Somalia (17.5%) and Liberia (14.3%) also rely heavily on diaspora inflows to support their economies.
  • Nigeria (11.3%) remains a major player, highlighting its strong global diaspora network.
  • Cabo Verde (12.1%) and Senegal (11.6%) demonstrate that remittances are key drivers of income in smaller economies.
  • In larger economies like Egypt (7.6%) and Morocco (8.1%), remittances also make up a significant share of GDP.

POPULAR TOPICS
SIGN UP TO OUR NEWSLETTER
Get periodic updates about the African startup space, access to our reports, among others.
Subscribe Here
Subscription Form

A product of Techpoint Africa. All rights reserved