Bite-sized Insights about
 
Providing you with data-based insights about things happening around you.
Nigeria's non-oil tax revenue solidified its dominance over oil in FIRS collections, reaching a record of ₦15.9t in 2024, more than 2.7x the ₦5.8t from oil
  • FIRS recorded ₦15.9 trillion of non-oil tax, almost three times the ₦5.8 trillion recorded for oil tax.
  • Non-oil tax revenue made up 73.3% of the total revenue collected in 2023.
  • From 2012 down to 2024, non-oil tax revenue surpassed oil tax revenue most of the time.
  • Oil taxes are petroleum profit tax and company income (oil & gas) tax while non-profit tax includes company income (non-oil) tax, gas tax, capital gains, stamp duty, NCS import VAT, and non-import VAT.

Nigeria's FIRS surpassed 2024 target as revenue soared 76% to a record ₦21.7 trillion
  • The FIRS collected ₦21.7 trillion, outpacing the target of ₦19.4 trillion set by the government.
  • FIRS grossed its highest revenue of all time since 2012 in 2024.
  • Comparing the values of 2021, 2022, 2023 and 2024 reveals a significant shift.
  • The tax revenue collected in 2024 surpassed the amount collected in 2023 by an outstanding 75.6%.

Non-oil company income tax and two other sources accounted for over 70% of Nigeria's tax revenue in 2024
  • Company Income Tax (Non-Oil) emerged as the largest contributor, accounting for over 30% of total tax revenue.
  • NCS-Import VAT followed closely, contributing 23.63%, emphasising the significance of import-related taxes to Nigeria's revenue.
  • Traditional oil-based taxes such as Petroleum Profit Tax/Hydrocarbon Tax and CIT (Oil & Gas) jointly contributed over 26%, showing that oil remains a vital but declining pillar.
  • Newer tax streams like the Electronic Money Transfer Levy and NASENI (National Agency for Science and Engineering Infrastructure) funding have emerged, but still make up less than 2% of total revenue.
  • Minor tax categories like Capital Gains Tax, NITDEF (National Information Technology Development Fund), and NPTFL (Nigeria Police Trust Fund) had negligible impact, each contributing less than 0.5%

Total FAAC revenue shared in Nigeria consistently grew year-on-year from February to June 2025, with increases ranging from 39% to 49%
  • Nigeria’s FAAC revenue increased 49% YoY in March 2025 (₦1.68T vs ₦1.12T in March 2024).
  • February 2025 saw a 48% increase YoY (₦1.70T vs ₦1.15T in February 2024).
  • April 2025 revenue rose by 41% YoY, moving from ₦1.12T in April 2024 to ₦1.58T.
  • January 2025 showed no YoY change, recording ₦1.42T in both 2024 and 2025.
  • The consistent growth in H1 2025 FAAC revenues signals improved government revenue mobilisation, better oil/non-oil collections, and higher capacity for states to meet obligations.

East Africa is heavily represented among the weakest African currencies in 2024, with Somalia leading at 28,118.33 SOS per US$
  • Eight East African nations made the list of the top 15 worst African currencies.
  • Somalia has the weakest African currency in 2024, with an exchange rate of 28,118.33 SOS per US$.
  • Guinea, with 8,613.26 GNF per US$, has the second weakest currency, but is still far behind Somalia.
  • Madagascar, Uganda, and Zimbabwe follow, each with exchange rates between 3,200 and 4,500 LCU per US$.
  • Nigeria’s currency traded at 1,478.97 Naira per US$, about 20 times stronger than Somalia's currency.
  • Despite economic turmoil, South Sudan’s currency remained below 2,200 SSP per US$, performing better than Somalia and Guinea.
  • The gap between Somalia and the rest of Africa’s currencies highlights extreme economic pressures unique to the Somali economy in 2024.

Nigeria's naira depreciated by 129% in 2024, hitting an average of 1,479 NGN per US$
  • The Nigerian naira depreciated by a record-breaking 129.23% in 2024, the highest drop in the last decade.
  • From 2015 to 2022, the naira's depreciation was relatively controlled, rarely exceeding 20% year-on-year.
  • The exchange rate remained nearly flat from 2017 to 2019, showing signs of stability.
  • In 2023, the naira lost over half its value (51.46%), marking the beginning of the current volatility wave.
  • The exchange rate crossed the ₦1,000/$ threshold in 2024 for the first time in history.

Somalia's official exchange rate (SOS per US$) has generally trended upwards from 2015 to 2024, reaching 28,118.33 SOS per US$
  • Somalia’s currency has depreciated by 26.4% between 2015 and 2024.
  • The sharpest yearly depreciation was in 2019, at 4.64%.
  • From 2020 to 2021, the SOS saw its smallest year-on-year shift at 1.08%.
  • Despite fluctuations, every year from 2015 to 2024 recorded a net increase in SOS per US$.
  • 2017 recorded near-stable currency performance with just a 0.16% change from the previous year.

North Africa dominates the strongest African currencies in 2024, with Tunisia taking the lead at TND 3.11/USD
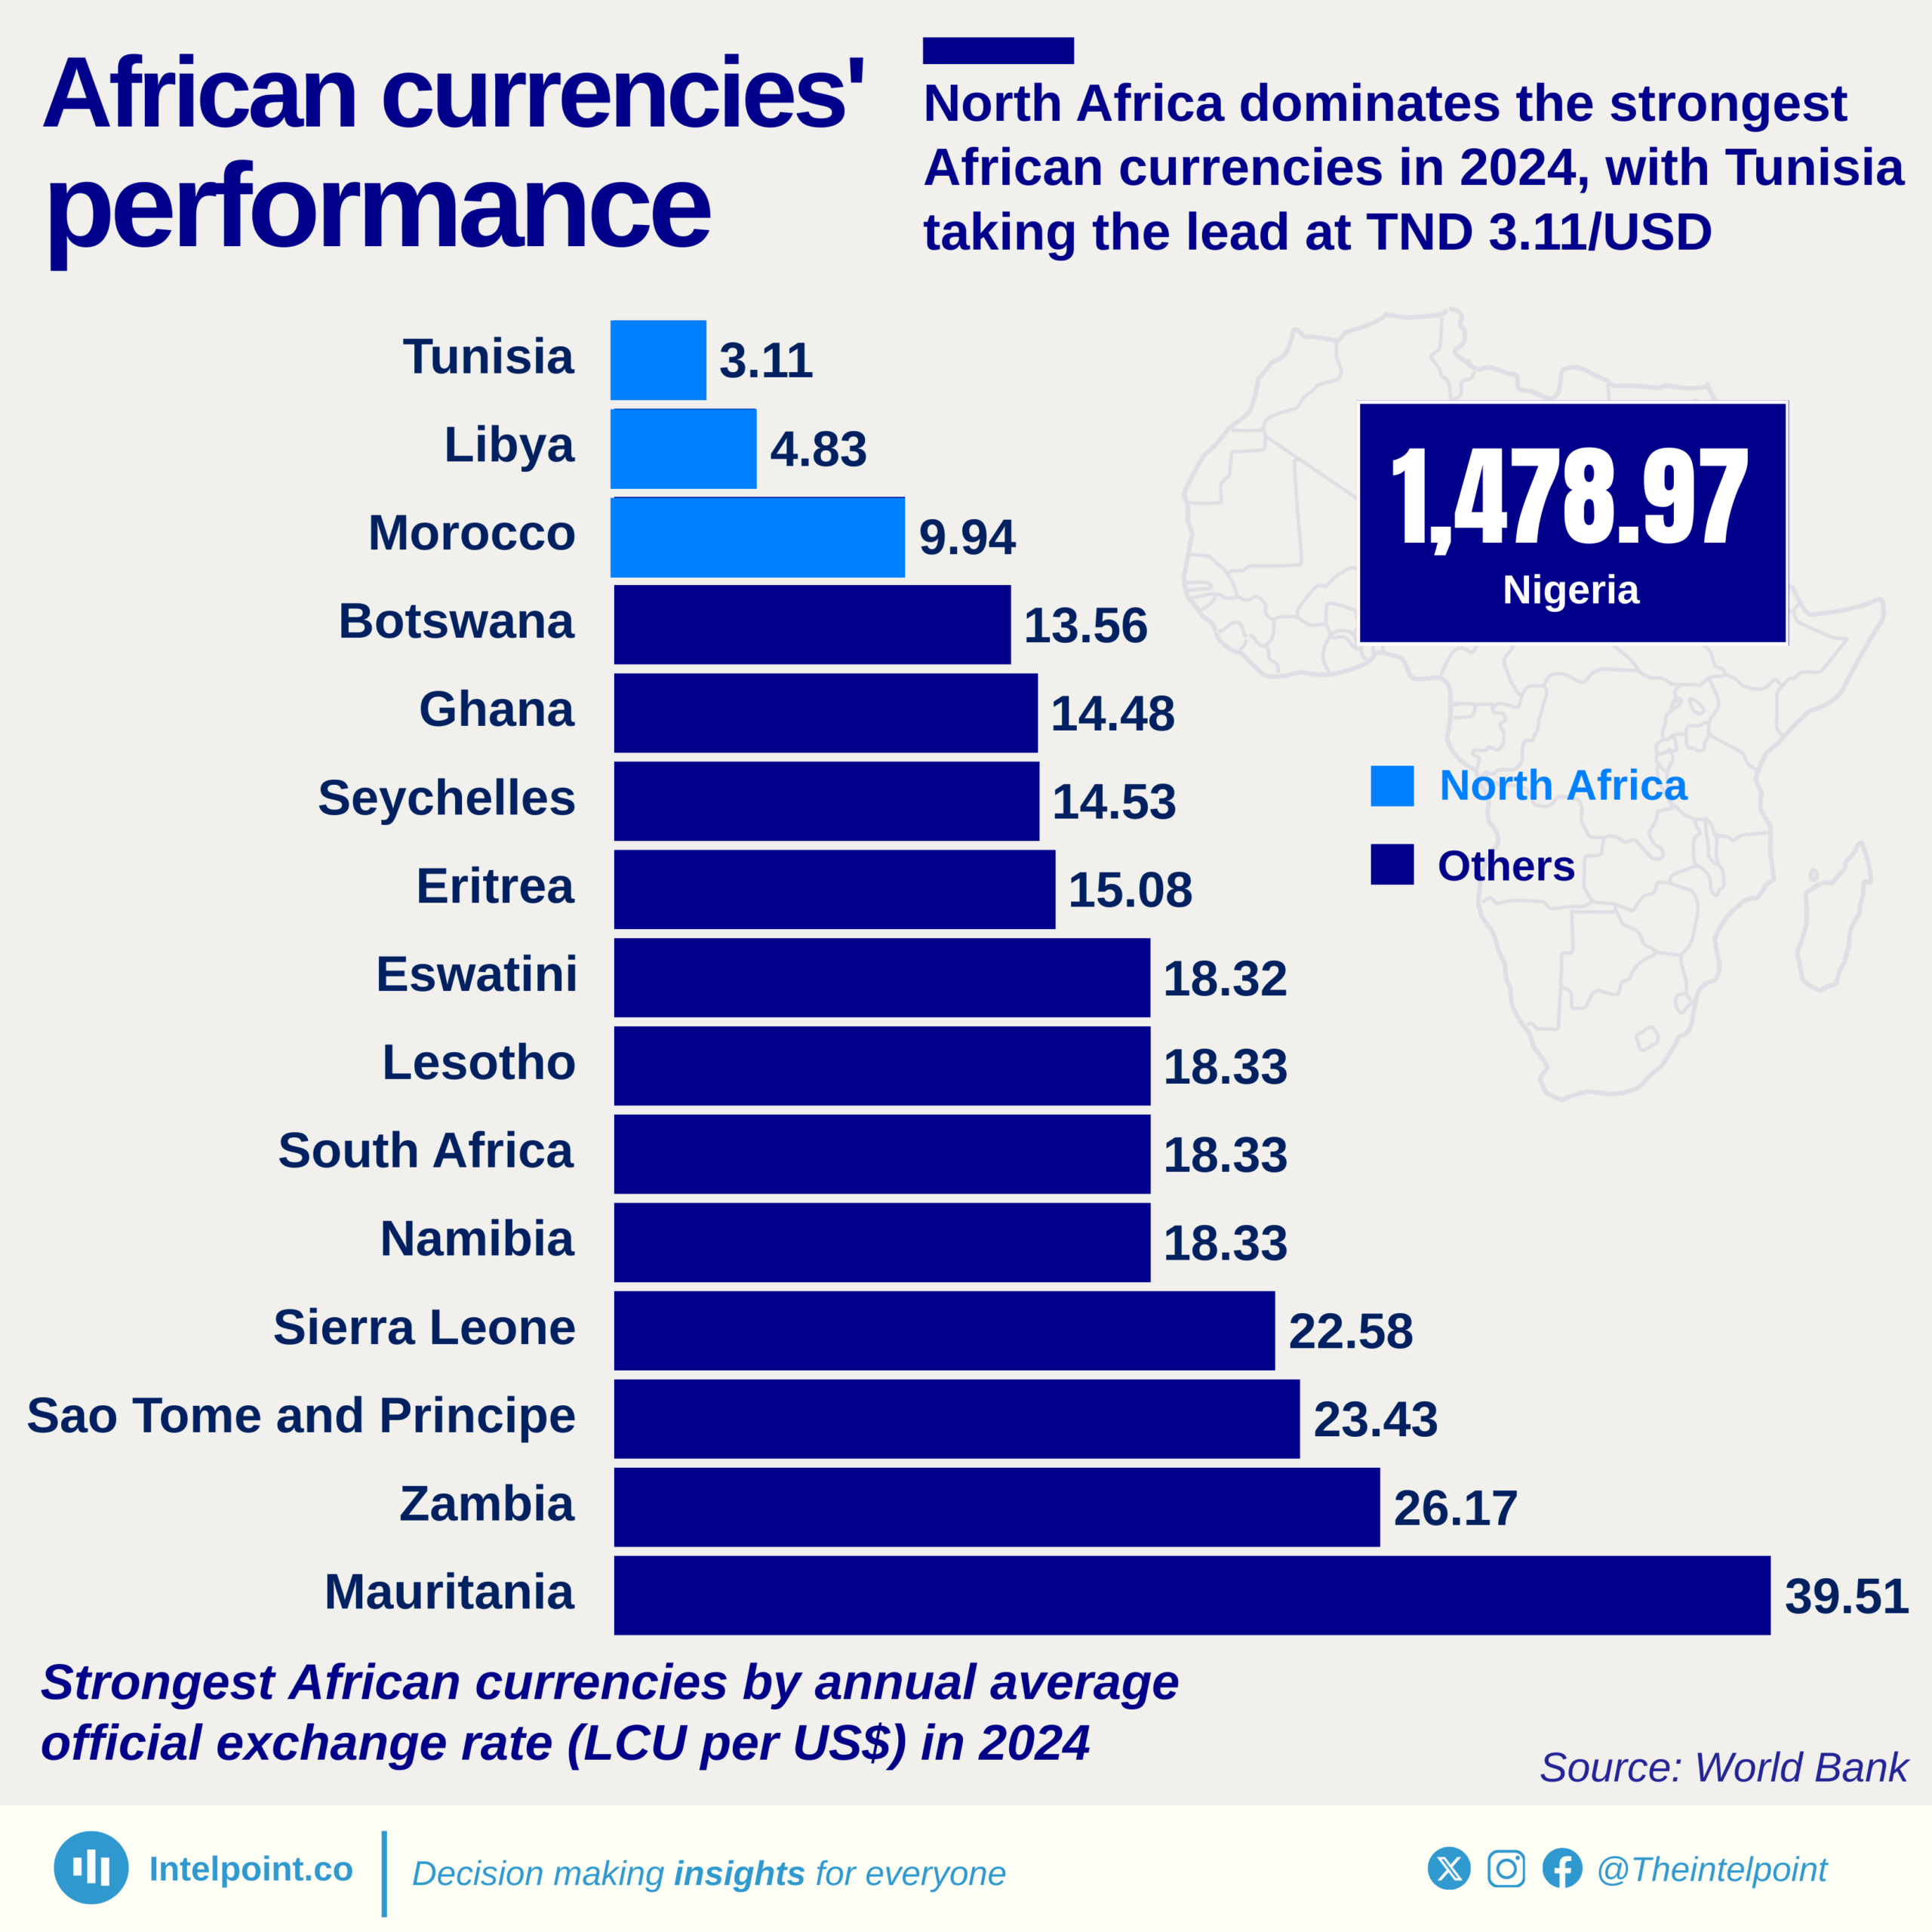
  • Tunisia held the top spot with the strongest African currency, trading at 3.11 TND per USD in 2024.
  • Libya followed as the second-strongest, with an exchange rate of 4.83 LYD per USD.
  • Morocco maintained a strong regional position, with its dirham trading at 9.94 MAD per USD.
  • Botswana’s pula was relatively stable, exchanging at 13.56 per USD, highlighting Southern Africa’s economic steadiness.
  • Ghana and Seychelles had closely matched exchange rates, trading at 14.48 and 14.53 to the dollar, respectively.
  • South Africa, Lesotho, Namibia, and Eswatini all shared almost identical exchange rates of around 18.32–18.33 per USD, showing tight regional monetary coordination.

After a period of fluctuation, Tunisia's currency has demonstrated a stabilised exchange rate since 2022 at around 3.11 TND per US$
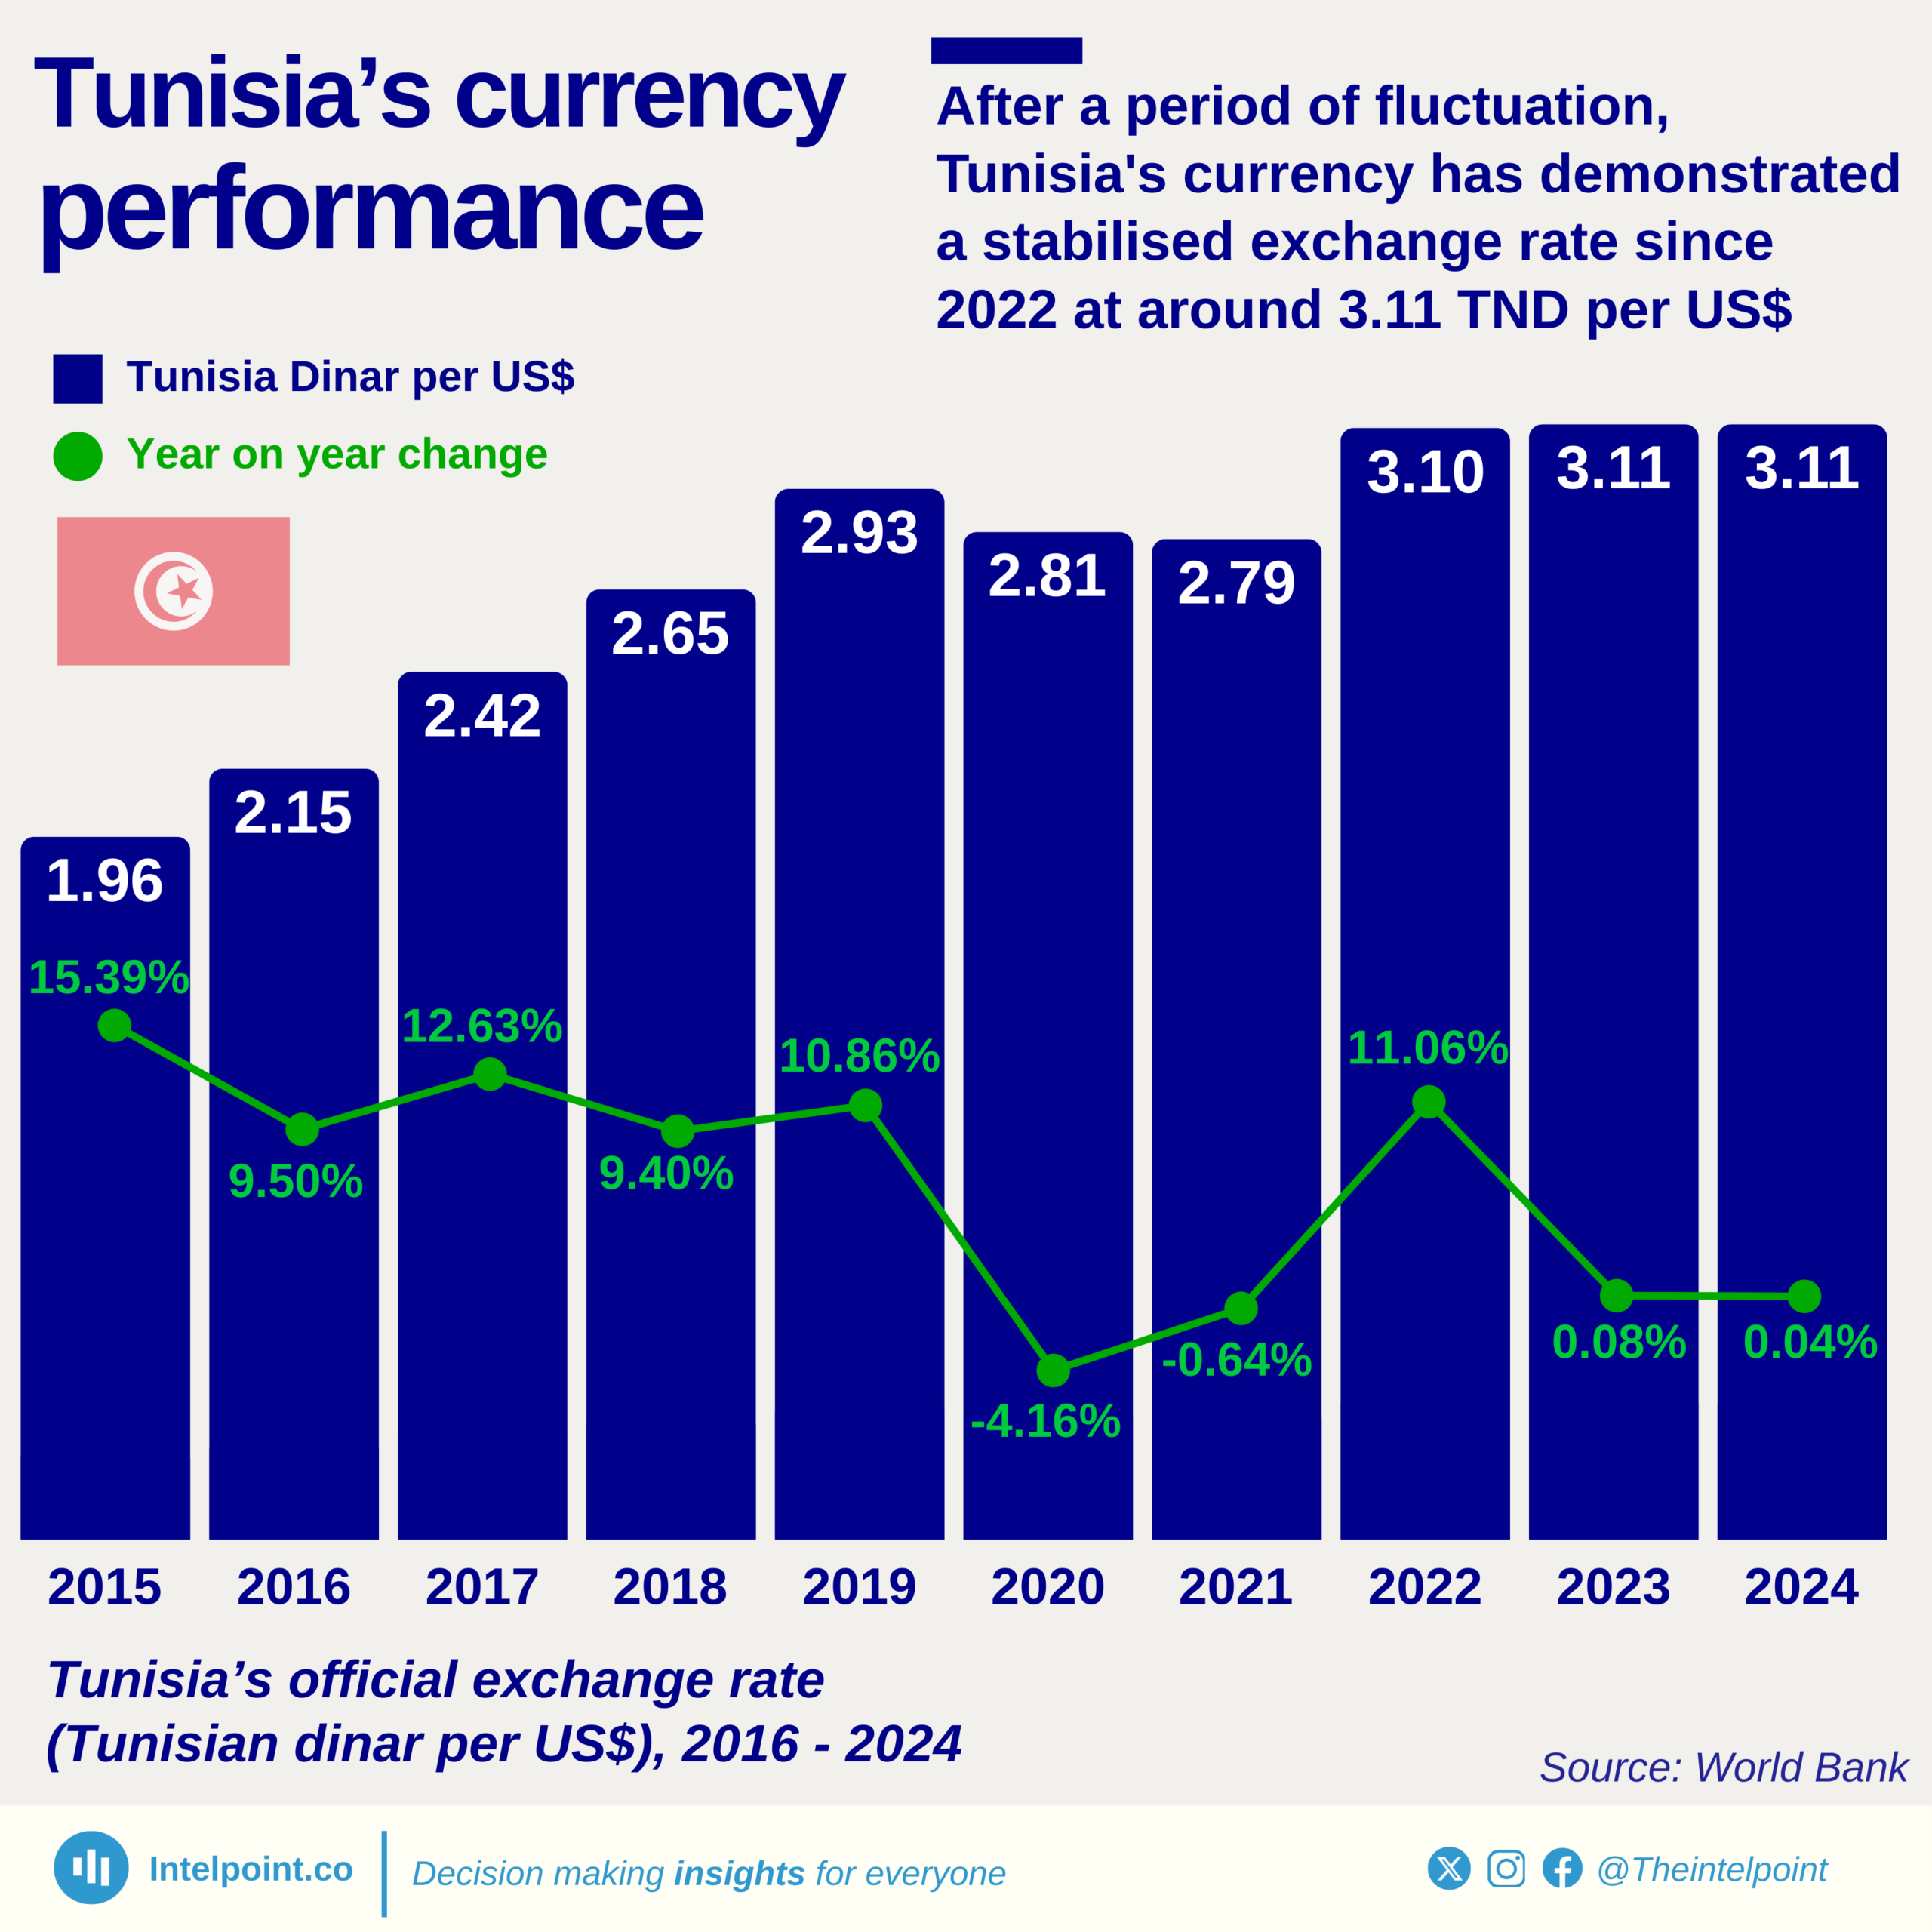
  • The Tunisian dinar stood at TND 2.15 per US$ in 2016 and has since depreciated to TND 3.11 per US$ in 2024.
  • Between 2016 and 2019, the dinar saw a strong depreciation.
  • 2020 marked a turning point with a 4.16% appreciation, the first notable currency strengthening in the period observed.
  • From 2022 onward, the exchange rate has stabilised closely around TND 3.10 to TND 3.11 per US$, with minimal yearly changes of 0.08% and 0.04%.
  • The largest year-on-year depreciation occurred in 2017 with a 12.63% change.
  • Despite the earlier years of high volatility, Tunisia’s currency performance in the last three years suggests better monetary management and external stability.

Southern Africa's debt-to-GDP ratio is expected to rise by 5.8 percentage points, contrasting with declines in other regions
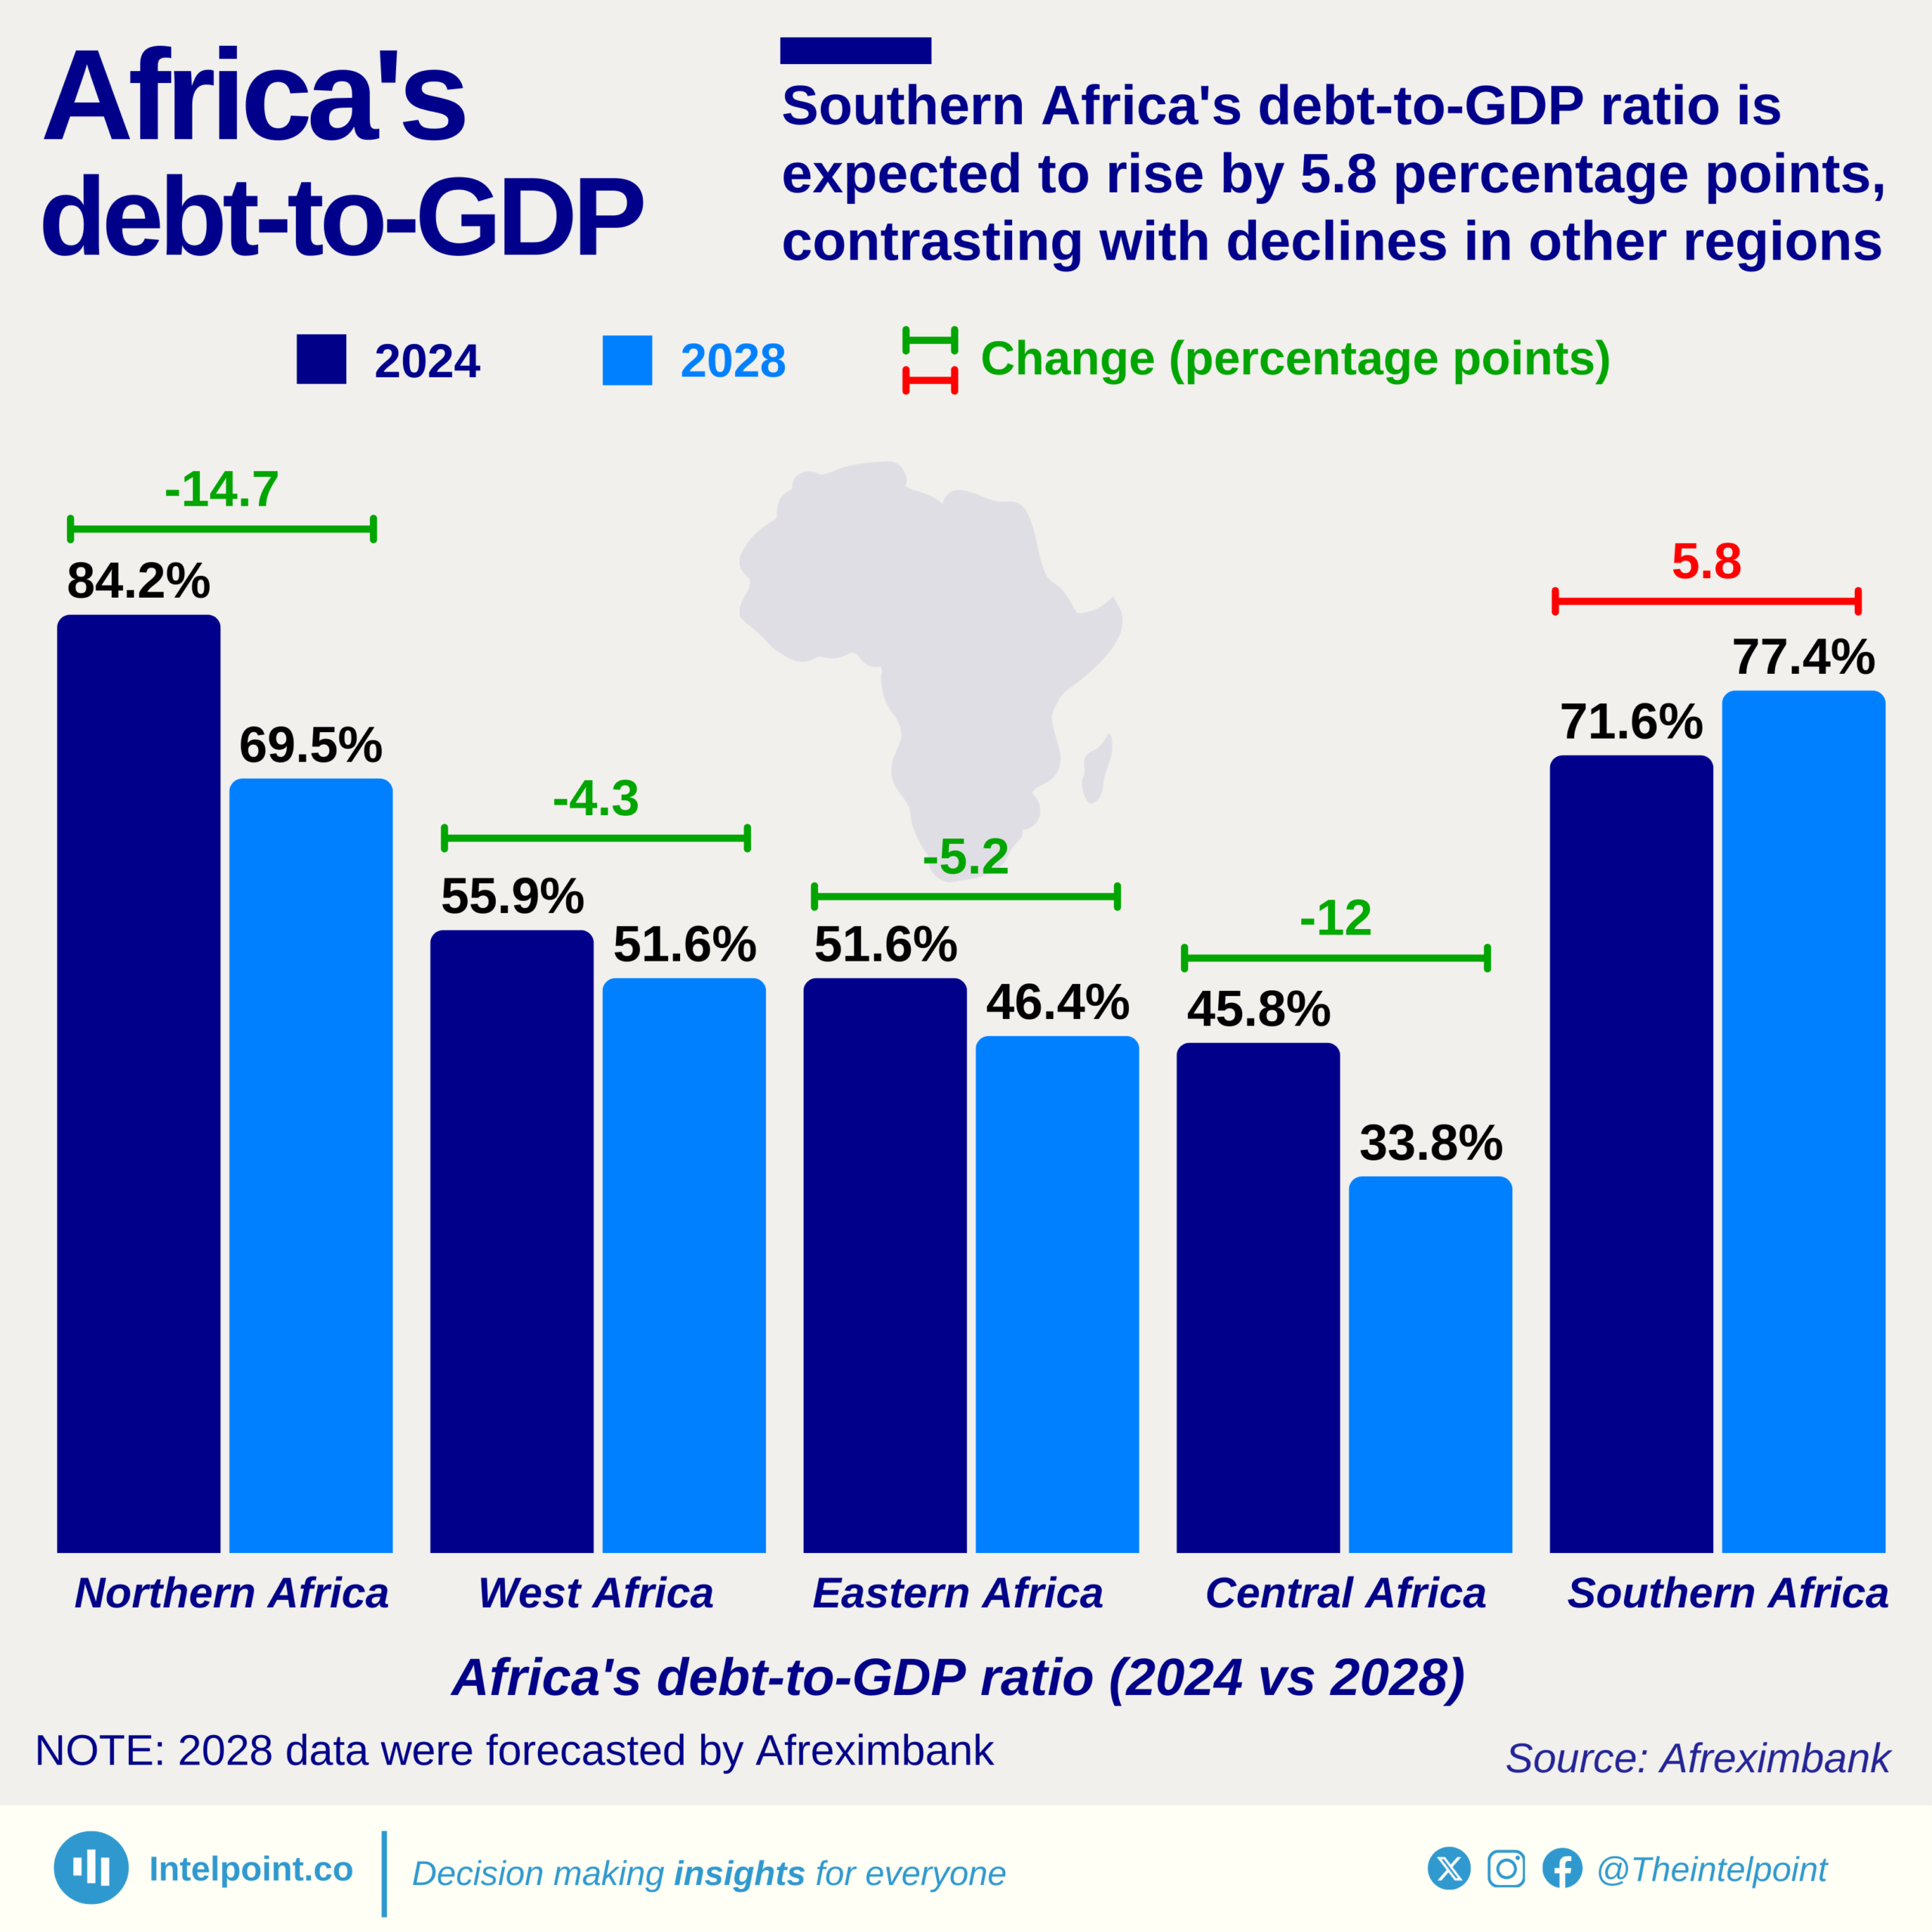
  • Unlike other regions, Southern Africa’s debt-to-GDP ratio is expected to increase by 5.8 percentage points, reaching 77.4% by 2028.
  • Northern Africa is set to achieve the largest debt-to-GDP decline of 14.7 percentage points, from 84.2% to 69.5%, indicating significant fiscal adjustments.
  • Central Africa is expected to see a 12 percentage point drop, reducing its debt-to-GDP ratio from 45.8% to 33.8%.
  • West Africa’s debt-to-GDP ratio is projected to fall by 4.3 percentage points, while Eastern Africa is expected to drop by 5.2 percentage points, both showing signs of improved debt management.
  • Even with the projected declines, some regions like Northern Africa (69.5%) and Southern Africa (77.4%) will still have high debt burdens compared to others like Central Africa (33.8%).
  • The declining debt-to-GDP ratios in most regions suggest either economic expansion or strategic debt control, but Southern Africa’s increase indicates potential fiscal stress.
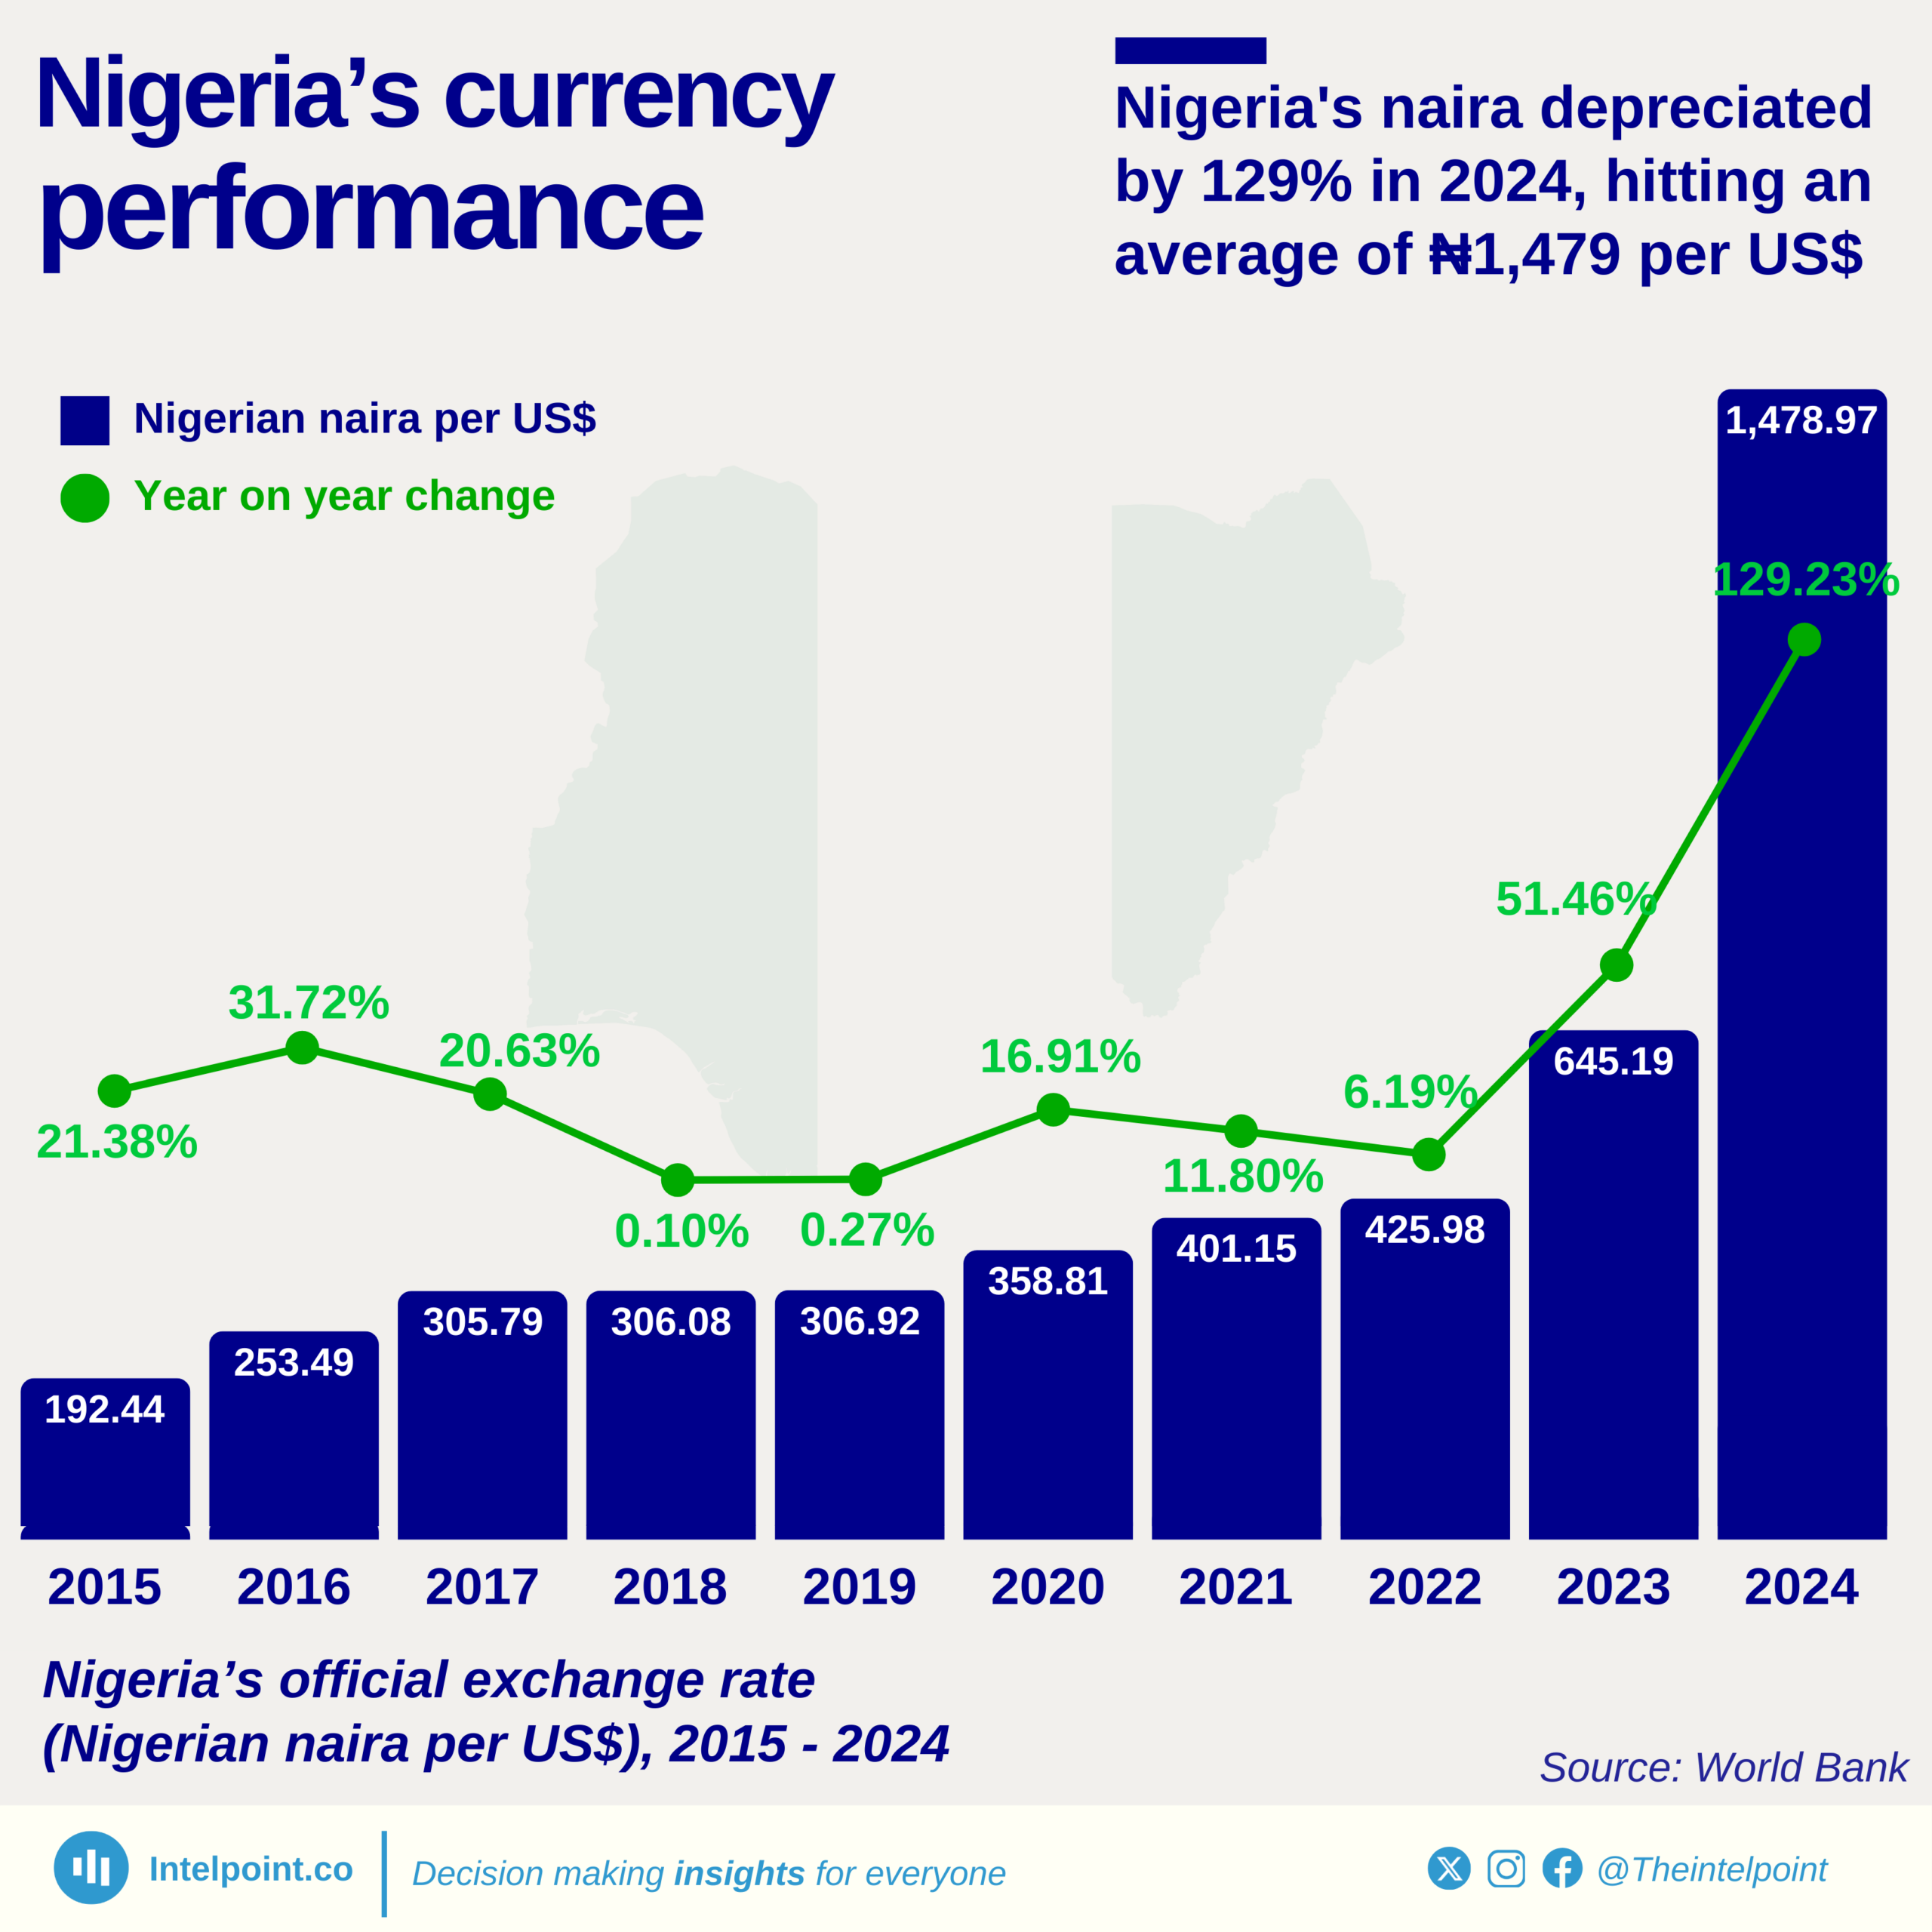
1 2

Can’t find what you’re looking for? Please fill the form below
Contact Form Demo
SIGN UP TO OUR NEWSLETTER
Get periodic updates about the African startup space, access to our reports, among others.
Subscribe Here
Subscription Form

A product of Techpoint Africa. All rights reserved