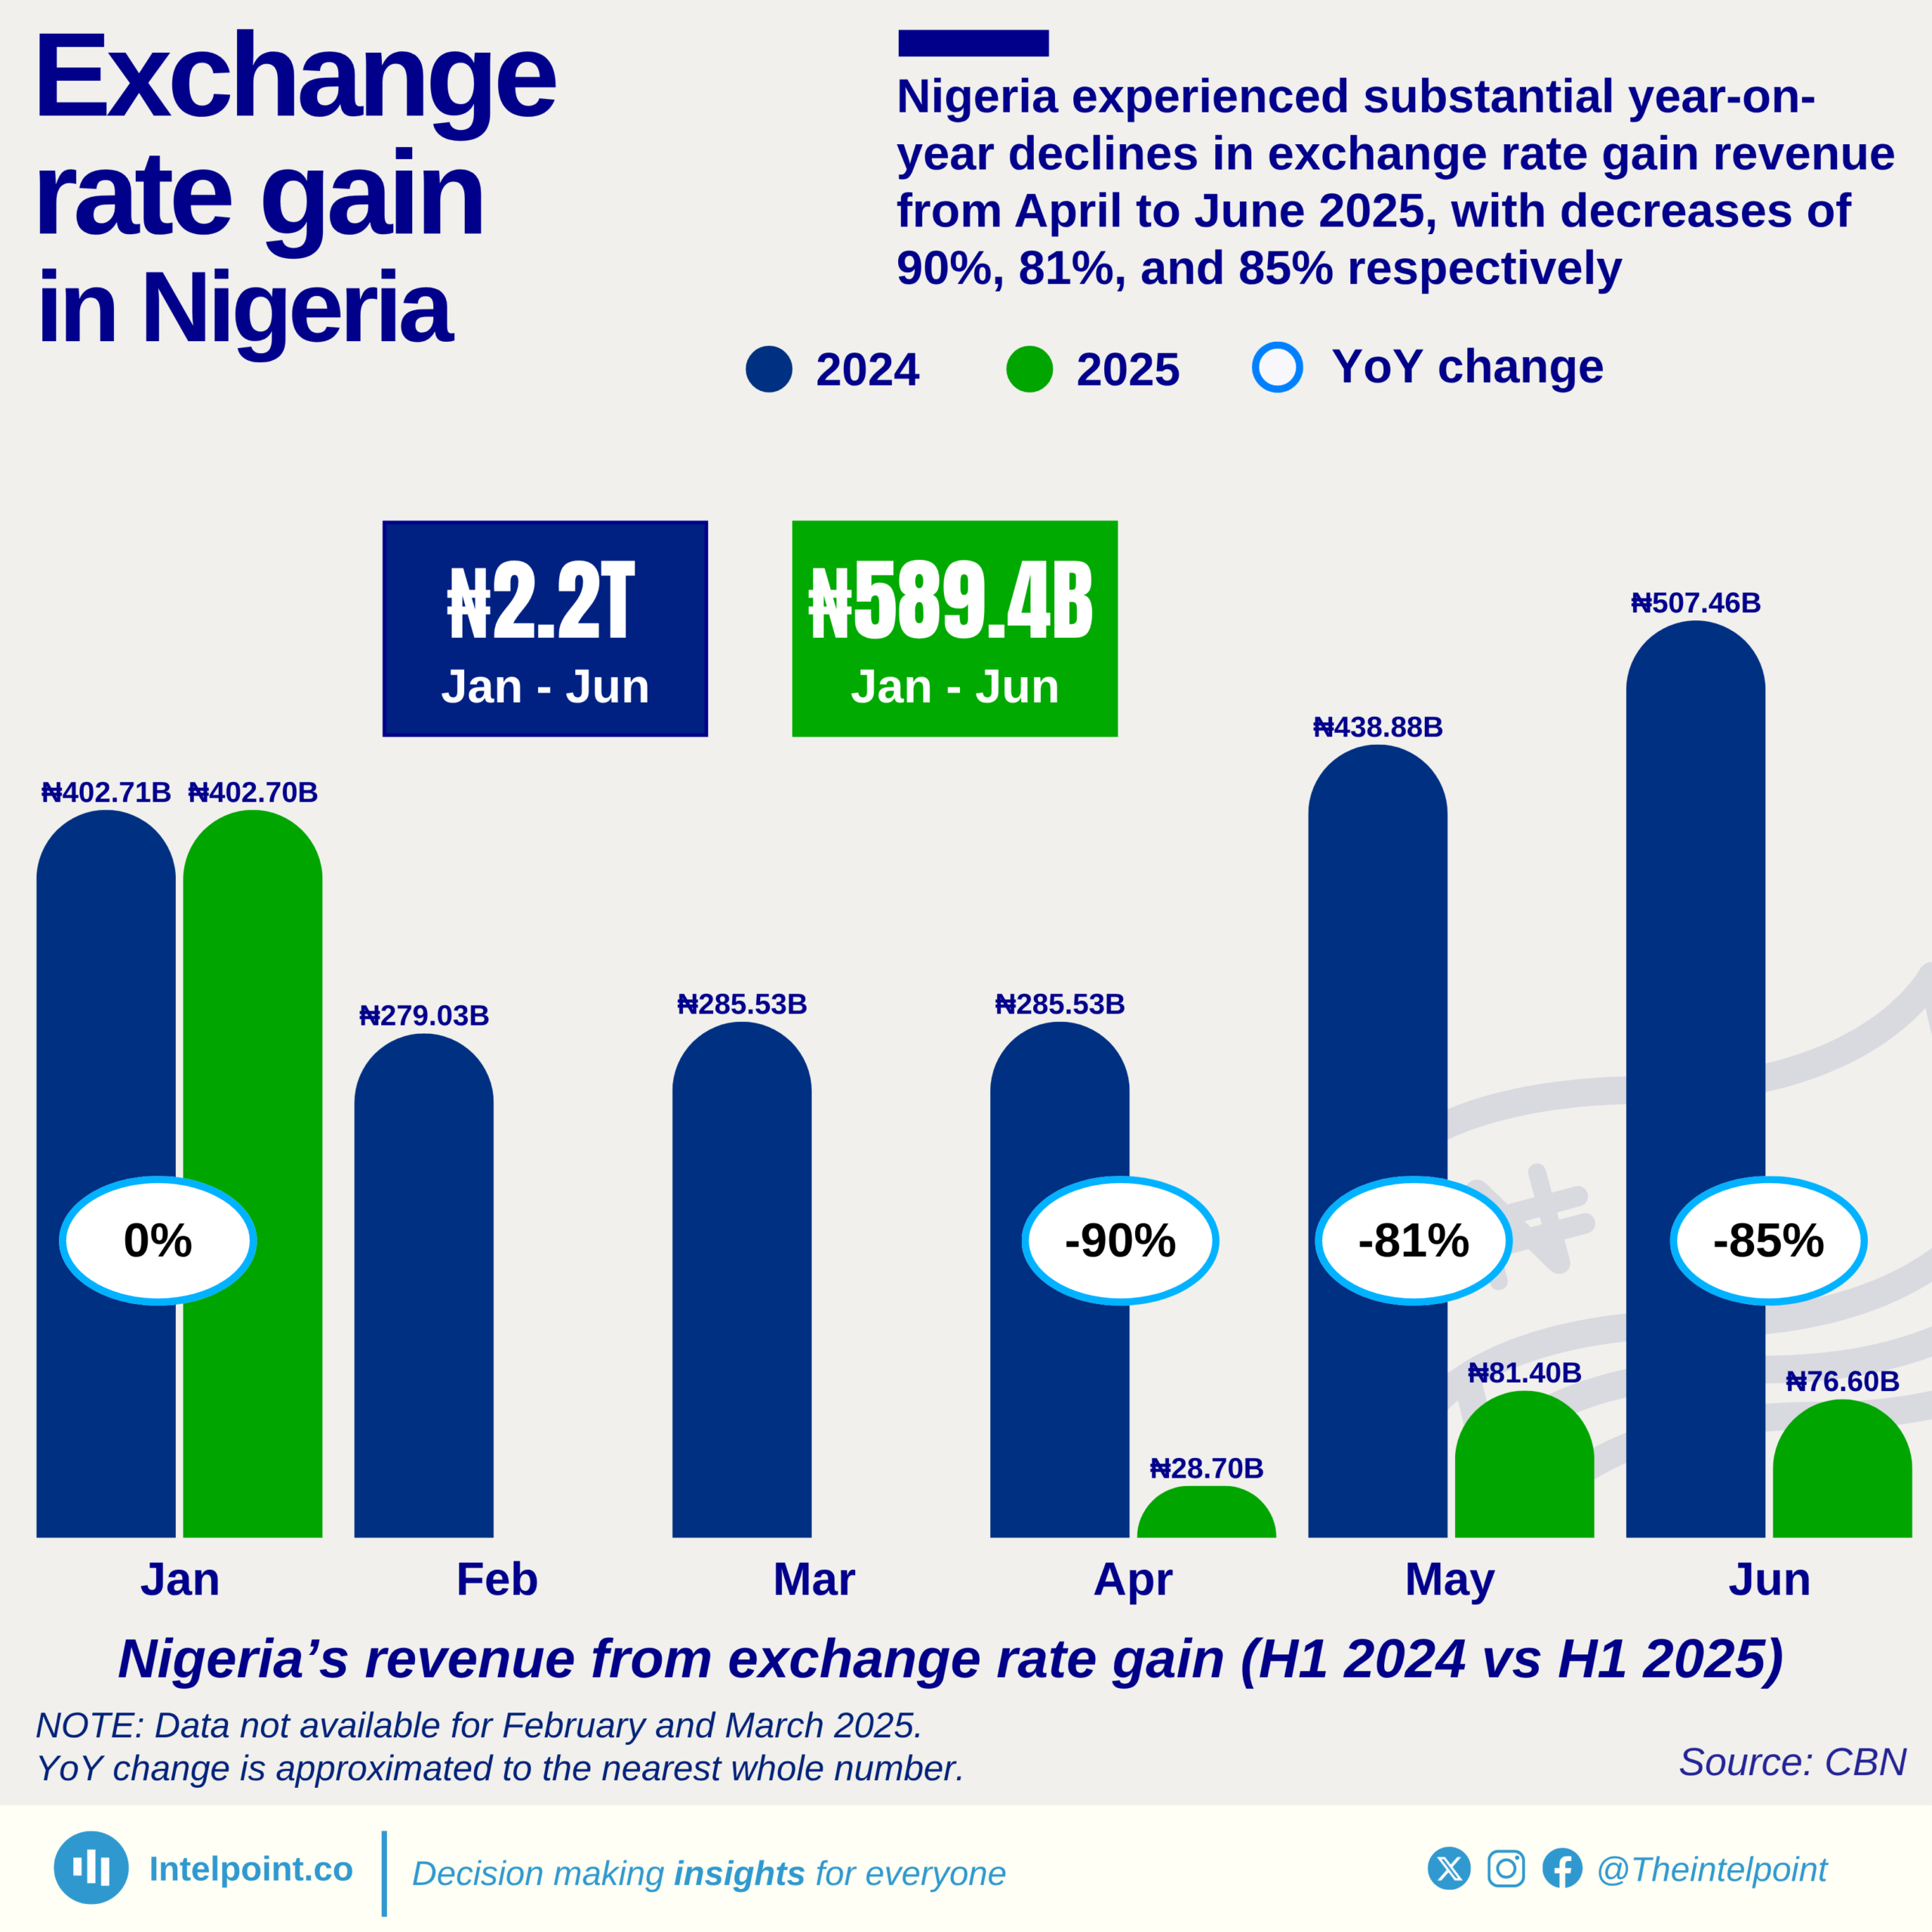
Nigeria experienced substantial year-on-year declines in exchange rate gain revenue from April to June 2025, with decreases of 90%, 81%, and 85% respectively

  • Nigeria’s exchange rate gain revenue dropped by 73.2% in H1 2025 compared to H1 2024.
  • In April 2025, exchange rate gain fell by 90% year-on-year from ₦285.5B to ₦28.7B.
  • May saw an 81% drop, with revenue declining from ₦438.9B in 2024 to ₦81.4B in 2025.
  • January 2025 was the only month with a stable figure, matching January 2024’s ₦402.7B.
  • Exchange rate gain revenue for February and March 2025 was unavailable, likely worsening the total.
  • The first half of 2025 generated only ₦589.4B in FX gains, compared to ₦2.2T in the same period in 2024.

Nigeria experienced a significant decline in revenue from exchange rate gains in the first half of 2025, dropping from ₦2.2 trillion in H1 2024 to just ₦589.4 billion—a 73.2% decrease. This collapse was most pronounced in the second quarter of 2025, where year-on-year comparisons showed sharp contractions of 90%, 81%, and 85% in April, May, and June, respectively, while January held steady at ₦402.7 billion.

This means that, in April 2024, Nigeria earned ₦285.5 billion in exchange rate gains. A year later, it earned only ₦28.7 billion. May followed the same pattern, plunging from ₦438.9 billion to ₦81.4 billion. And in June, revenue further collapsed from ₦507.5 billion to ₦76.6 billion.
Source:

CBN

Period:

Jan-Jun 2025
HTML code to embed chart
Want a bespoke report?
Reach out
Tags
Related Insights

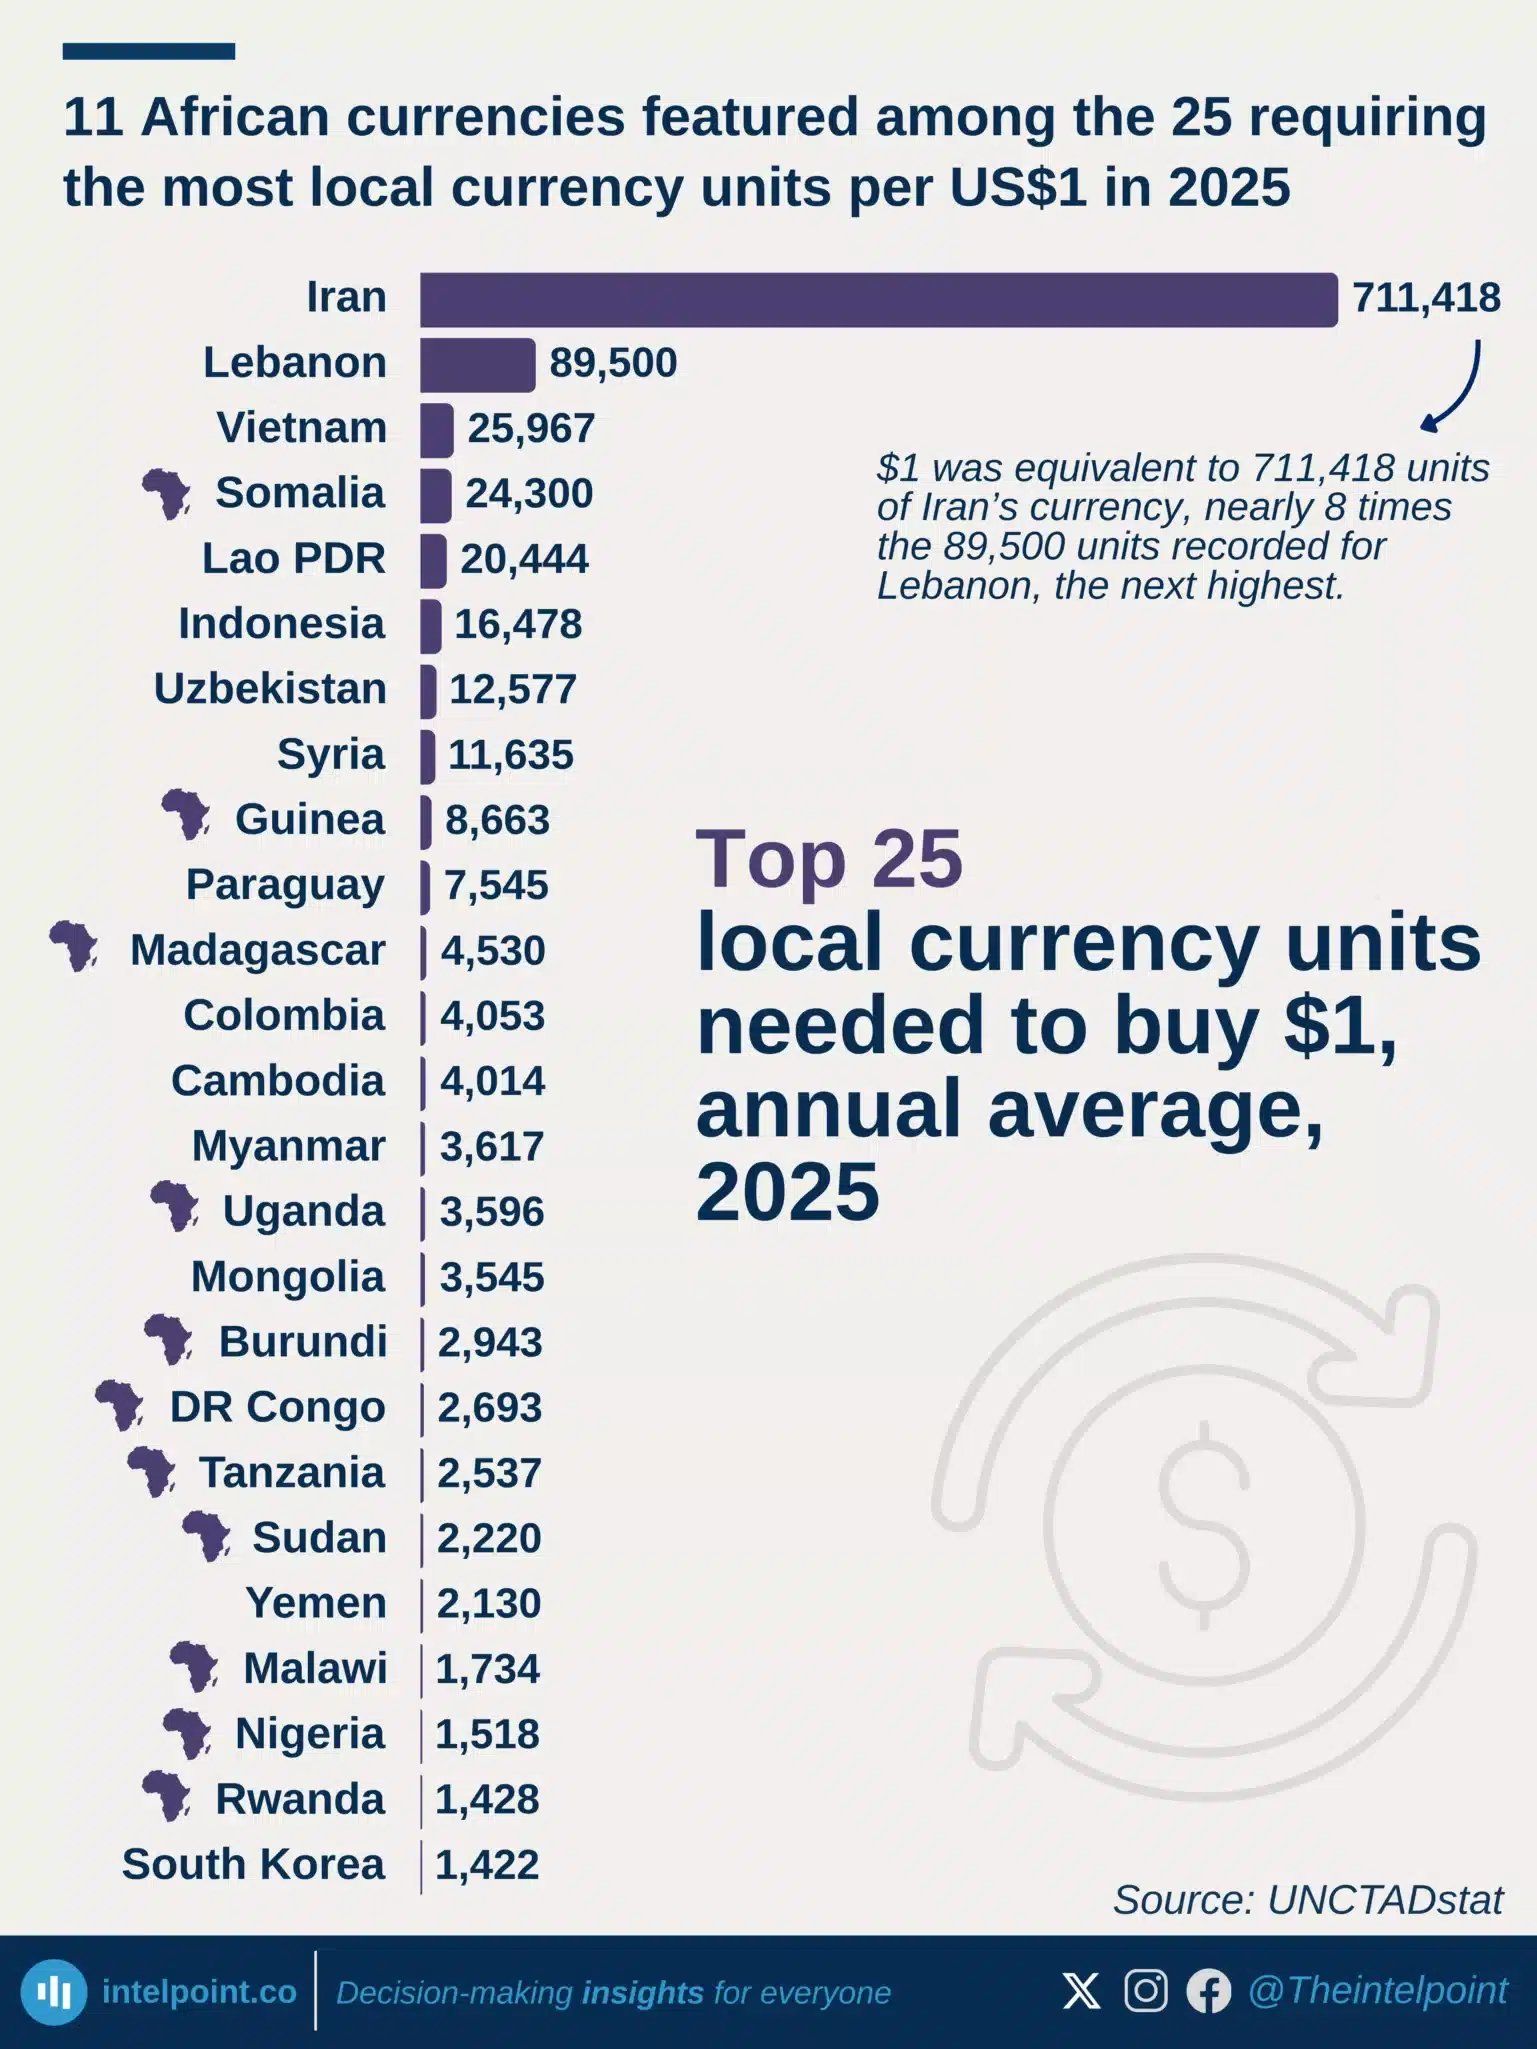
11 African currencies featured among the 25 requiring the most local currency units per US$1 in 2025
  • 11 African currencies featured among the 25 listed.
  • Somalia had the highest exchange rate among the African currencies highlighted, at 24,300 shillings per US$1.
  • Nigeria’s naira averaged ₦1,518 per US$1 in 2025.
  • 7 of the 11 African countries were in Eastern Africa, based on the UN M49 subregional classification.
  • Iran was the global outlier, averaging 711,418 rials per US$1, nearly eight times Lebanon’s 89,500.

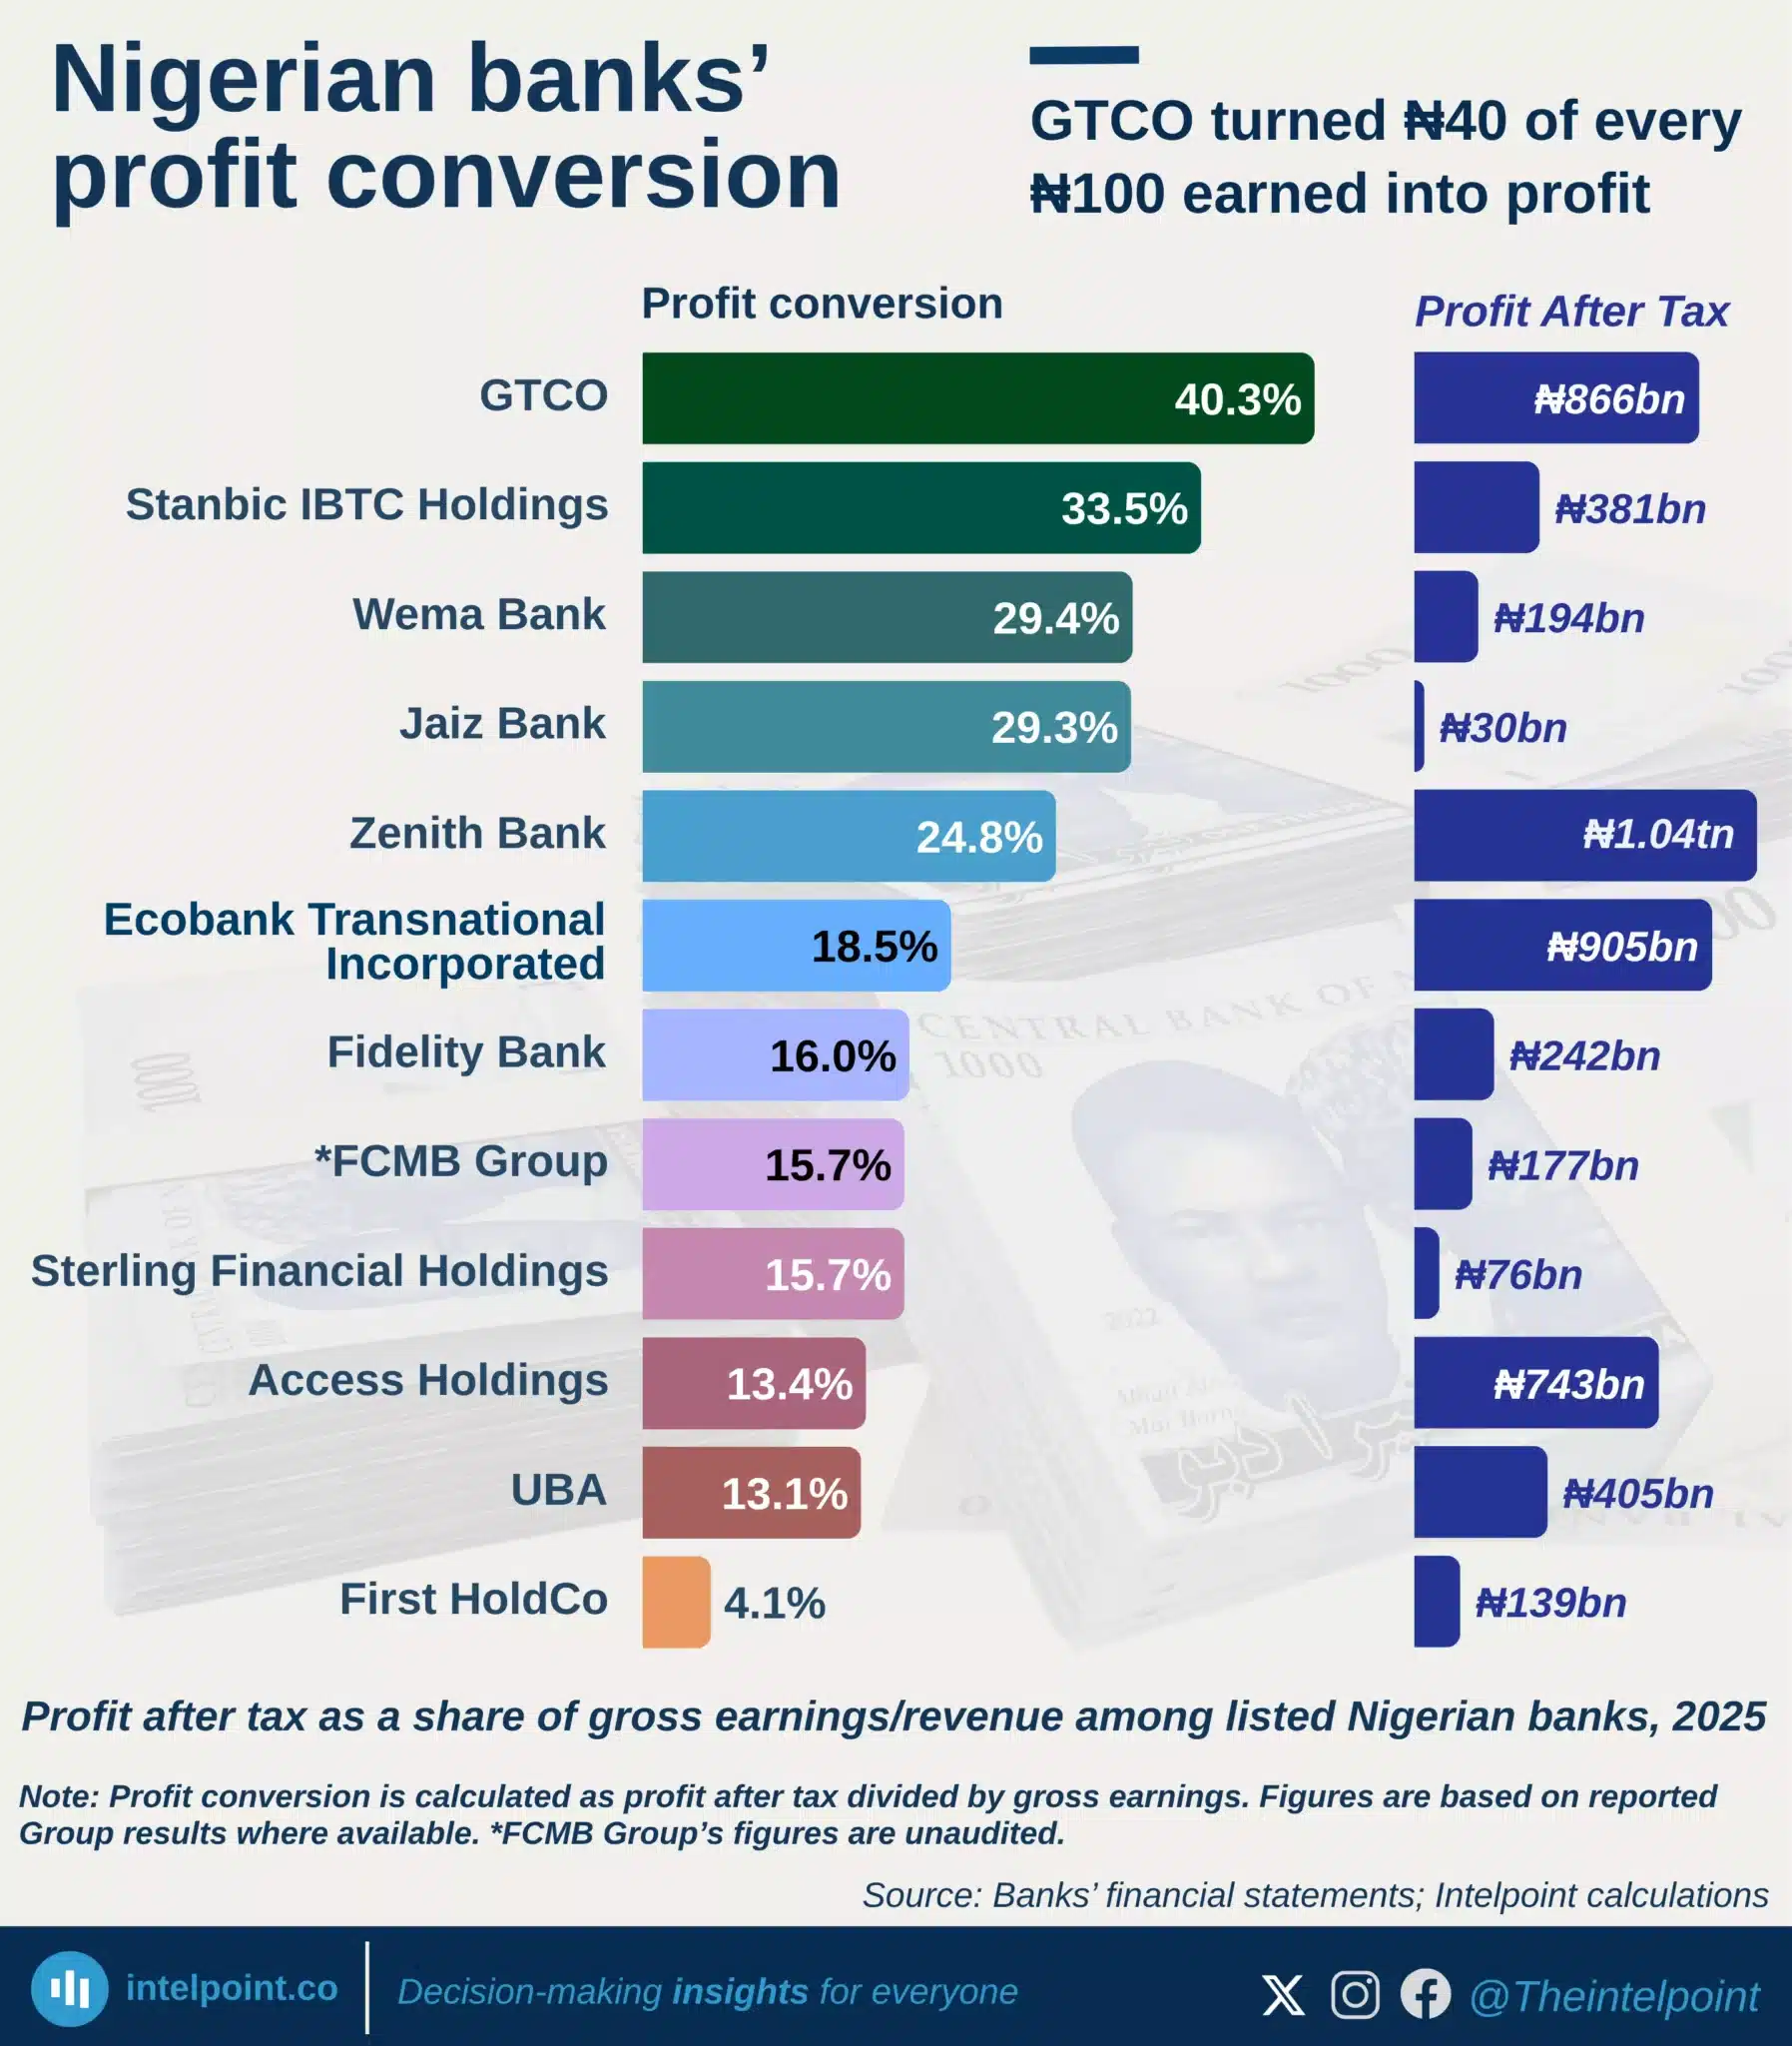
GTCO turned ₦40 of every ₦100 earned into profit
  • GTCO had the strongest profit conversion in 2025.
  • GTCO turned about ₦40 of every ₦100 earned into profit.
  • Stanbic IBTC followed with about ₦34 profit per ₦100 earned.
  • Zenith made the highest profit, but not the strongest conversion.
  • First HoldCo had the weakest profit conversion among the banks reviewed.
 

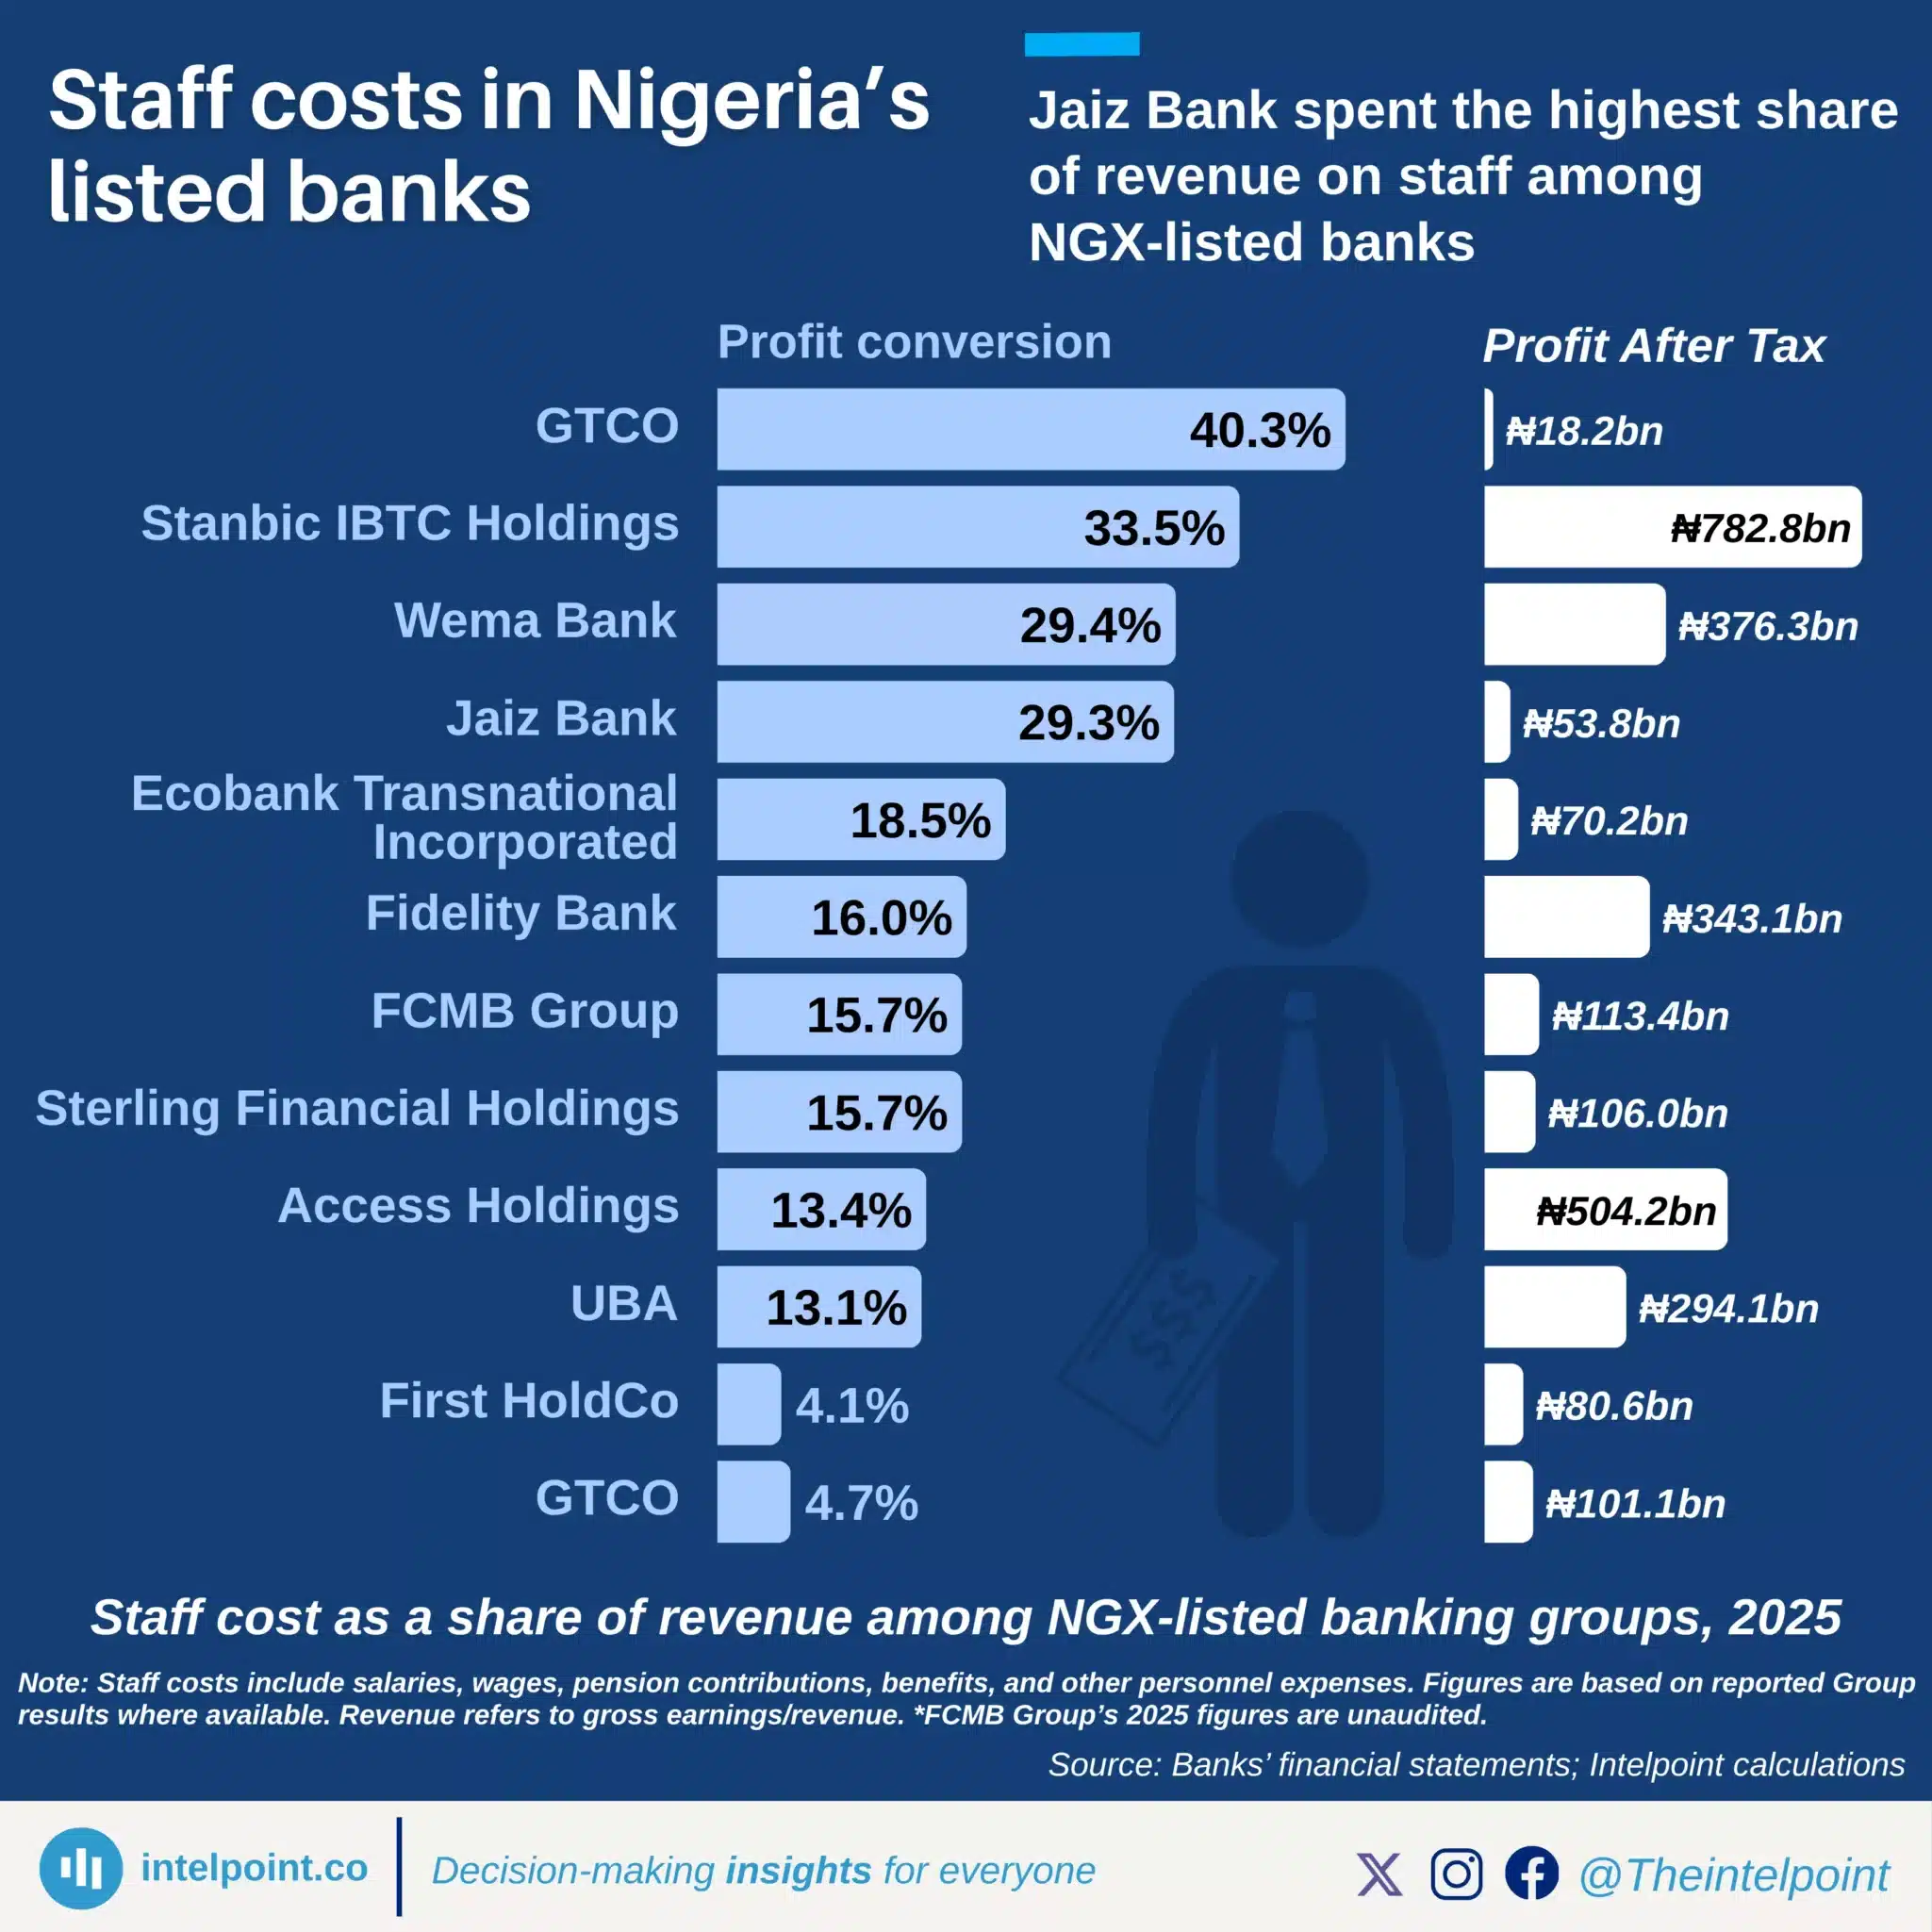
Jaiz Bank spent the highest share of revenue on staff among NGX-listed banks
Jaiz Bank spent the highest share of revenue on staff in 2025. Jaiz spent nearly ₦18 on staff for every ₦100 of revenue. ETI and UBA followed with the next highest staff-cost-to-revenue ratios. GTCO had the lowest staff-cost burden among the listed banks. ETI spent the most in absolute staff costs, at ₦782.8 billion.

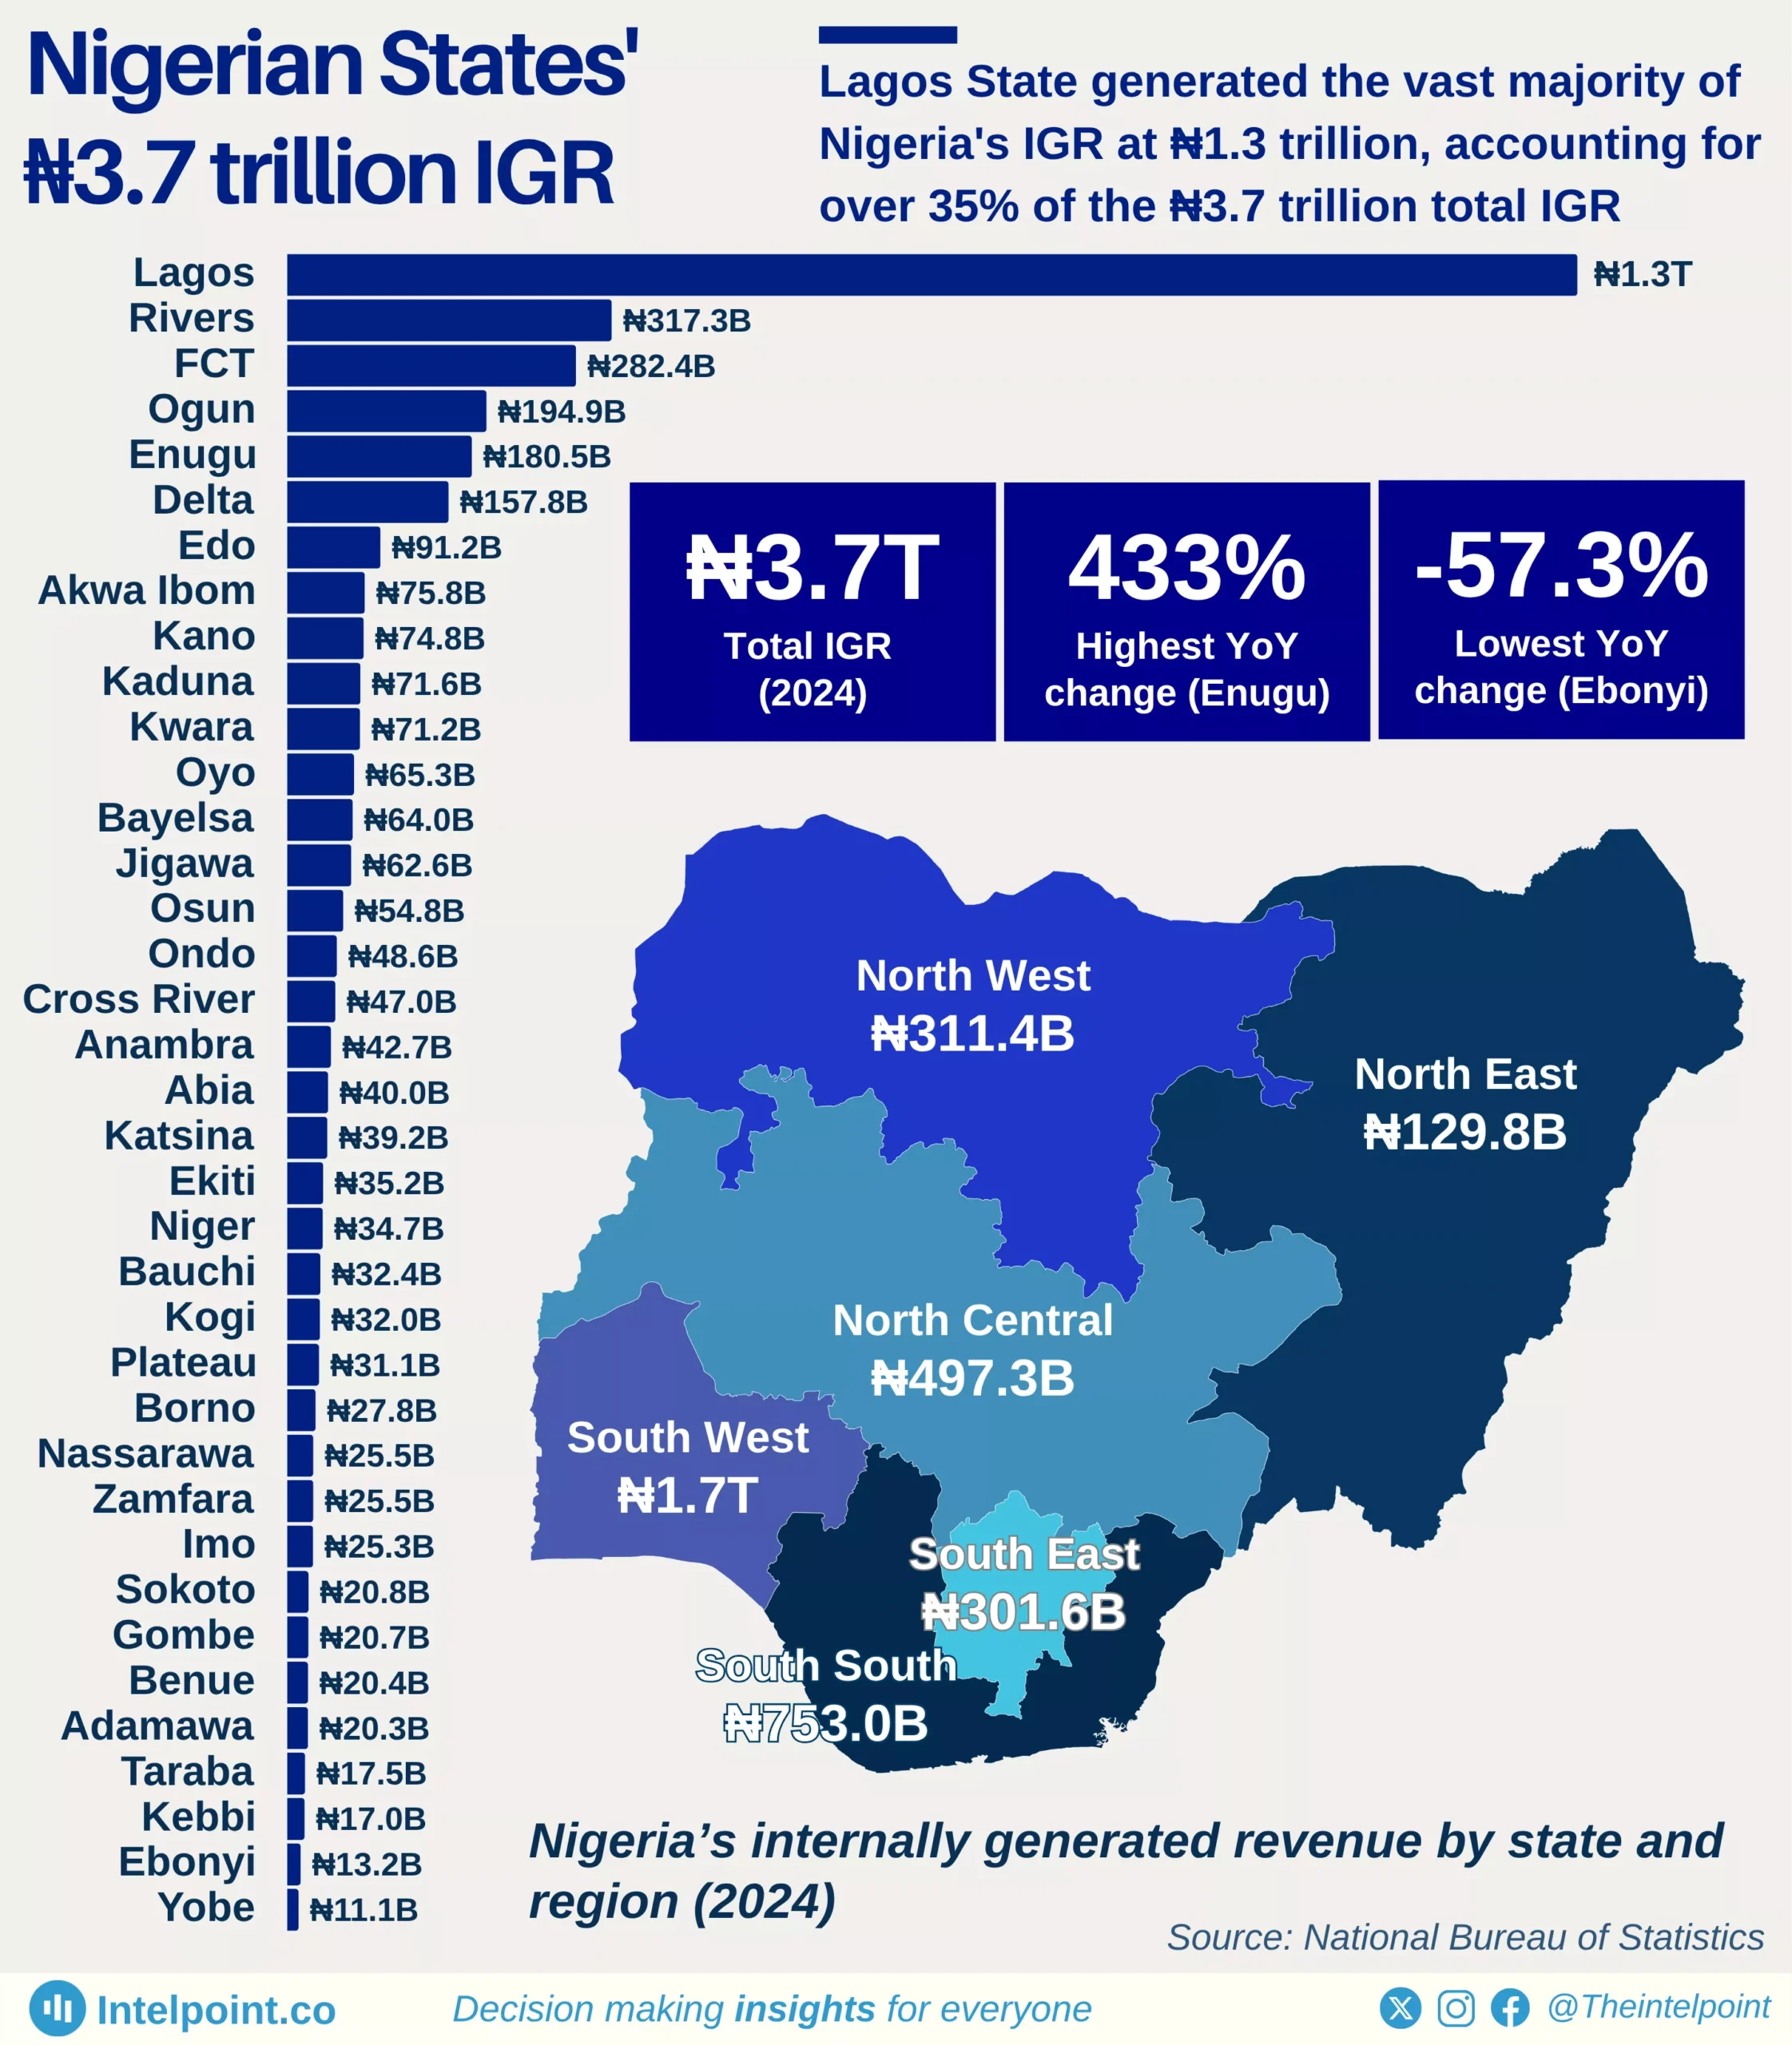
Lagos State generated the vast majority of Nigeria's IGR at ₦1.3 trillion, accounting for over 35% of the ₦3.7 trillion total IGR
  • Nigeria’s total IGR in 2024 was ₦3.7 trillion.
  • Lagos State generated ₦1.3 trillion, accounting for over 35% of the national IGR.
  • Rivers State (₦317.3 billion) and the FCT, Abuja (₦282.4 billion) ranked second and third, respectively.
  • The South West led regionally with ₦1.7 trillion in total IGR.
  • The North East recorded the lowest regional IGR at ₦129.8 billion.
  • Economic disparity between regions remains wide, with Lagos alone outpacing entire regions.

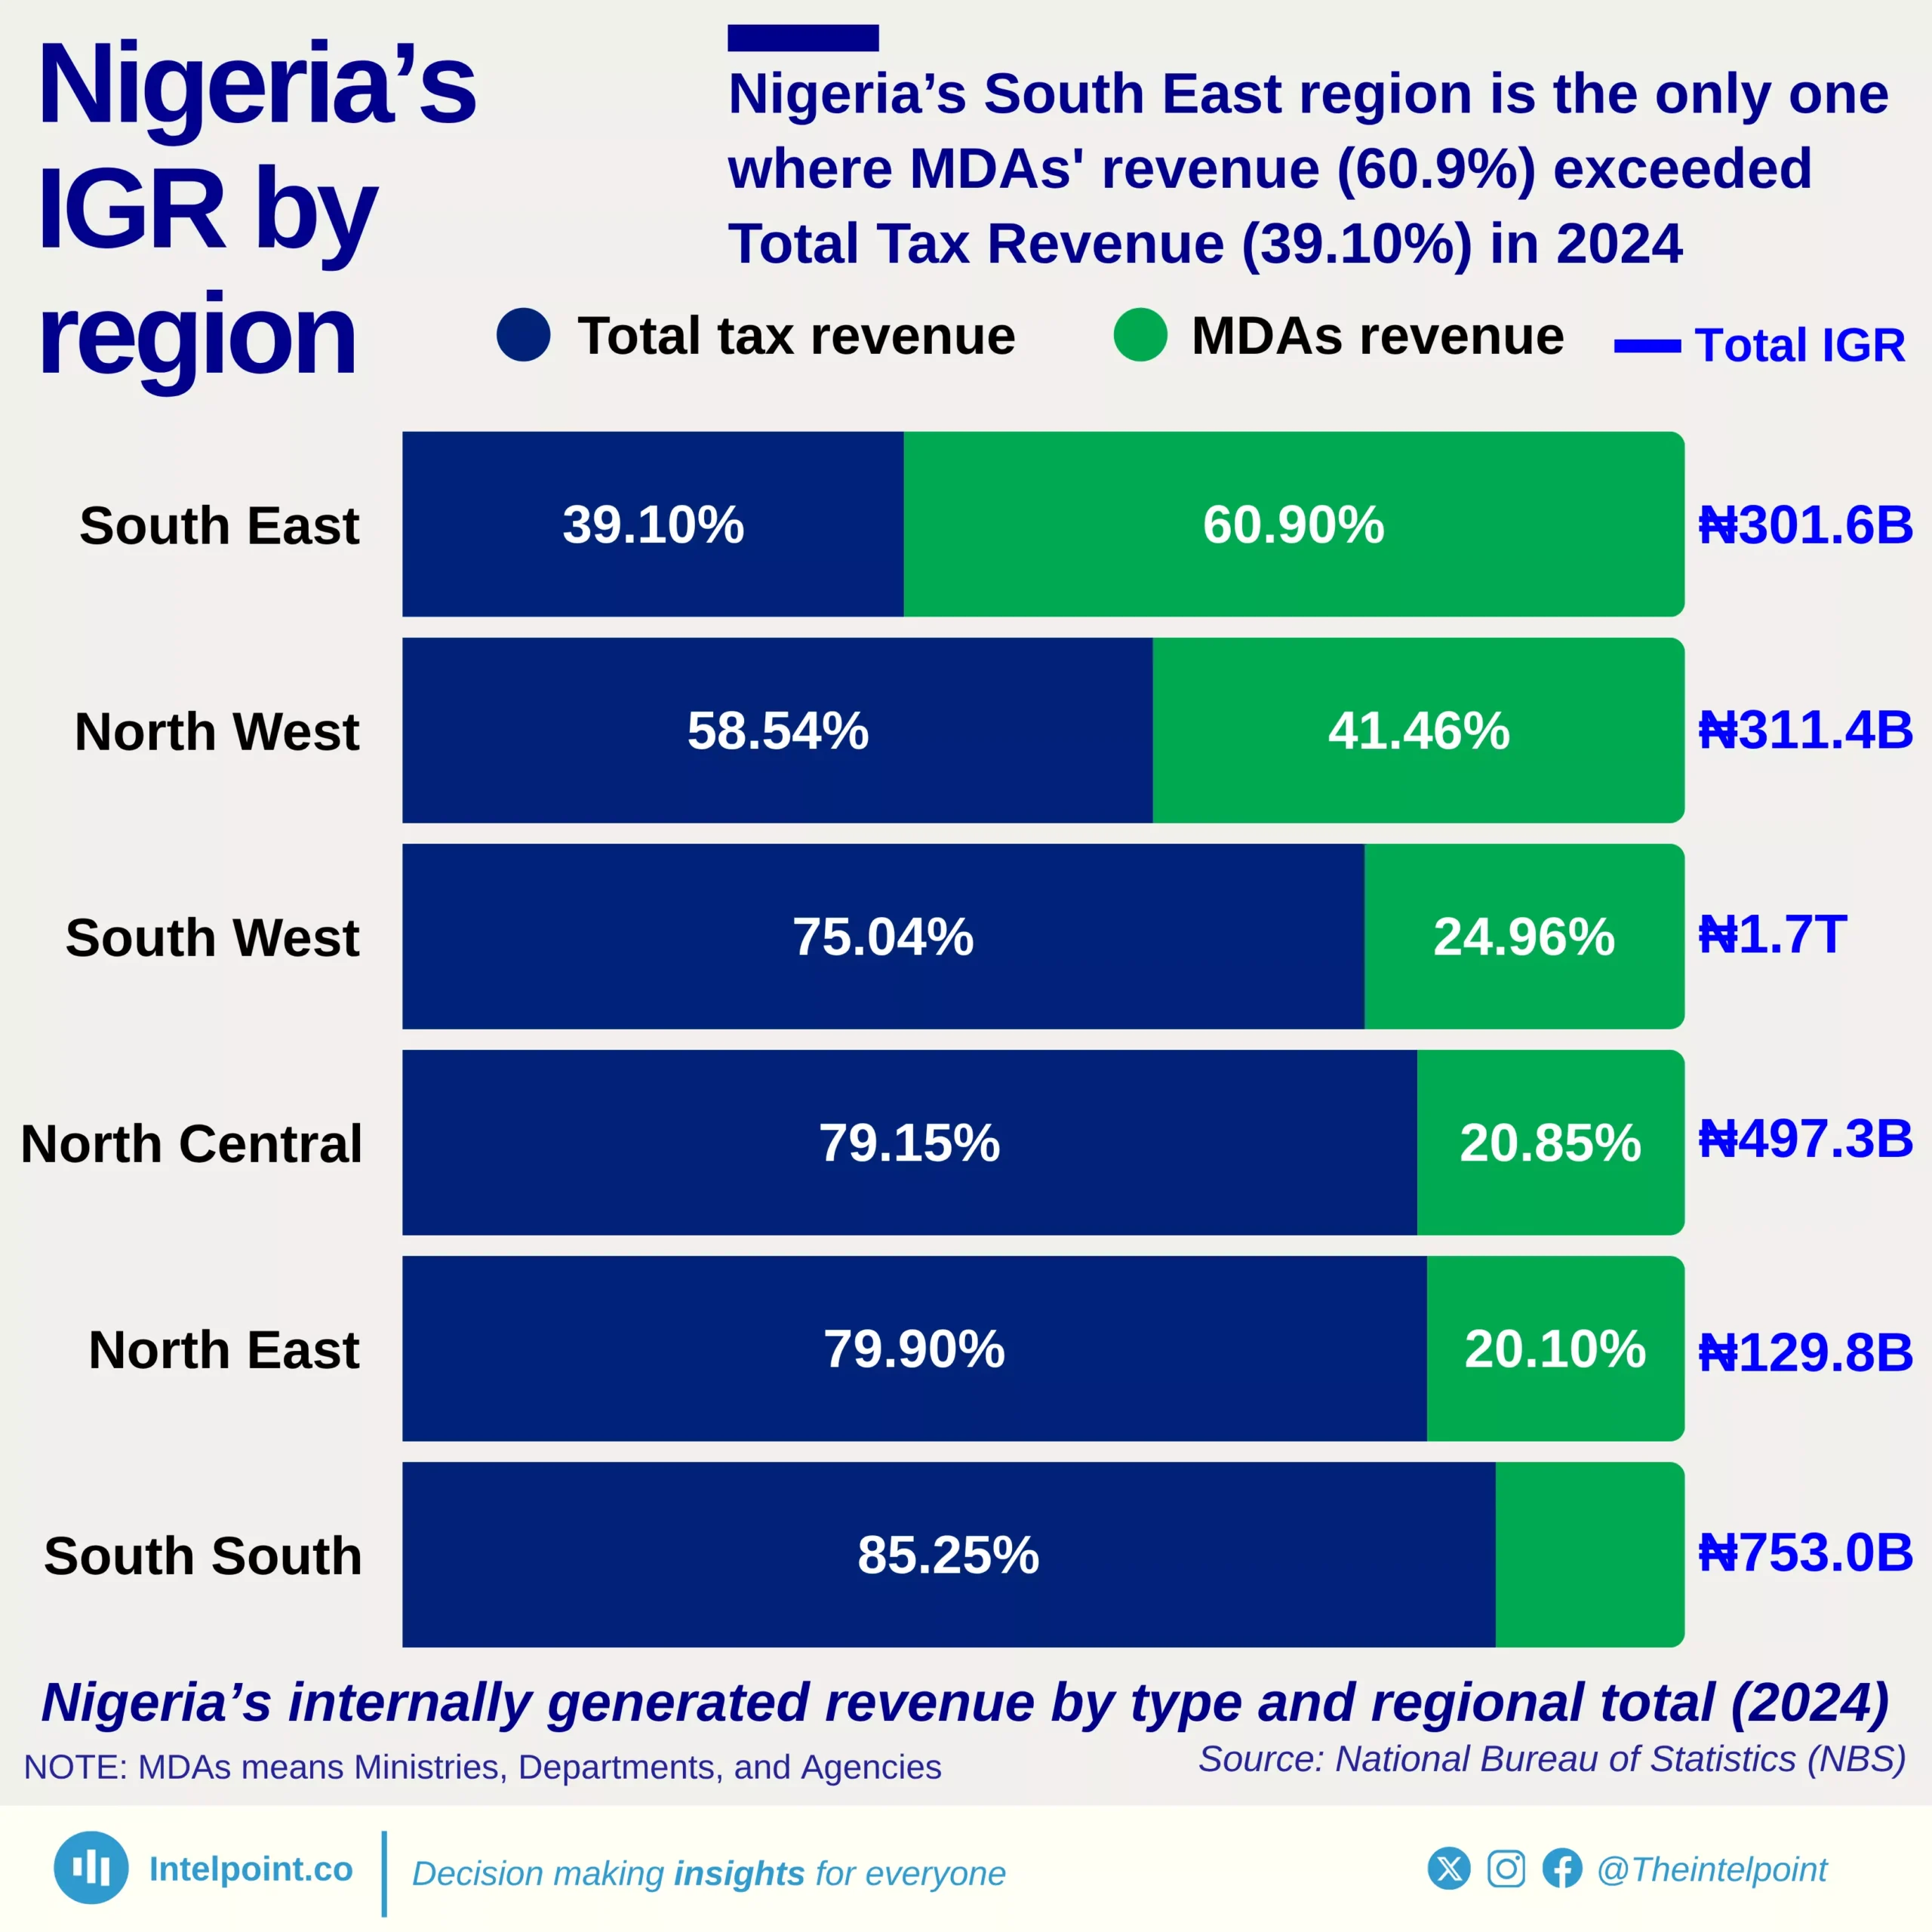
Nigeria’s South East region is the only one where MDAs' revenue (60.9%) exceeded Total Tax Revenue (39.10%) in 2024
  • The South East is the only region where the revenue of MDAs (60.9%) exceeded tax revenue (39.1%).
  • Other regions relied more heavily on tax revenue, with the South South leading at 85.25%.
  • The North East and North Central followed closely, with tax contributions of 79.9% and 79.15%, respectively.
  • The South West generated 75.04% of its IGR from taxes, indicating a strong formal revenue structure.
  • The North West maintained a more balanced mix, with 58.54% tax and 41.46% MDAs’ revenue.

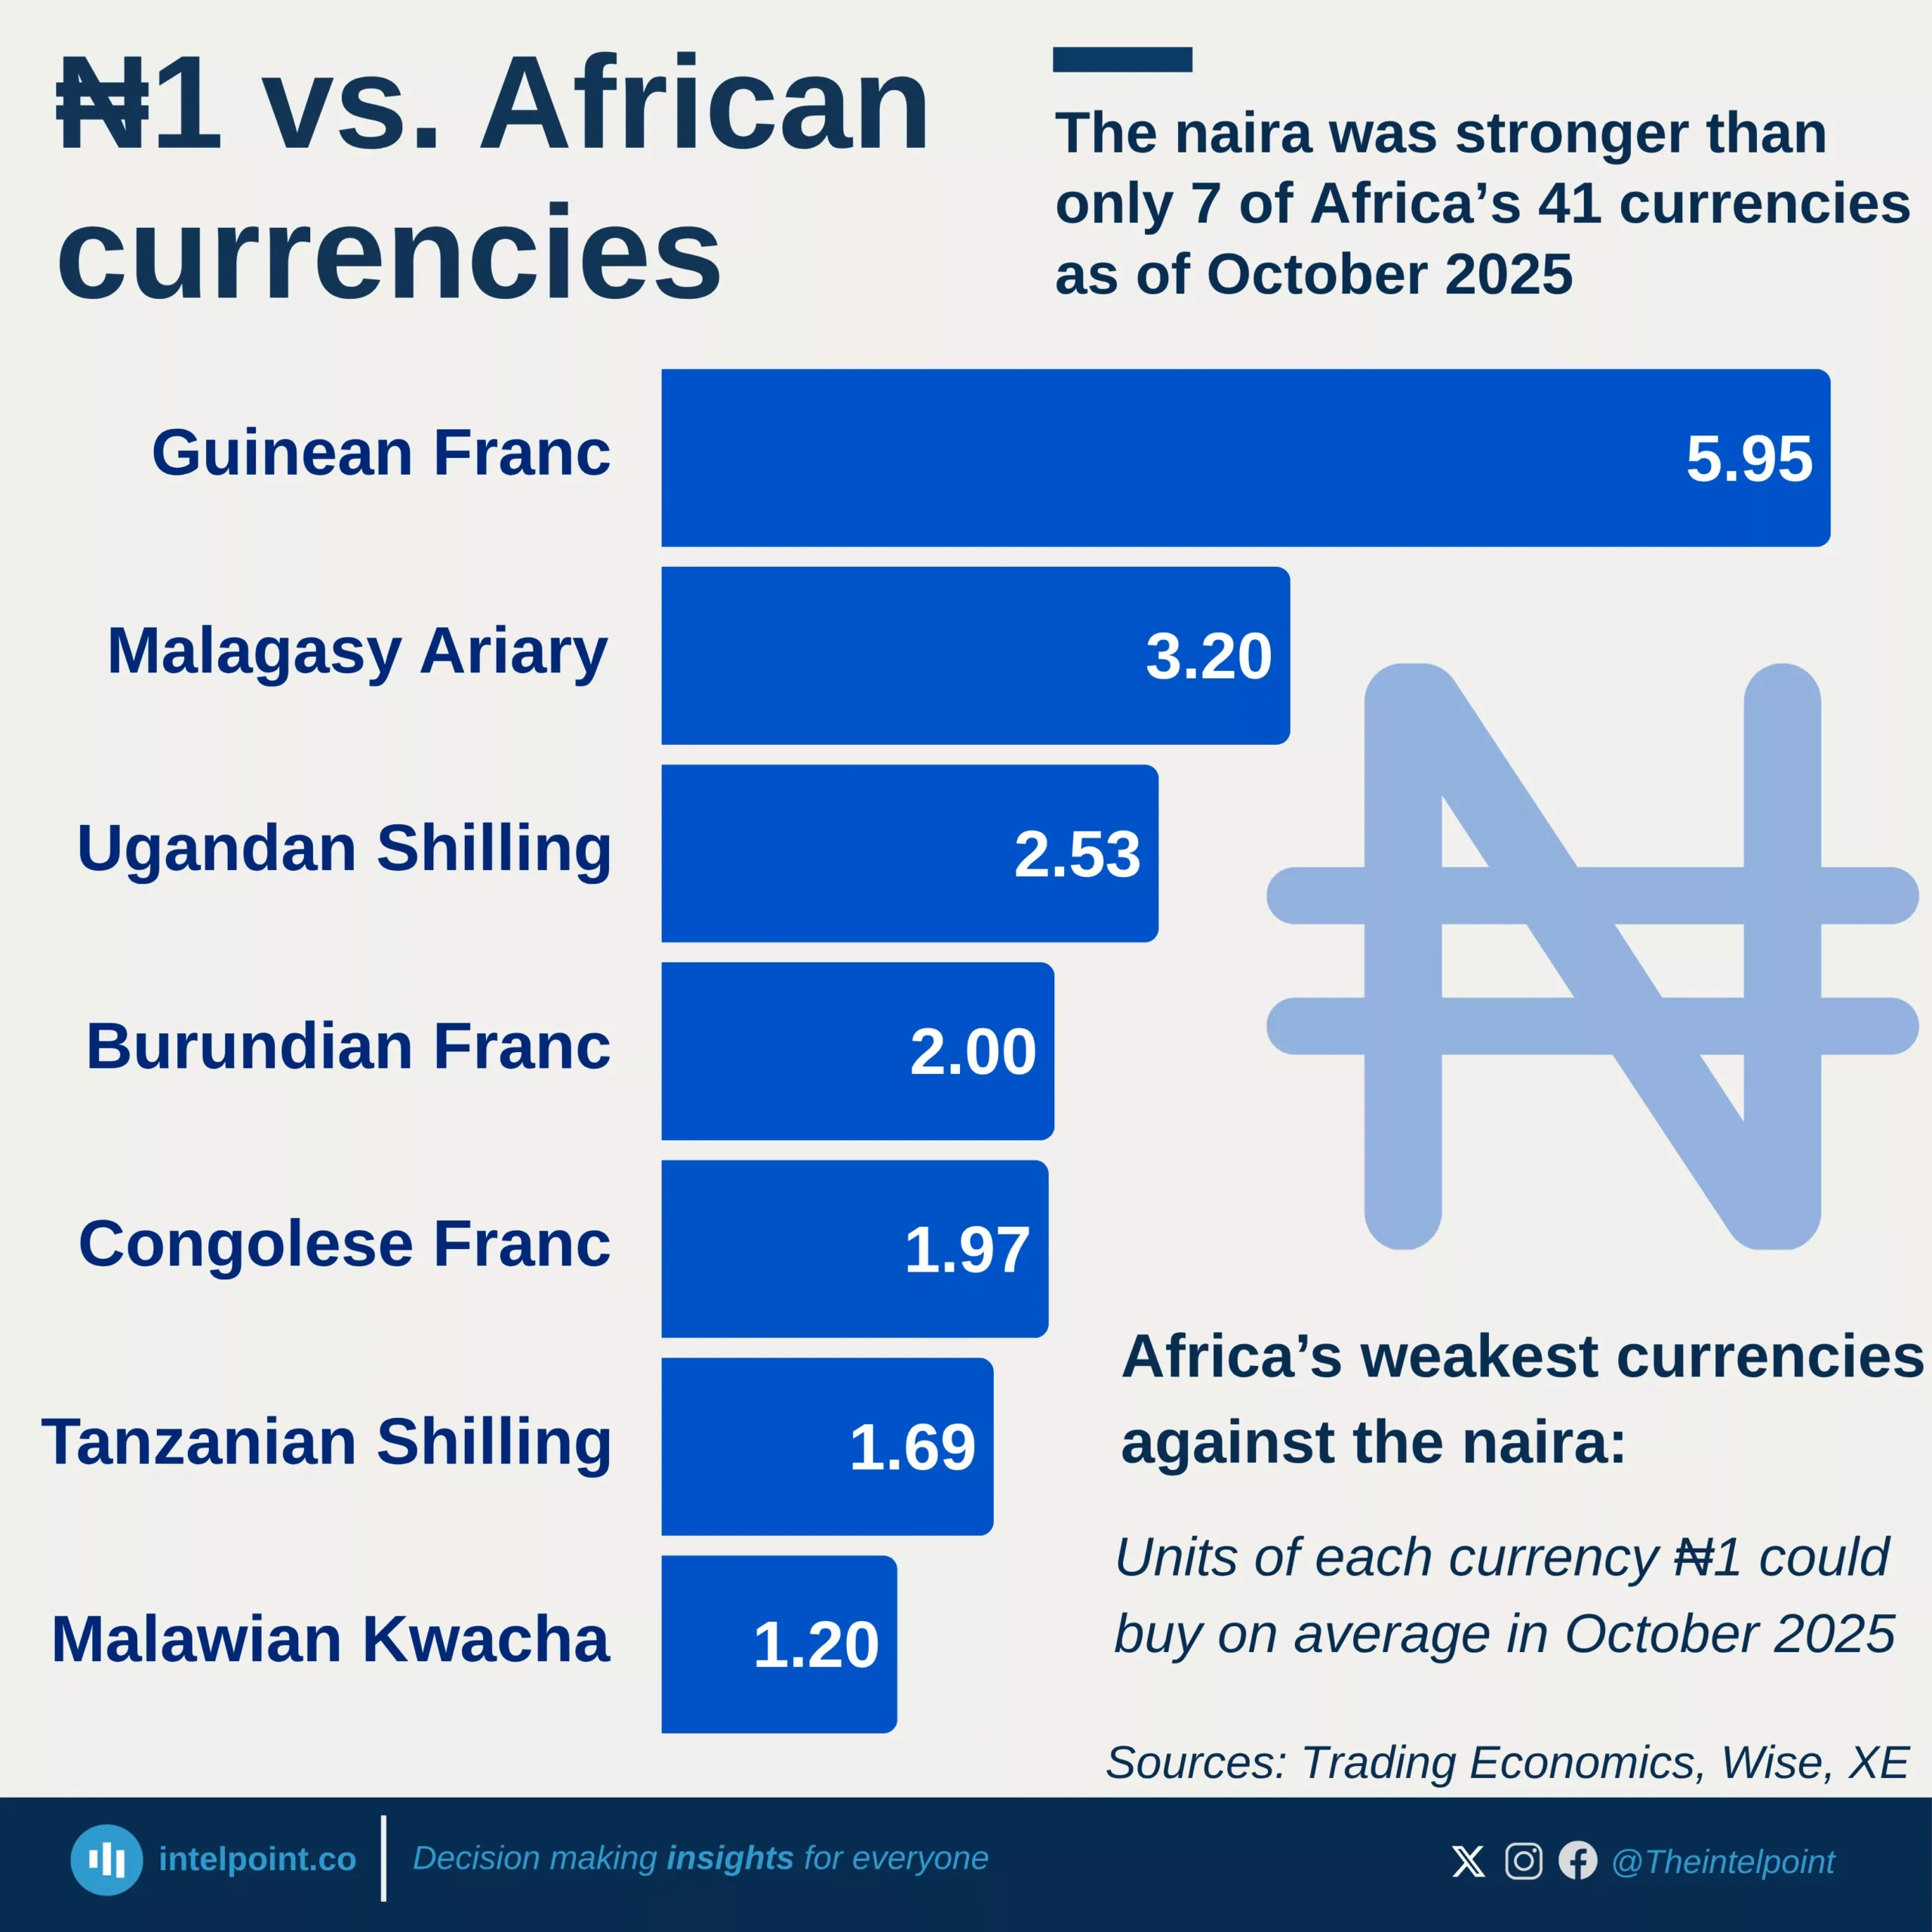
The naira was stronger than only 7 of Africa’s 41 currencies as of October 2025
  • The naira buys the most in countries like Guinea, Uganda, Burundi, and Malawi, where local currencies have lost value faster.
  • High inflation and unstable monetary systems have eroded the strength of several African currencies.
  • Most of the weakest currencies are in East and West Africa.
  •  The naira’s higher value in these countries does not mean it has fully recovered.

POPULAR TOPICS
SIGN UP TO OUR NEWSLETTER
Get periodic updates about the African startup space, access to our reports, among others.
Subscribe Here
Subscription Form

A product of Techpoint Africa. All rights reserved