Fifteen months into President Tinubu’s tenure, the rate of one dollar to naira has gone up by 245%

When Olusegun Obasanjo took office in 1999, the exchange rate was ₦97 to $1; it was ₦128 under Yar'Adua in 2007. During Jonathan's tenure in 2010 it was ₦151 while it was ₦199 when Buhari was in office.

Despite efforts to let market forces decide the rate, the naira continues to weaken. Will the current administration turn things around soon?
Source:

Central Bank of Nigeria, Investing.com

Period:

1999 - 2024
HTML code to embed chart
Want a bespoke report?
Reach out
Tags
Related Insights

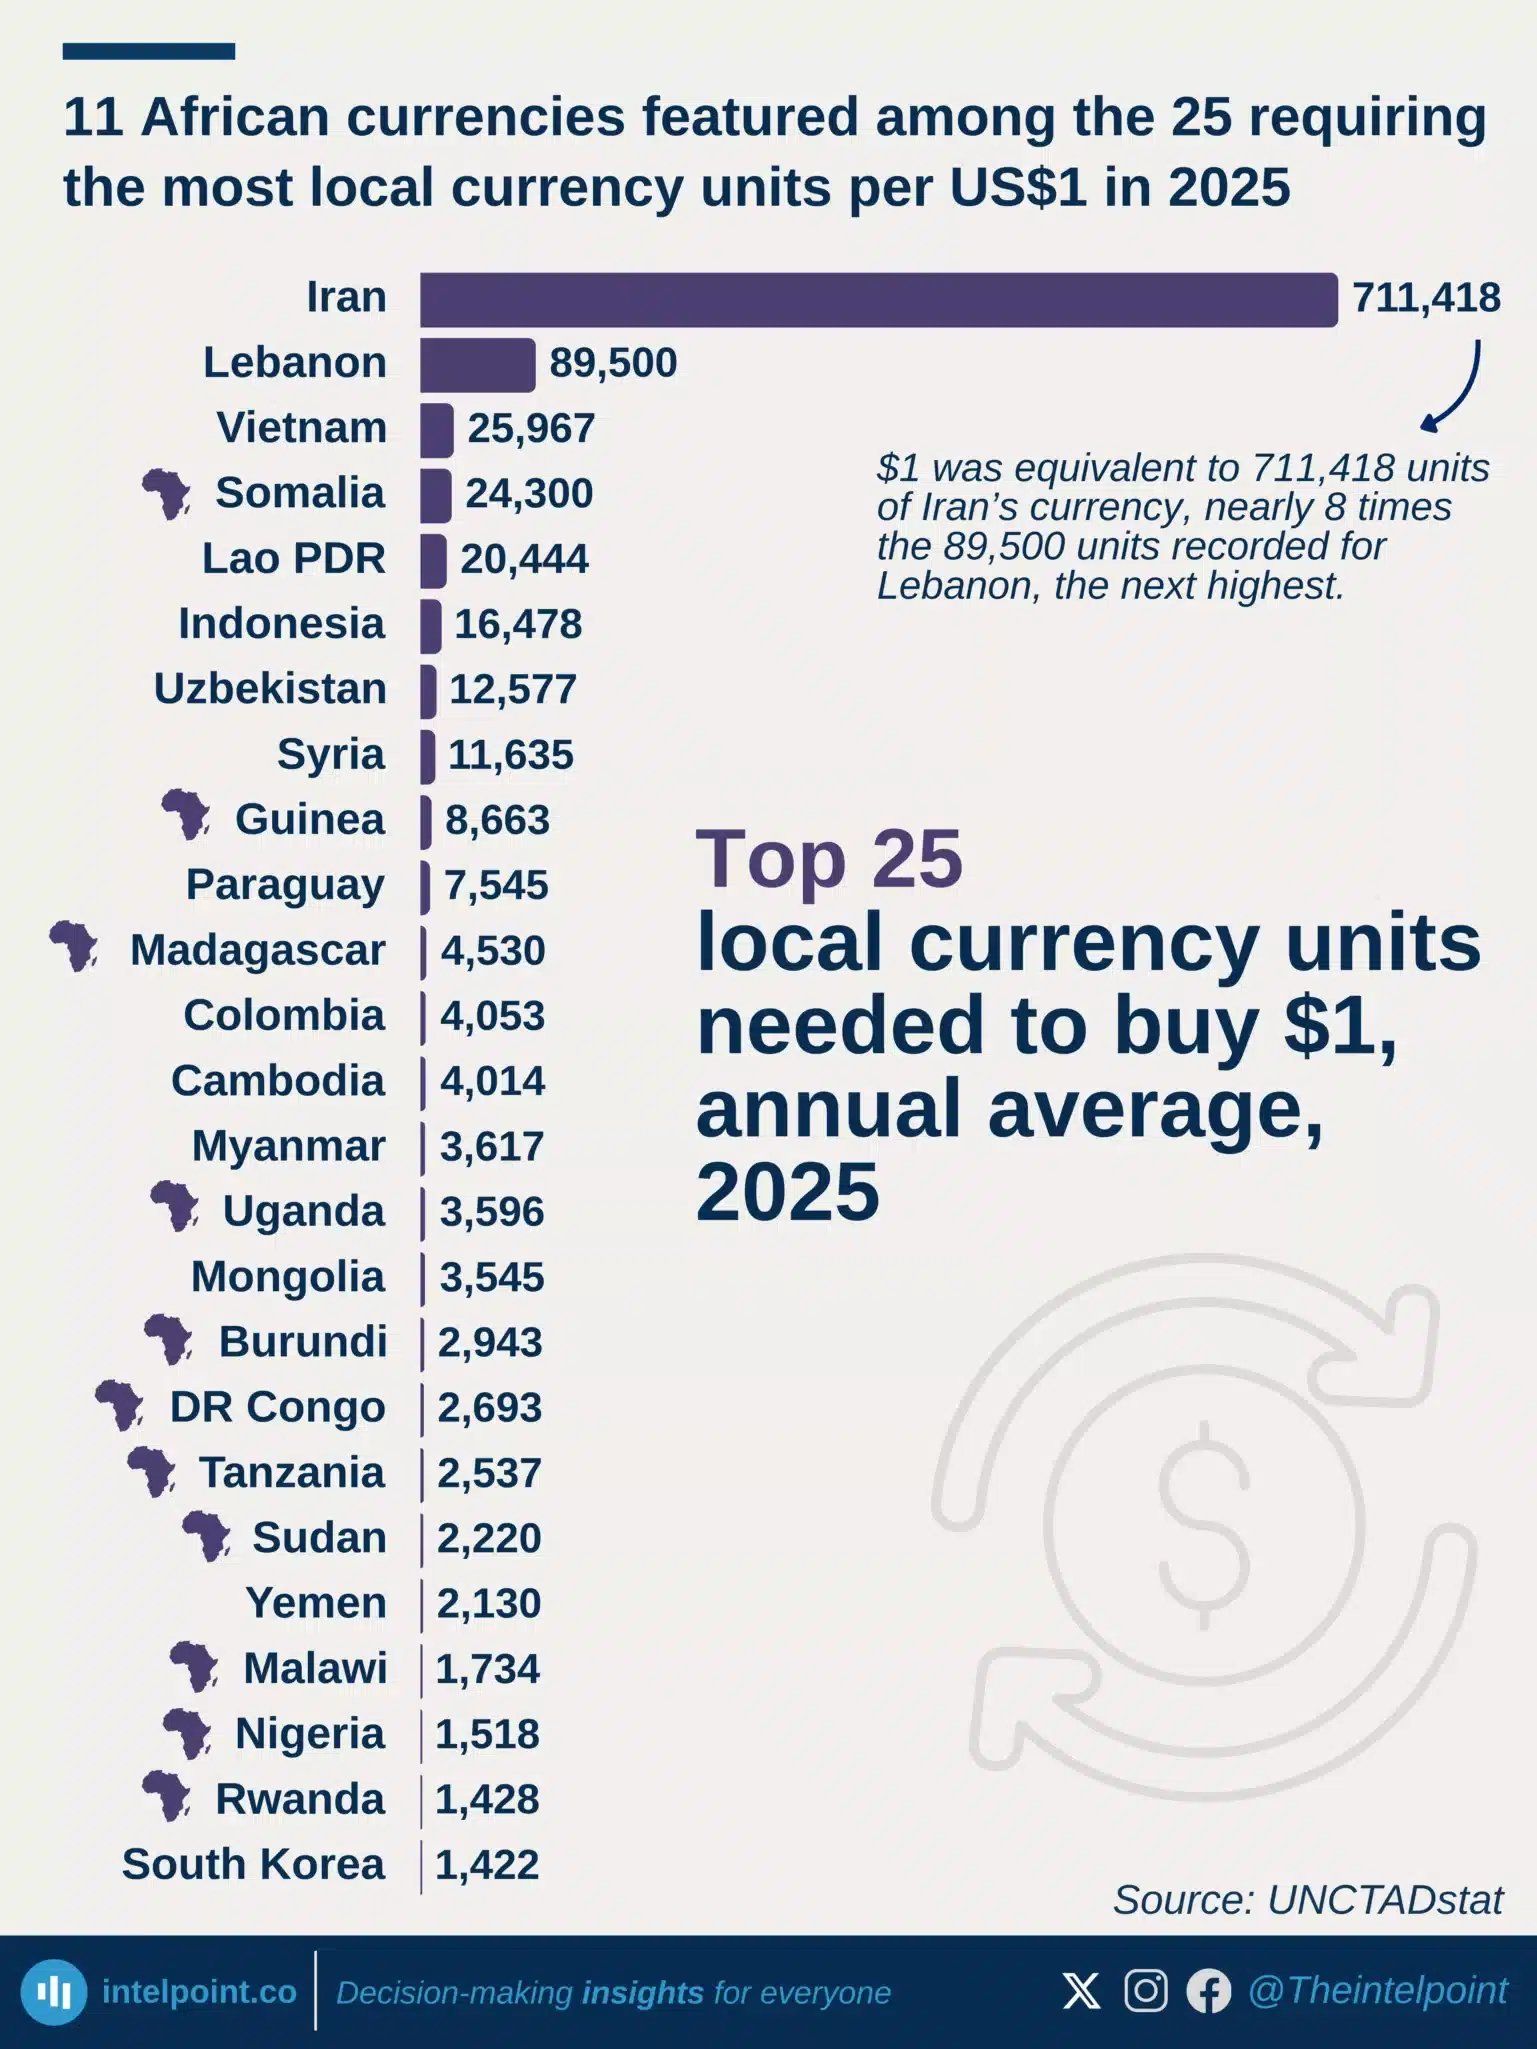
11 African currencies featured among the 25 requiring the most local currency units per US$1 in 2025
  • 11 African currencies featured among the 25 listed.
  • Somalia had the highest exchange rate among the African currencies highlighted, at 24,300 shillings per US$1.
  • Nigeria’s naira averaged ₦1,518 per US$1 in 2025.
  • 7 of the 11 African countries were in Eastern Africa, based on the UN M49 subregional classification.
  • Iran was the global outlier, averaging 711,418 rials per US$1, nearly eight times Lebanon’s 89,500.

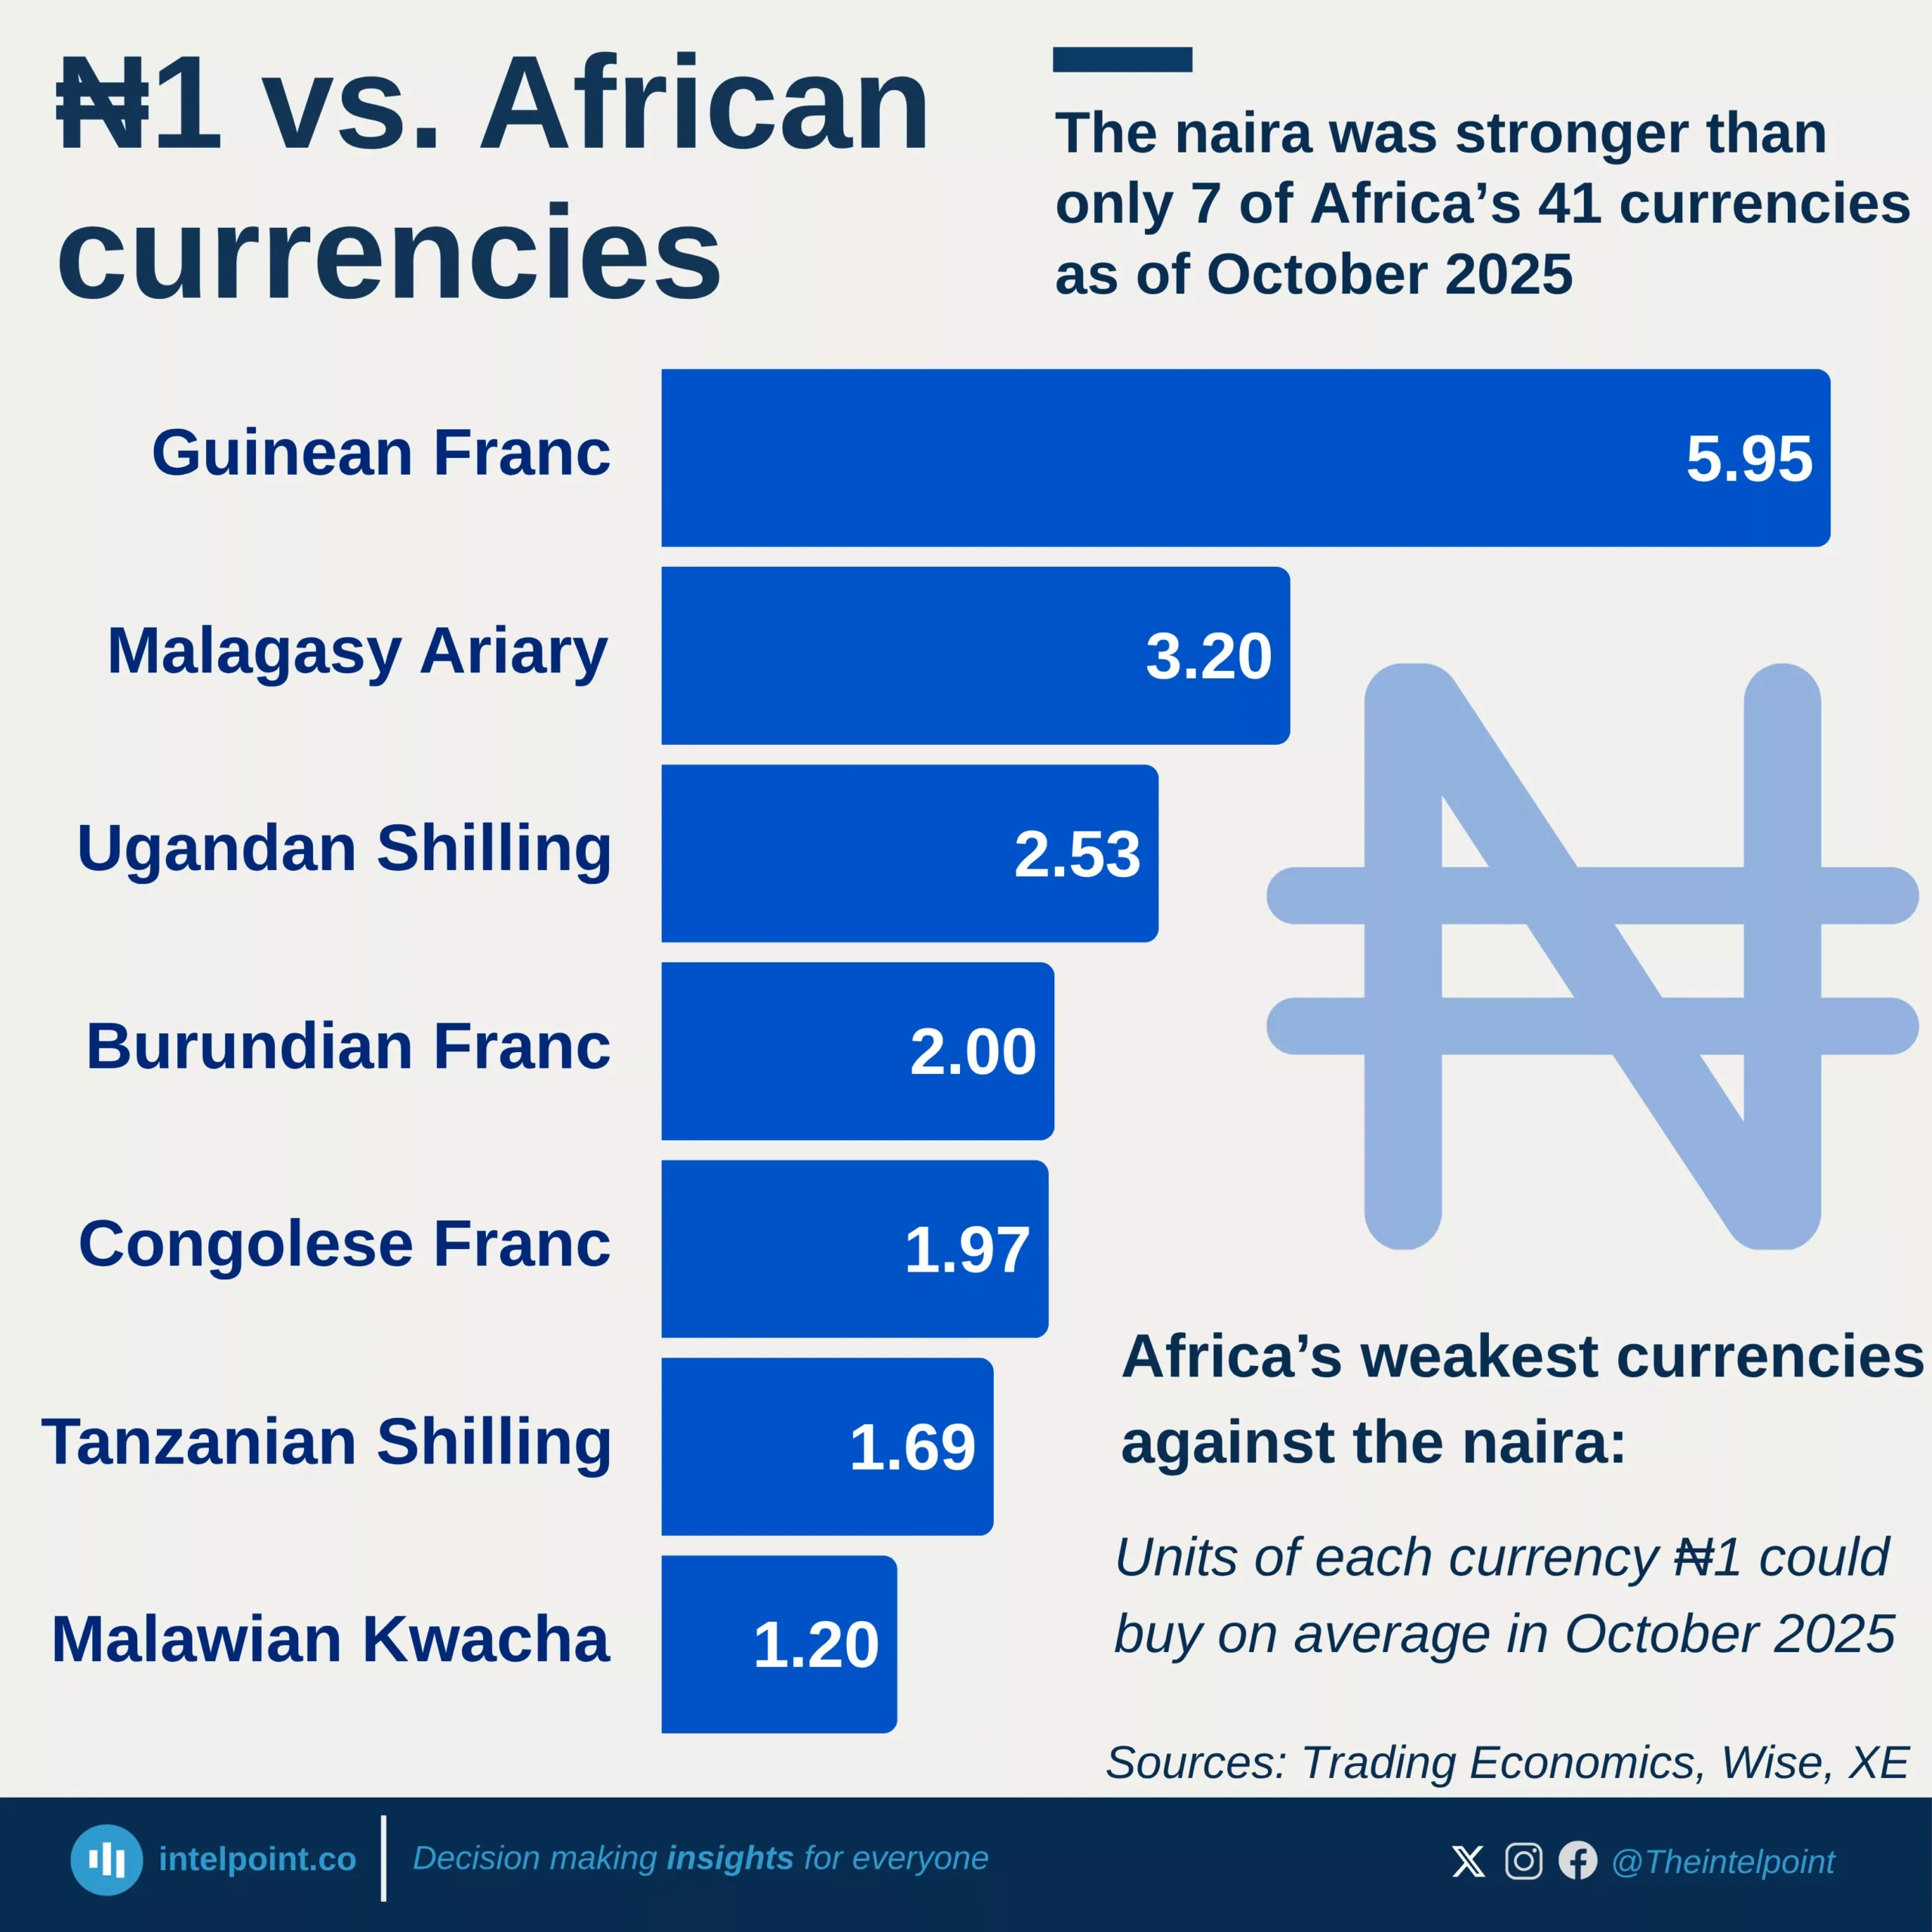
The naira was stronger than only 7 of Africa’s 41 currencies as of October 2025
  • The naira buys the most in countries like Guinea, Uganda, Burundi, and Malawi, where local currencies have lost value faster.
  • High inflation and unstable monetary systems have eroded the strength of several African currencies.
  • Most of the weakest currencies are in East and West Africa.
  •  The naira’s higher value in these countries does not mean it has fully recovered.

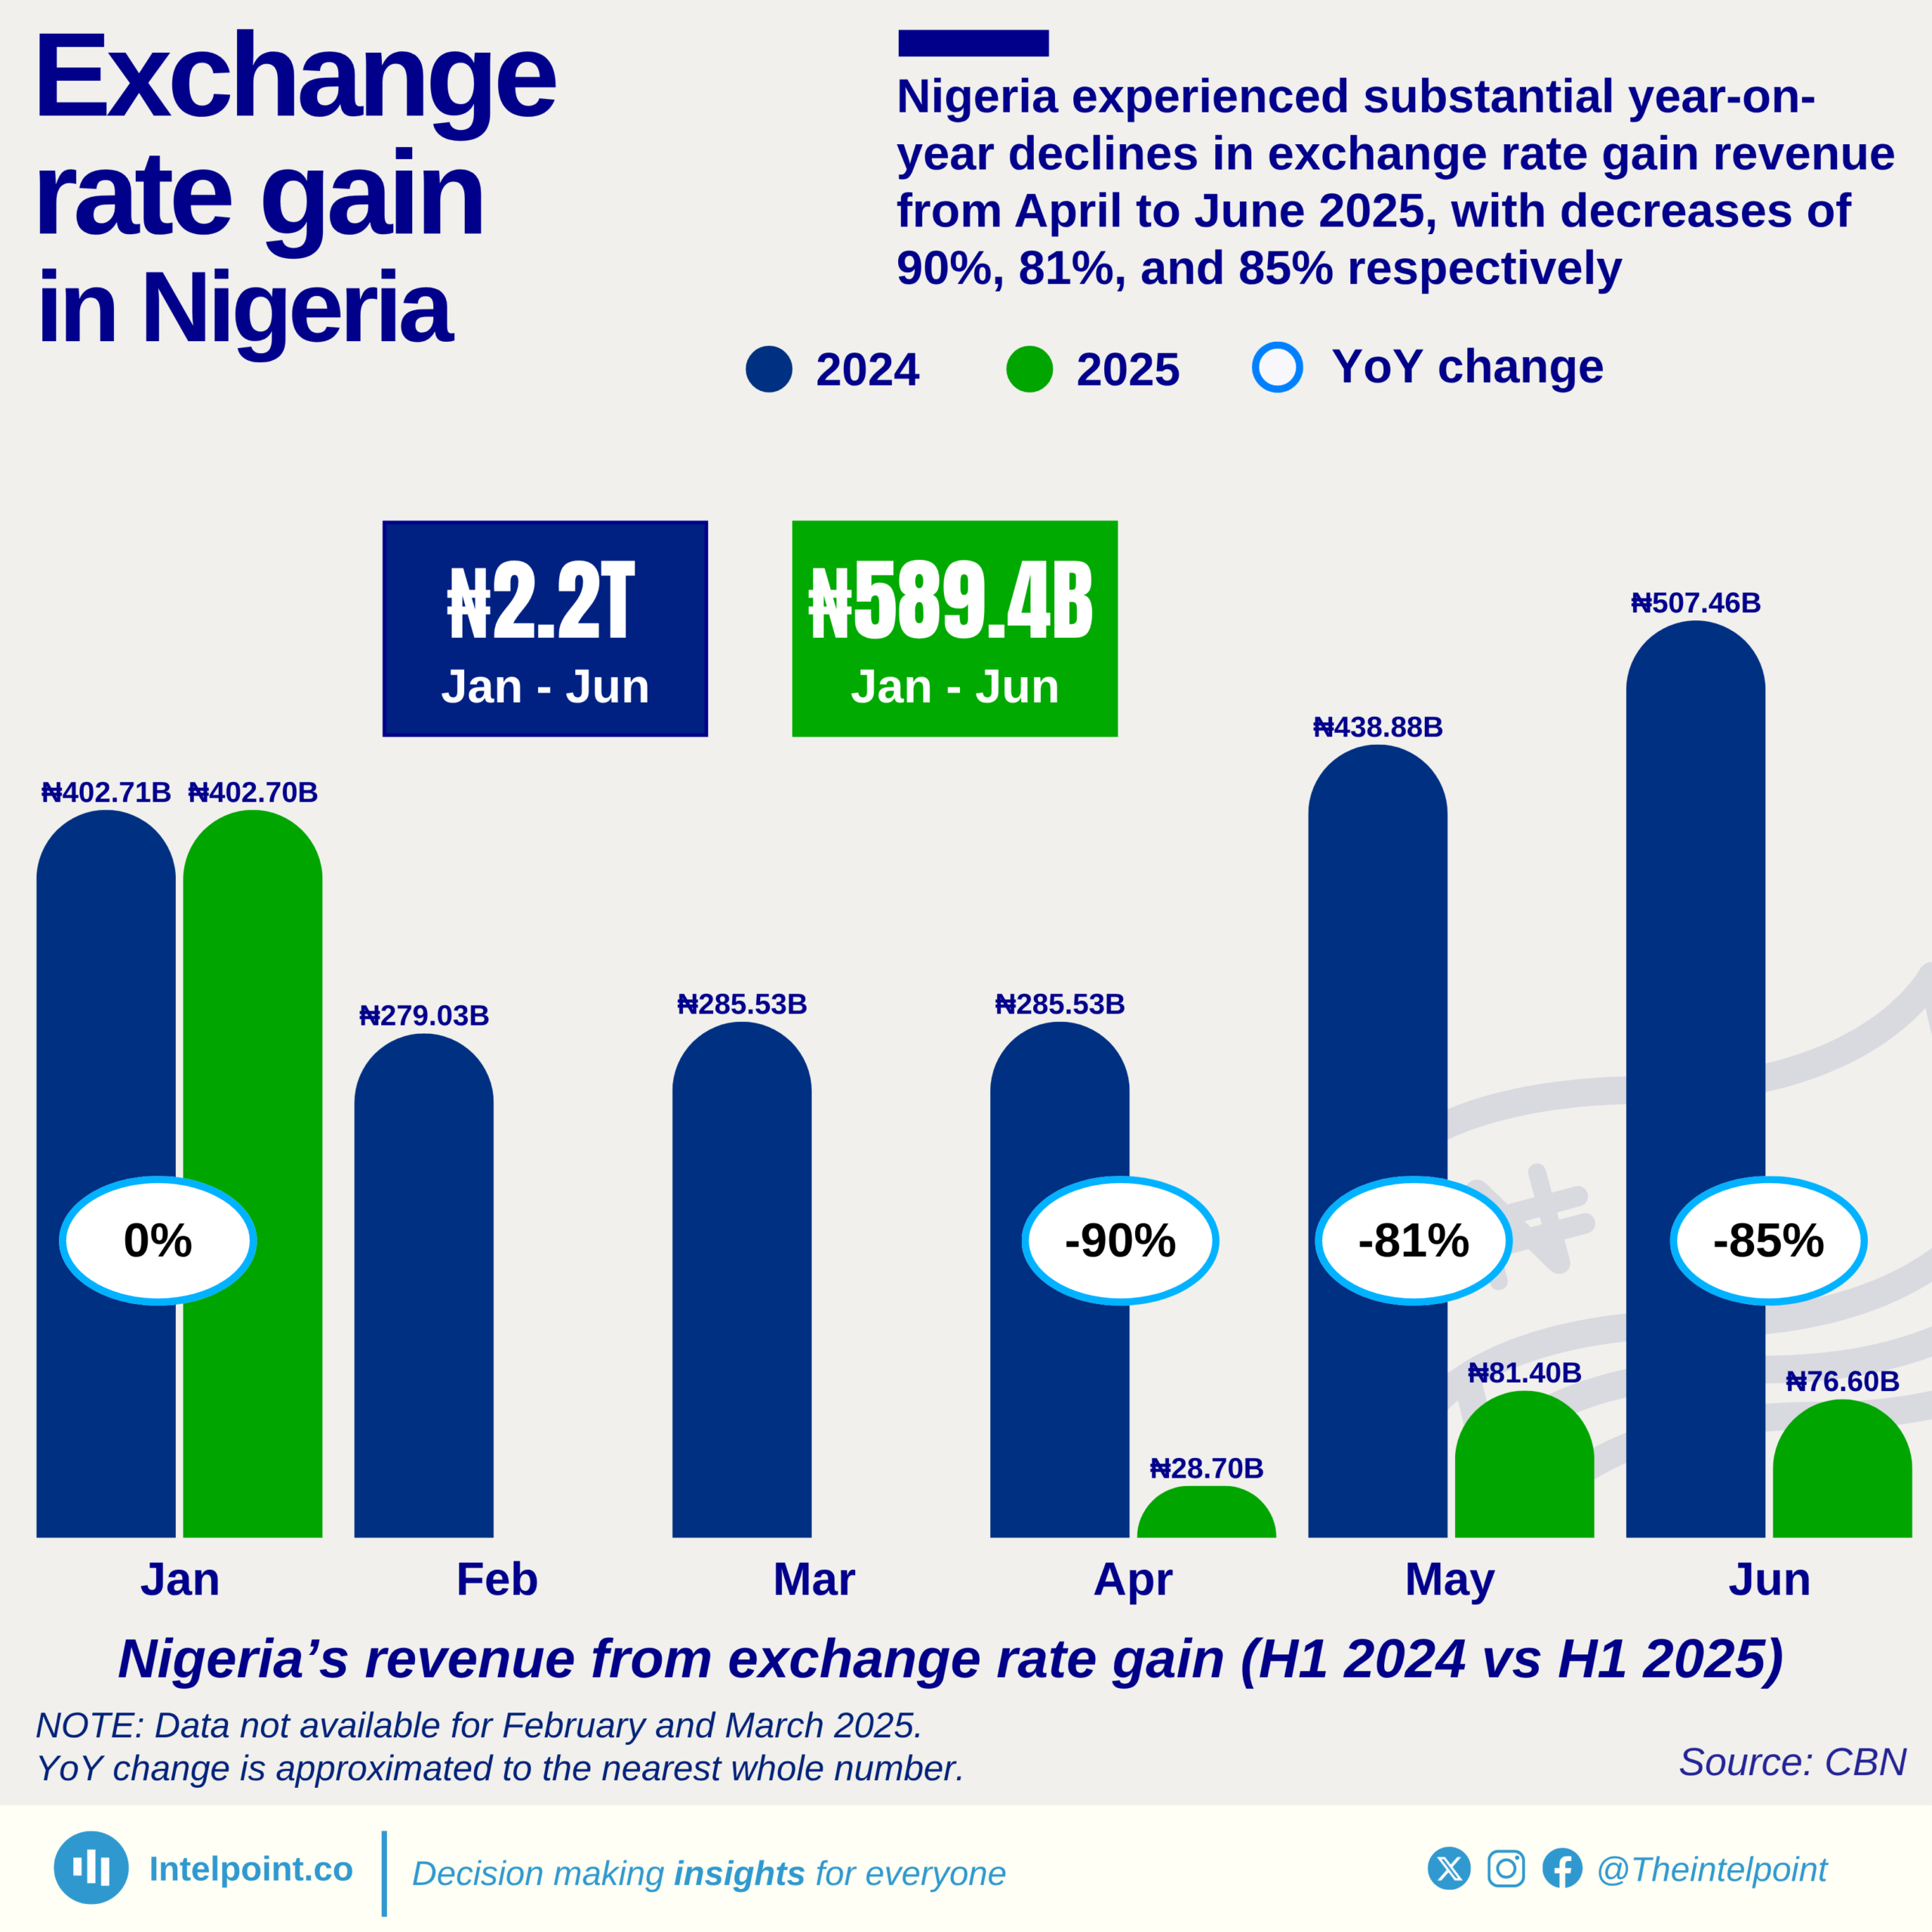
Nigeria experienced substantial year-on-year declines in exchange rate gain revenue from April to June 2025, with decreases of 90%, 81%, and 85% respectively
  • Nigeria’s exchange rate gain revenue dropped by 73.2% in H1 2025 compared to H1 2024.
  • In April 2025, exchange rate gain fell by 90% year-on-year from ₦285.5B to ₦28.7B.
  • May saw an 81% drop, with revenue declining from ₦438.9B in 2024 to ₦81.4B in 2025.
  • January 2025 was the only month with a stable figure, matching January 2024’s ₦402.7B.
  • Exchange rate gain revenue for February and March 2025 was unavailable, likely worsening the total.
  • The first half of 2025 generated only ₦589.4B in FX gains, compared to ₦2.2T in the same period in 2024.

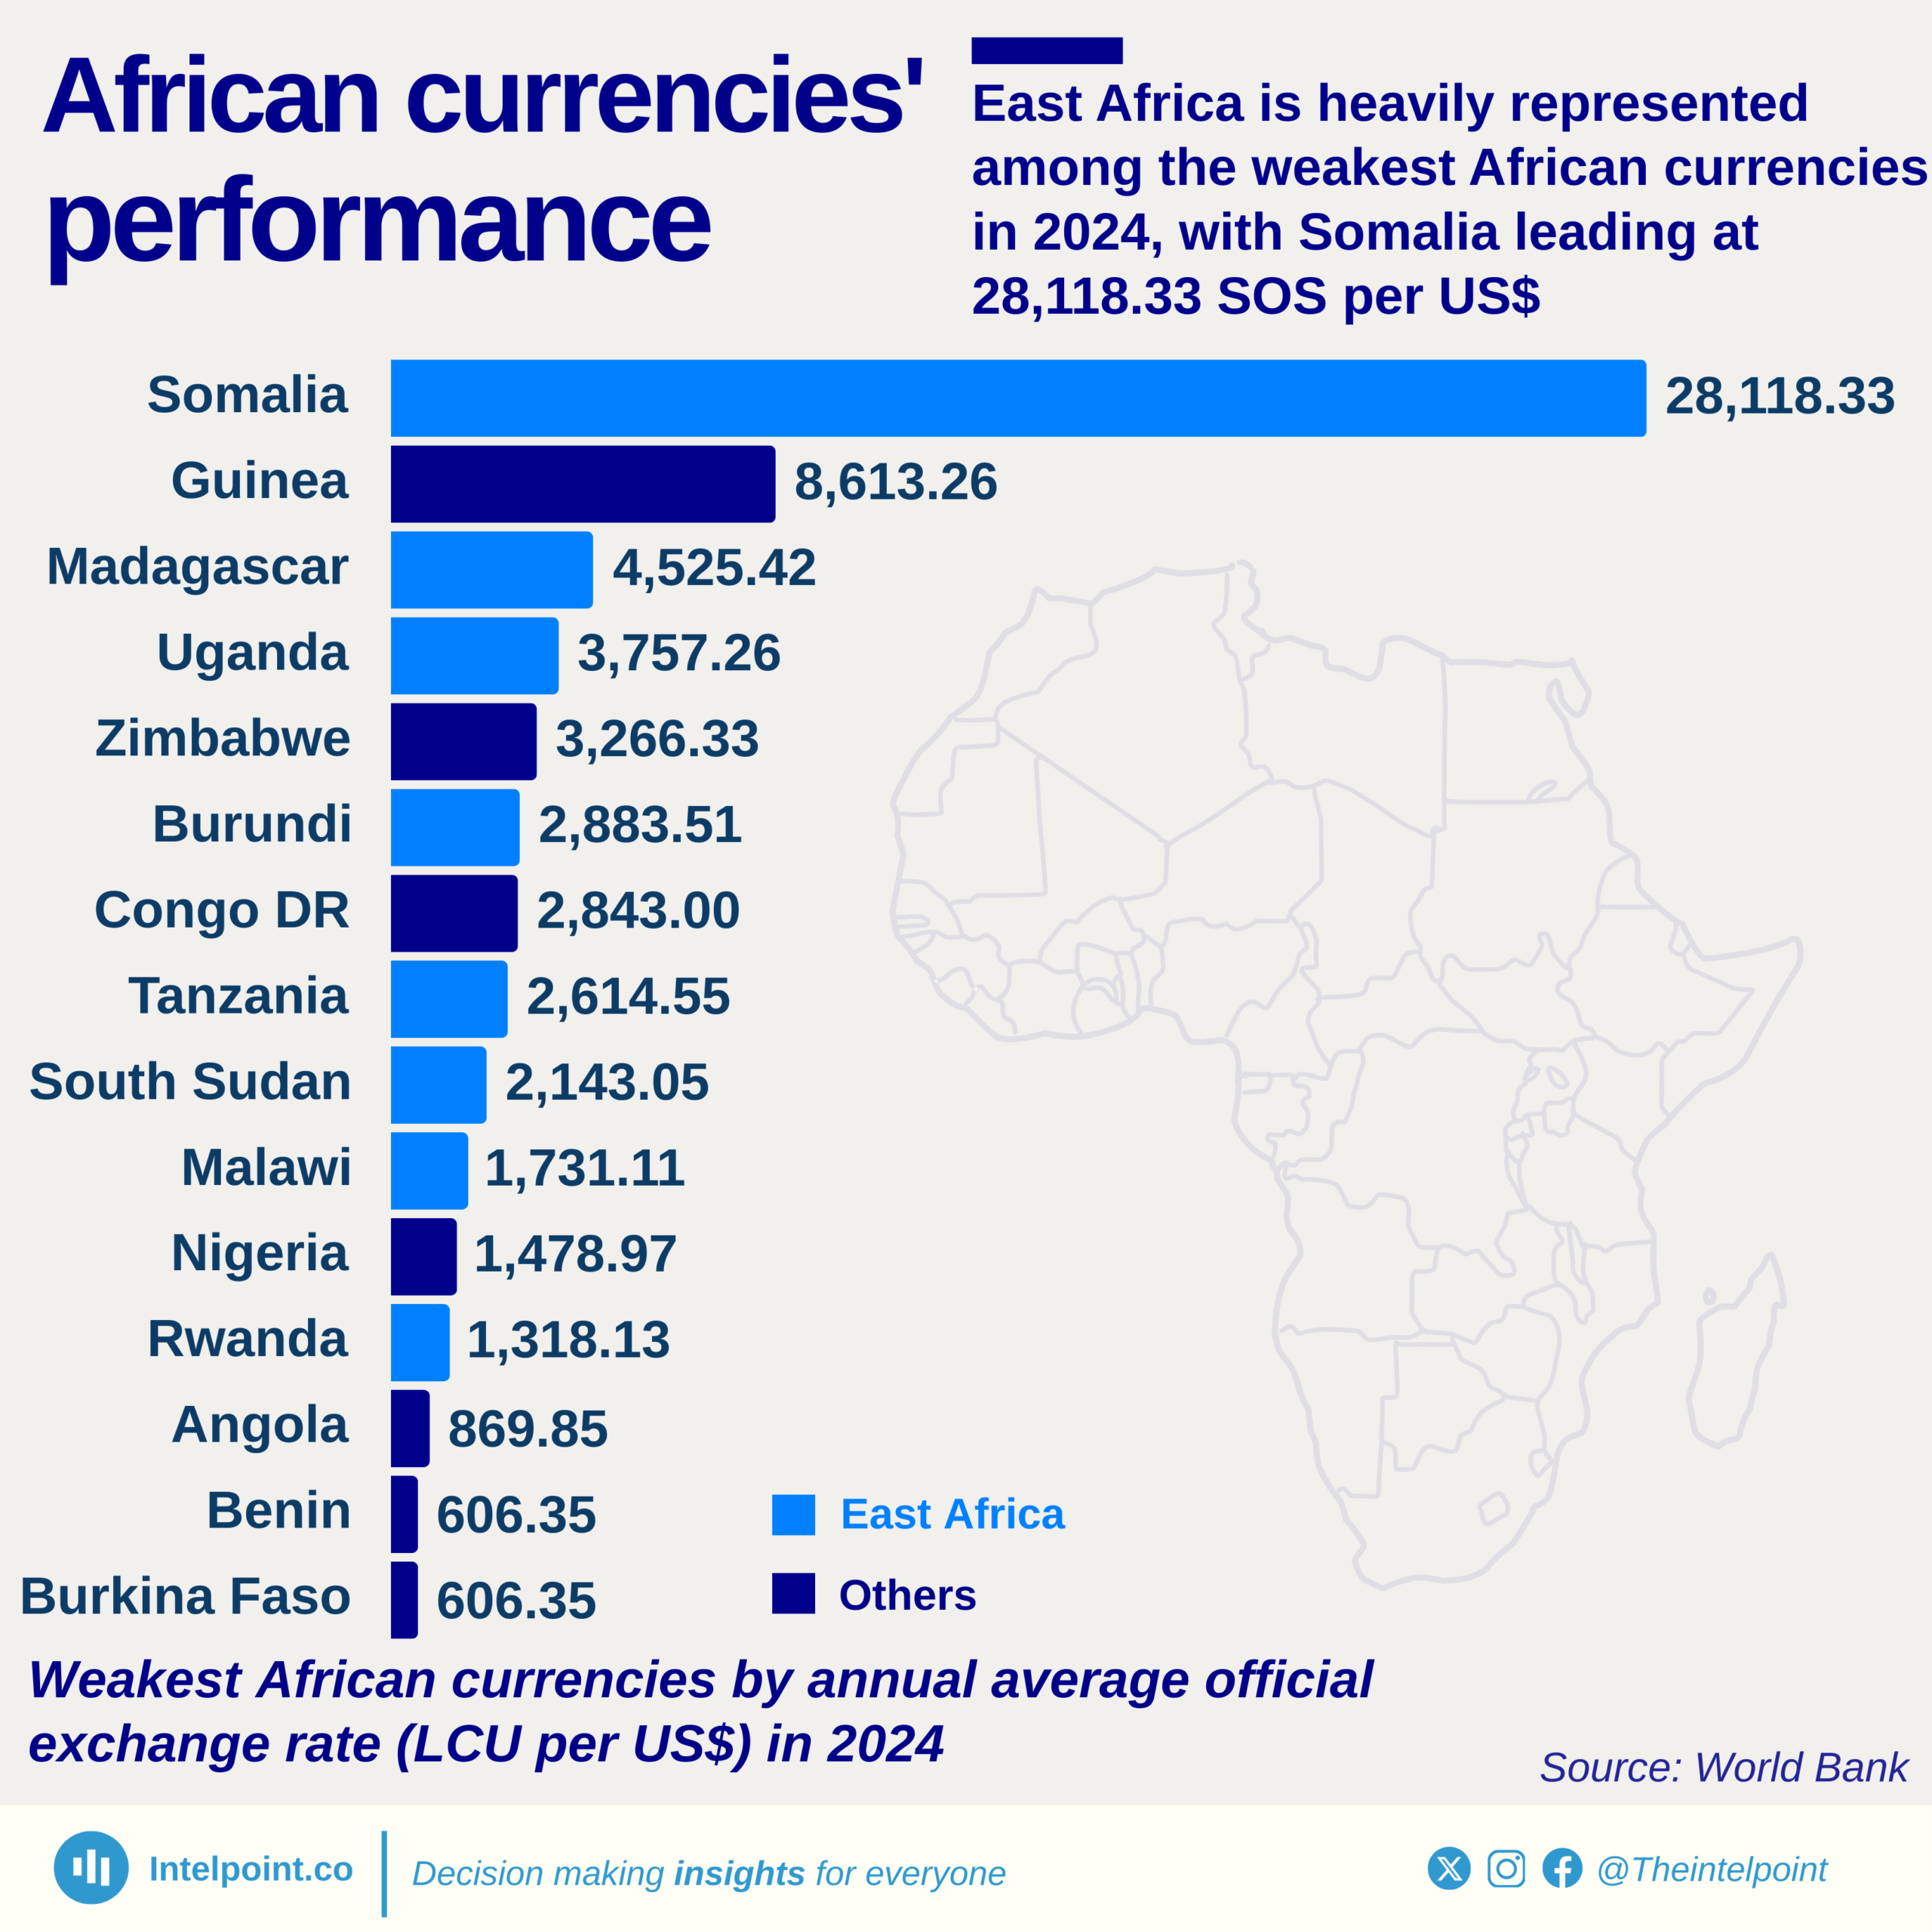
East Africa is heavily represented among the weakest African currencies in 2024, with Somalia leading at 28,118.33 SOS per US$
  • Eight East African nations made the list of the top 15 worst African currencies.
  • Somalia has the weakest African currency in 2024, with an exchange rate of 28,118.33 SOS per US$.
  • Guinea, with 8,613.26 GNF per US$, has the second weakest currency, but is still far behind Somalia.
  • Madagascar, Uganda, and Zimbabwe follow, each with exchange rates between 3,200 and 4,500 LCU per US$.
  • Nigeria’s currency traded at 1,478.97 Naira per US$, about 20 times stronger than Somalia's currency.
  • Despite economic turmoil, South Sudan’s currency remained below 2,200 SSP per US$, performing better than Somalia and Guinea.
  • The gap between Somalia and the rest of Africa’s currencies highlights extreme economic pressures unique to the Somali economy in 2024.

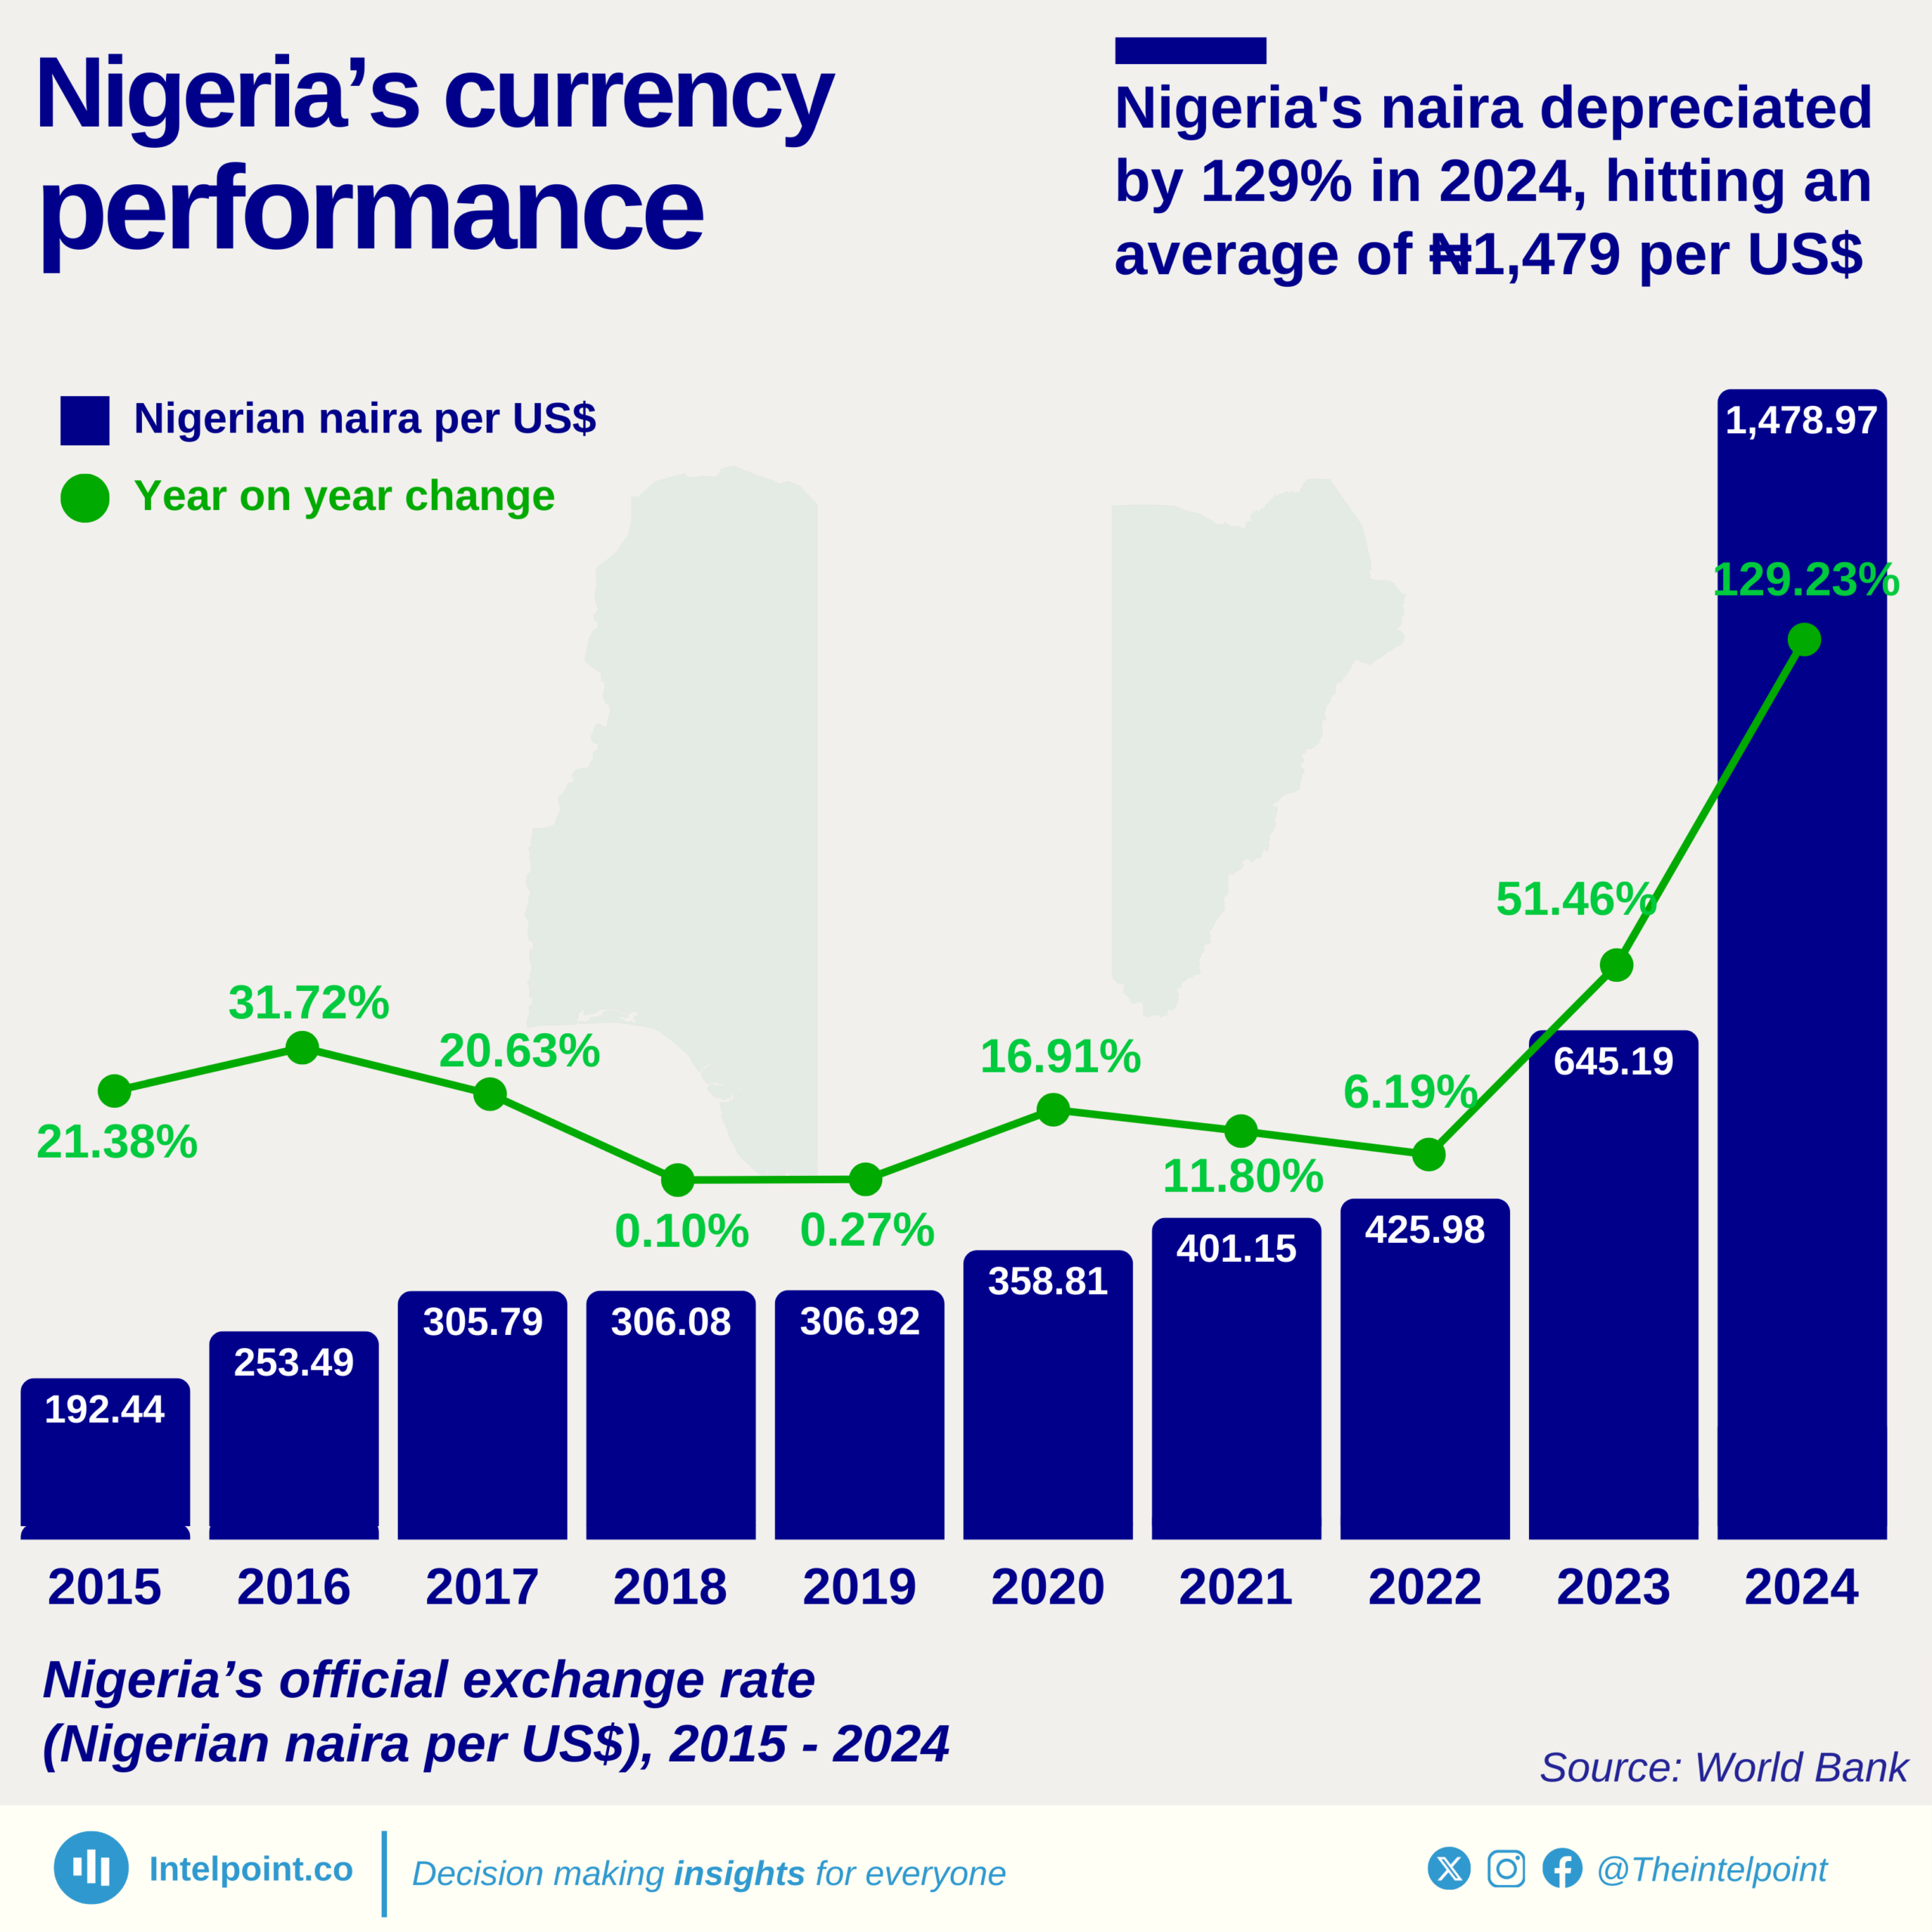
Nigeria's naira depreciated by 129% in 2024, hitting an average of 1,479 NGN per US$
  • The Nigerian naira depreciated by a record-breaking 129.23% in 2024, the highest drop in the last decade.
  • From 2015 to 2022, the naira's depreciation was relatively controlled, rarely exceeding 20% year-on-year.
  • The exchange rate remained nearly flat from 2017 to 2019, showing signs of stability.
  • In 2023, the naira lost over half its value (51.46%), marking the beginning of the current volatility wave.
  • The exchange rate crossed the ₦1,000/$ threshold in 2024 for the first time in history.

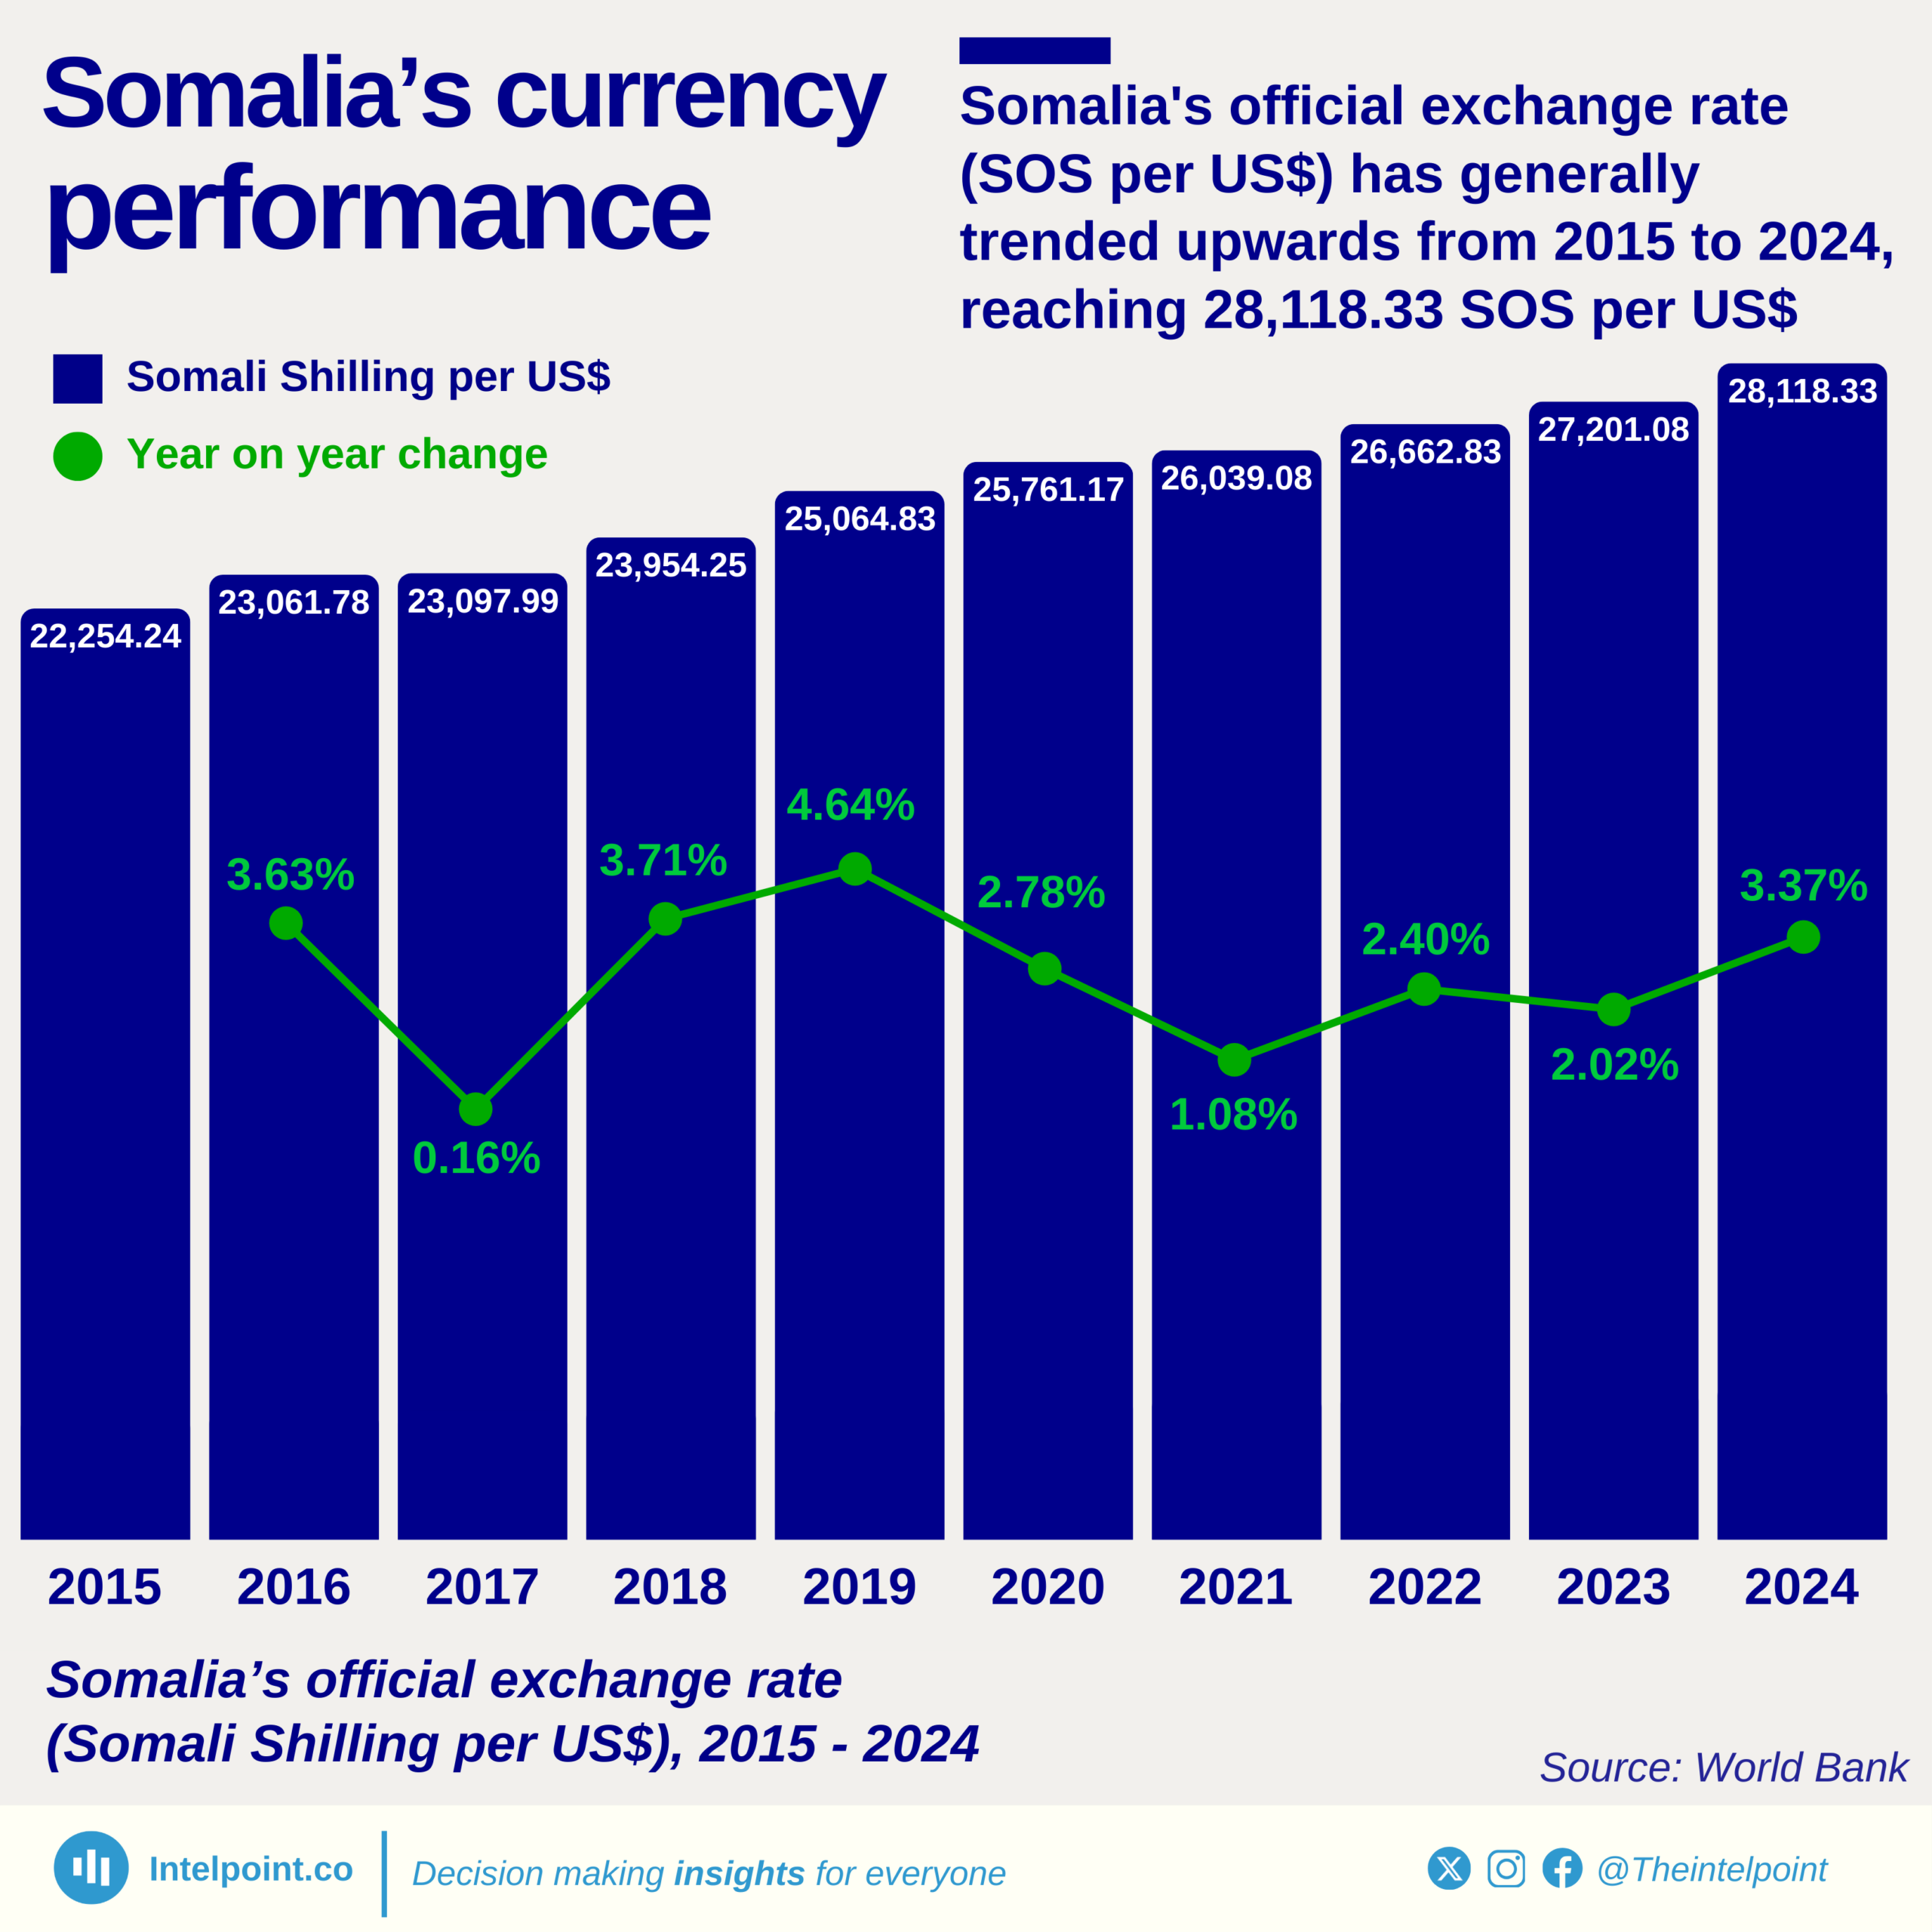
Somalia's official exchange rate (SOS per US$) has generally trended upwards from 2015 to 2024, reaching 28,118.33 SOS per US$
  • Somalia’s currency has depreciated by 26.4% between 2015 and 2024.
  • The sharpest yearly depreciation was in 2019, at 4.64%.
  • From 2020 to 2021, the SOS saw its smallest year-on-year shift at 1.08%.
  • Despite fluctuations, every year from 2015 to 2024 recorded a net increase in SOS per US$.
  • 2017 recorded near-stable currency performance with just a 0.16% change from the previous year.

POPULAR TOPICS
SIGN UP TO OUR NEWSLETTER
Get periodic updates about the African startup space, access to our reports, among others.
Subscribe Here
Subscription Form

A product of Techpoint Africa. All rights reserved