Bite-sized Insights about
 
Providing you with data-based insights about things happening around you.
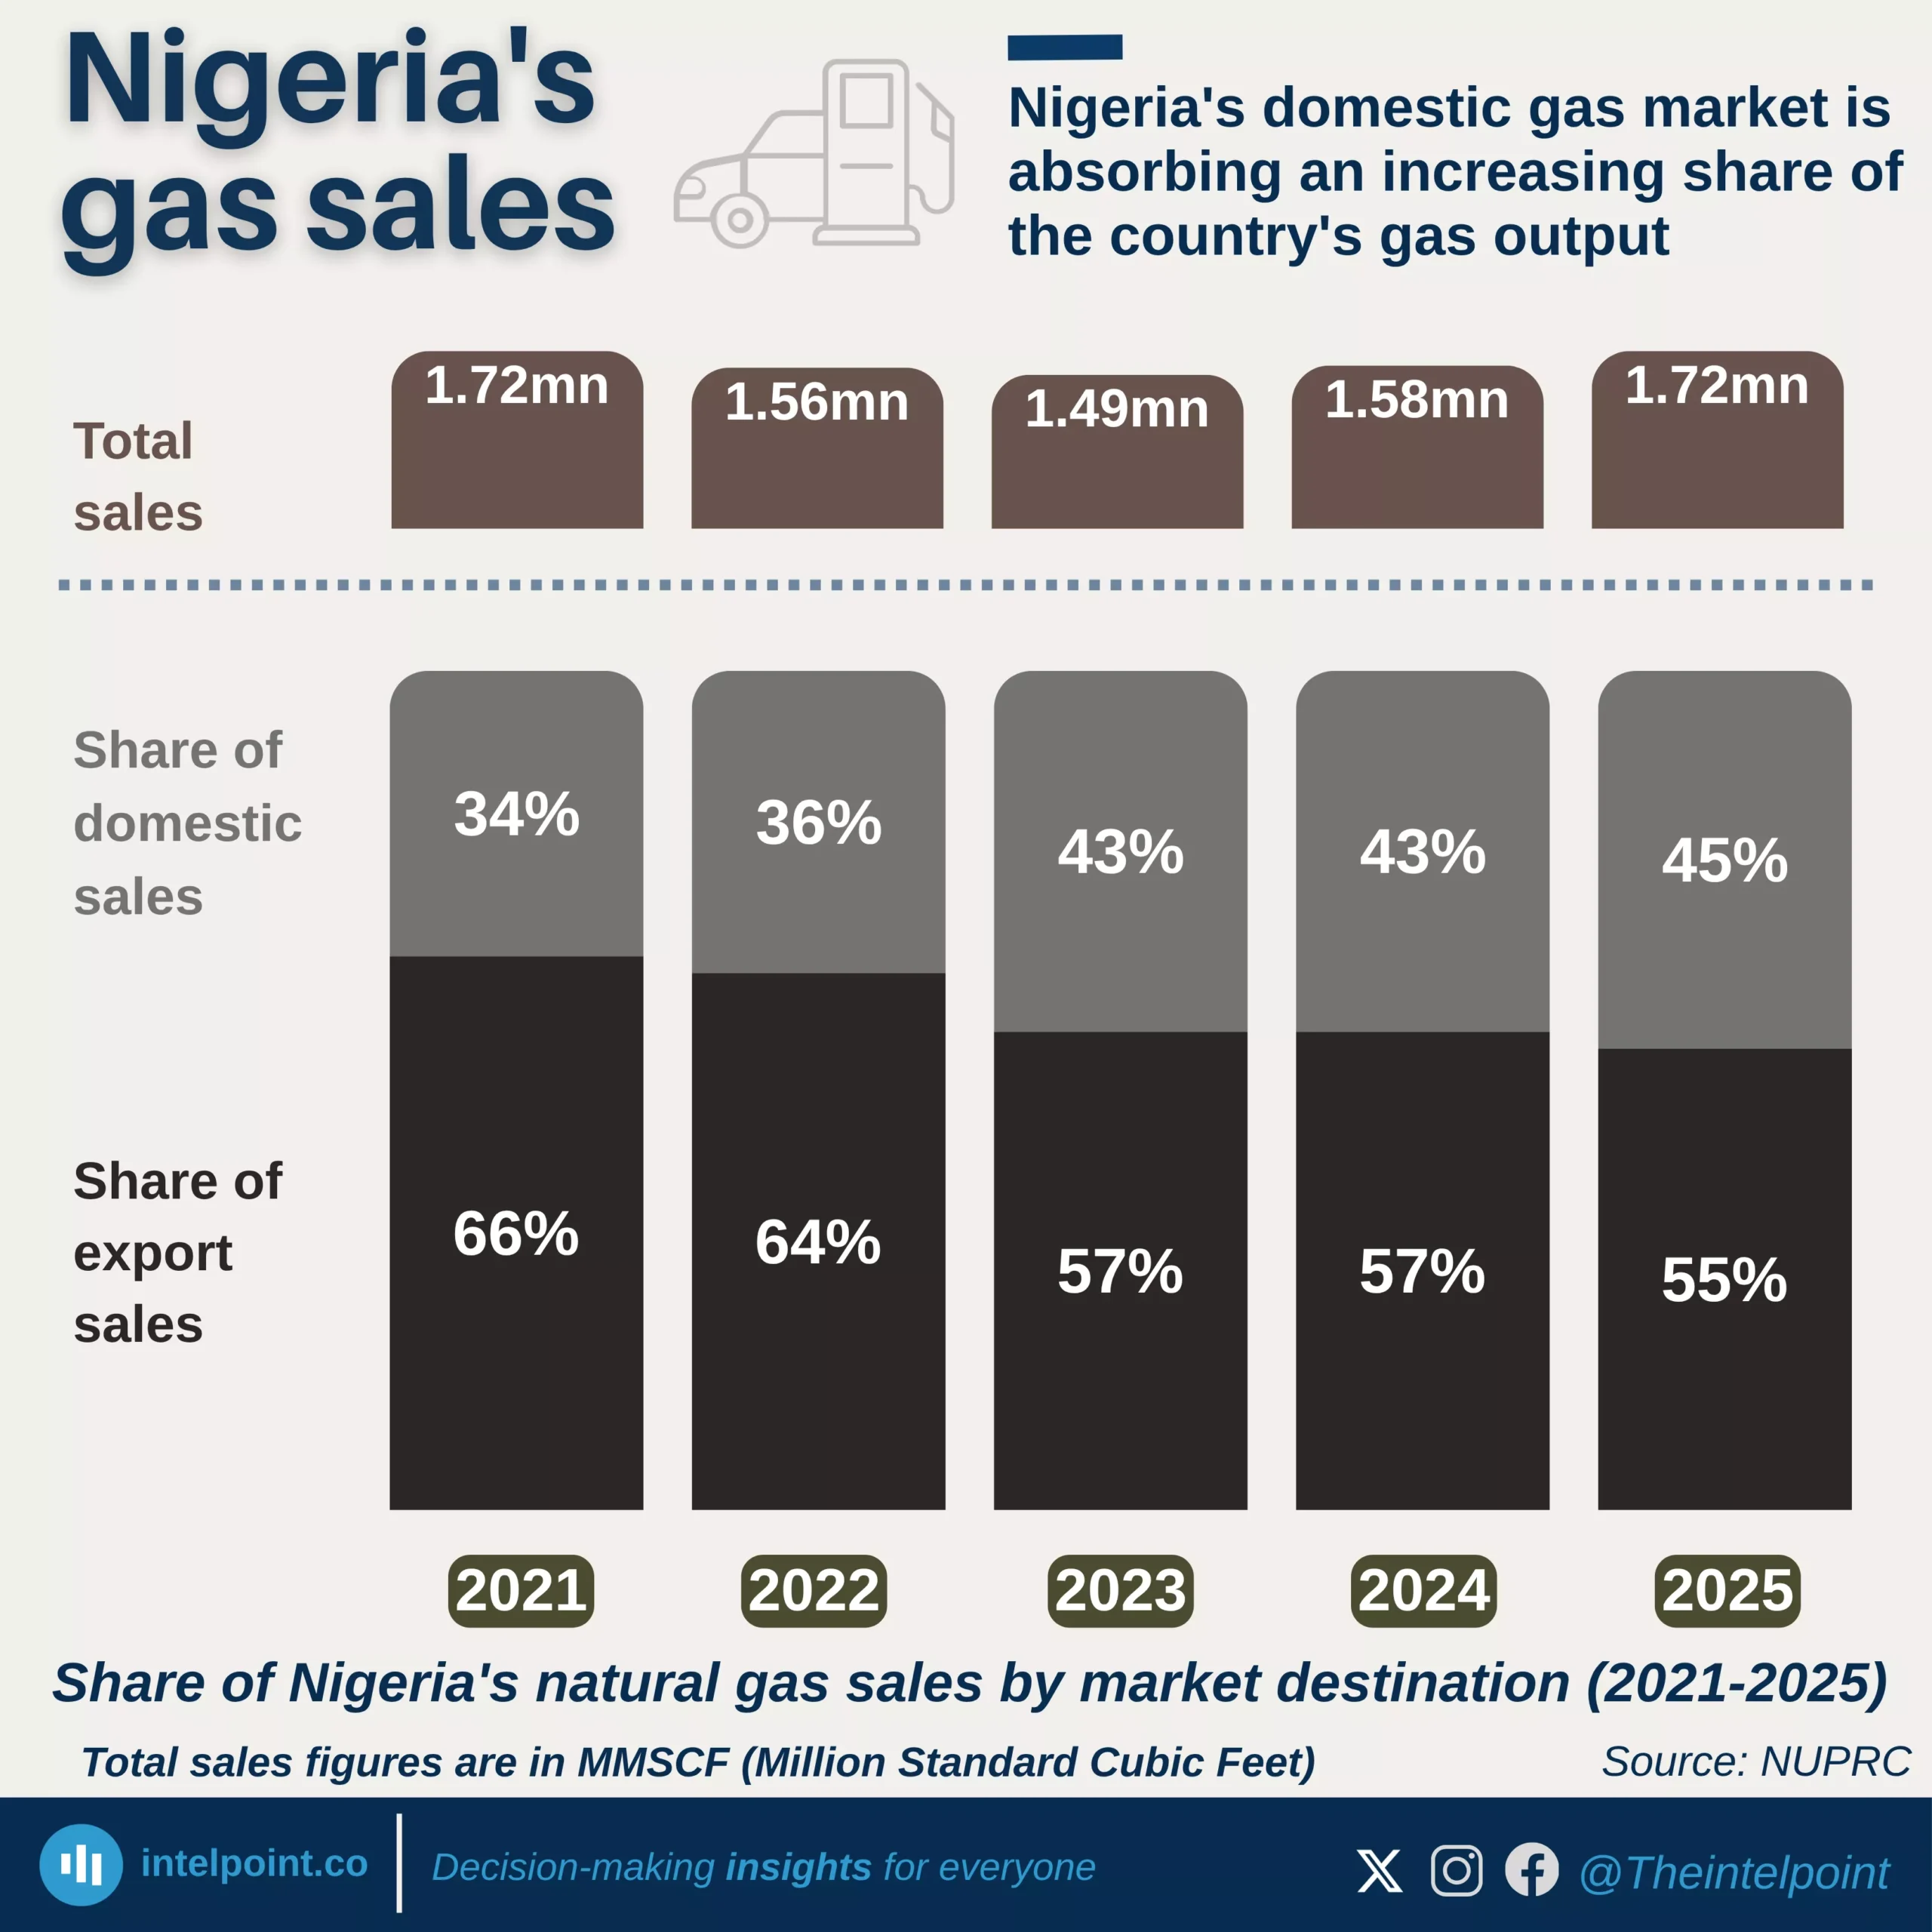
Nigeria's domestic gas market is absorbing an increasing share of the country's gas output
  • Domestic share rose steadily from 34% in 2021 to 45% in 2025, gaining eleven percentage points in five years.
  • Export share fell from 66% to 55%, losing ground every year without a single recovery.
  • 2023 was the sharpest single-year shift; domestic share jumped seven points, from 36% to 43%.
  • The gap between export and domestic share has narrowed from 32 to just 10 points.

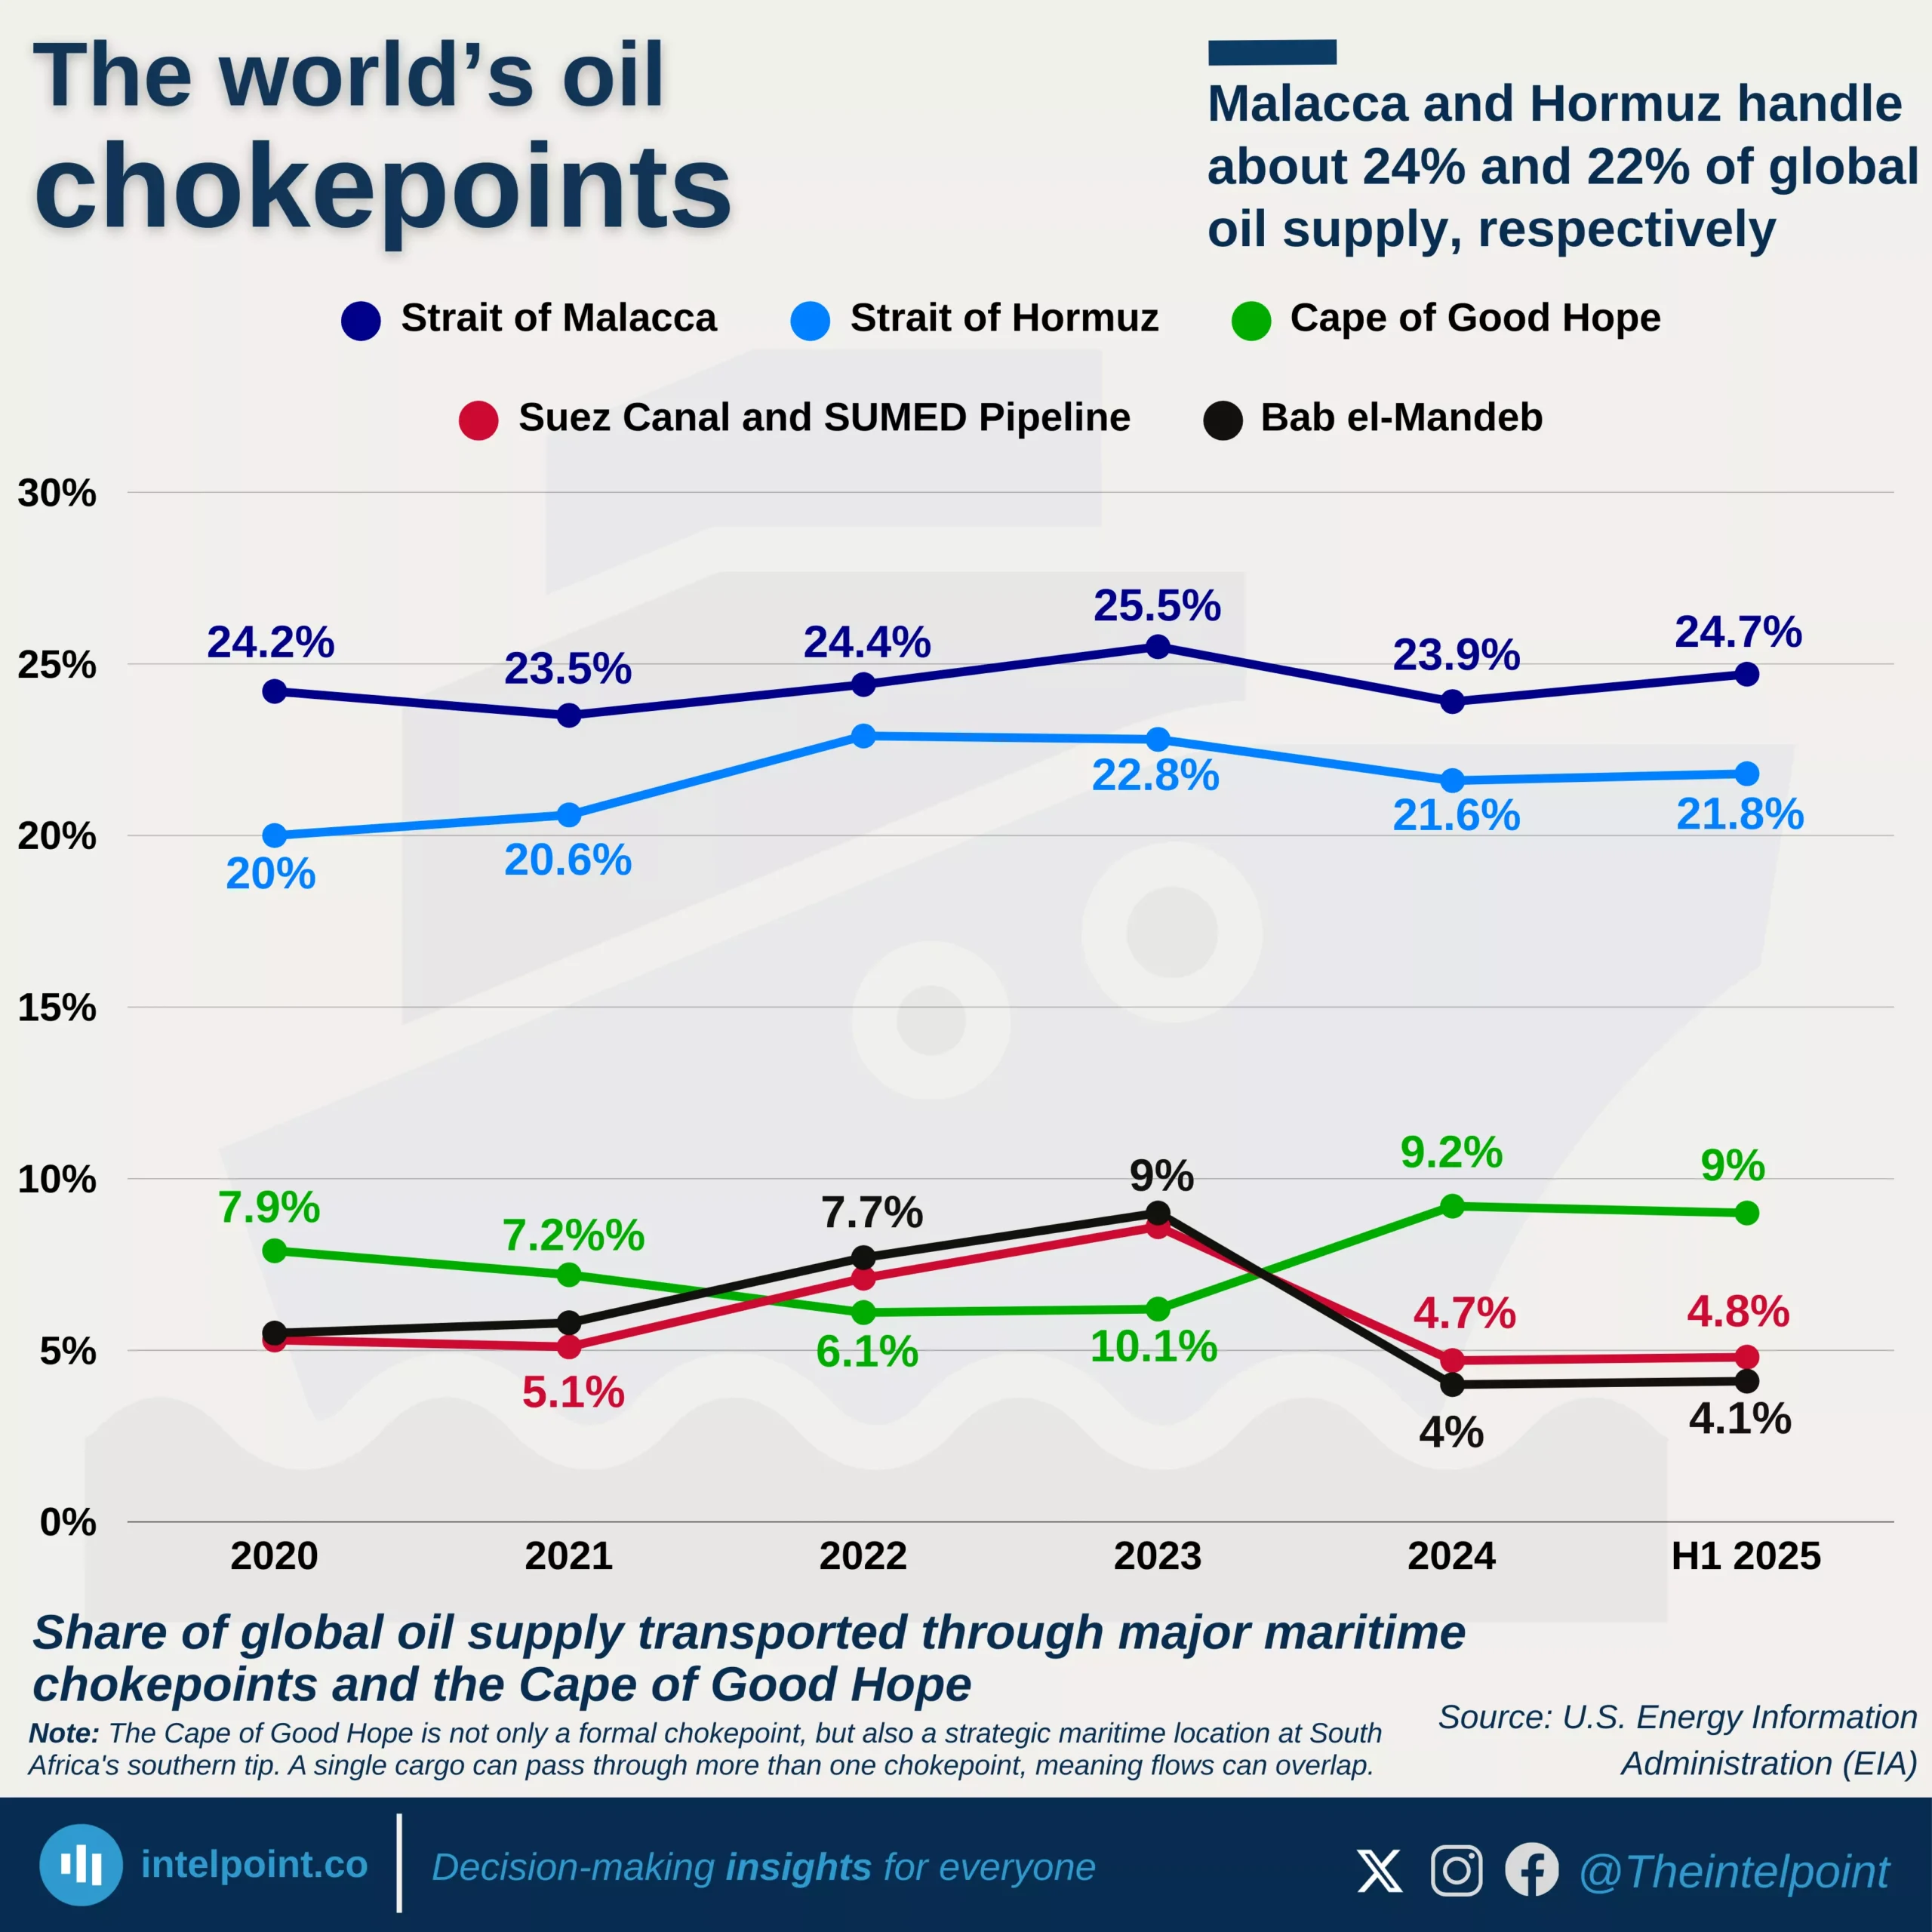
Malacca and Hormuz handle about 24% and 22% of global oil supply, respectively
  • The Strait of Malacca is the world’s most important oil chokepoint, carrying about 24–25% of global oil supply in recent years.
  • The Strait of Hormuz moves around 20–23% of global oil supply, making it the second-largest energy transit chokepoint.
  • The Cape of Good Hope carries about 9–10% of global oil flows, and its share tends to increase when other chokepoints face disruptions.
  • The Bab el-Mandeb saw a sharp drop in oil flow share from about 9% in 2023 to around 4% in 2024, reflecting security concerns affecting shipping in the Red Sea corridor.
  • Oil transported through the Suez Canal and the SUMED pipeline system dropped significantly after 2023, falling from about 8.6% to below 5%, showing how quickly routes shift during geopolitical tensions.
  • The Strait of Malacca’s share has remained consistently high and stable, indicating its structural importance to Asian energy demand.
  • Alternative routes like the Cape of Good Hope in South Africa are longer but strategically crucial, especially when Middle Eastern chokepoints become unstable.

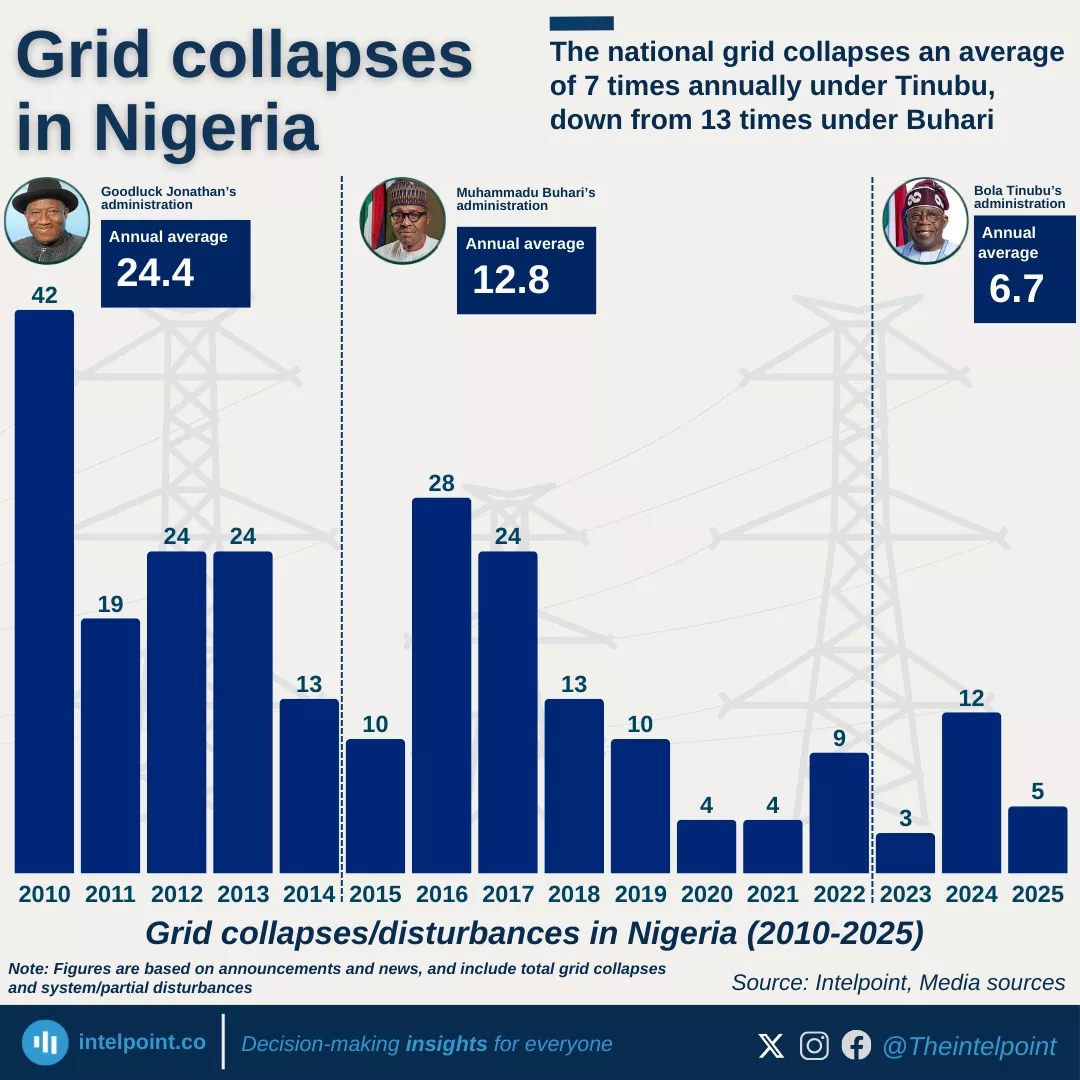
The national grid collapses an average of 7 times annually under Tinubu, down from 13 times under Buhari
  • The highest number of grid collapses in the past 16 years occurred in 2010, with 42 incidents recorded.
  • During Goodluck Jonathan’s administration, Nigeria’s grid collapsed an average of 24.4 times a year, the highest among the three administrations.
  • Under Muhammadu Buhari, the annual average dropped to 12.8 collapses per year, indicating improved grid stability compared to earlier years.
  • Under Bola Ahmed Tinubu, the average has fallen further to about 6.7 collapses annually.
  • 2016 recorded the highest number of collapses during the Buhari administration, with 28 incidents.
  • The most stable years in the dataset were 2020 and 2021, with only four collapses each.

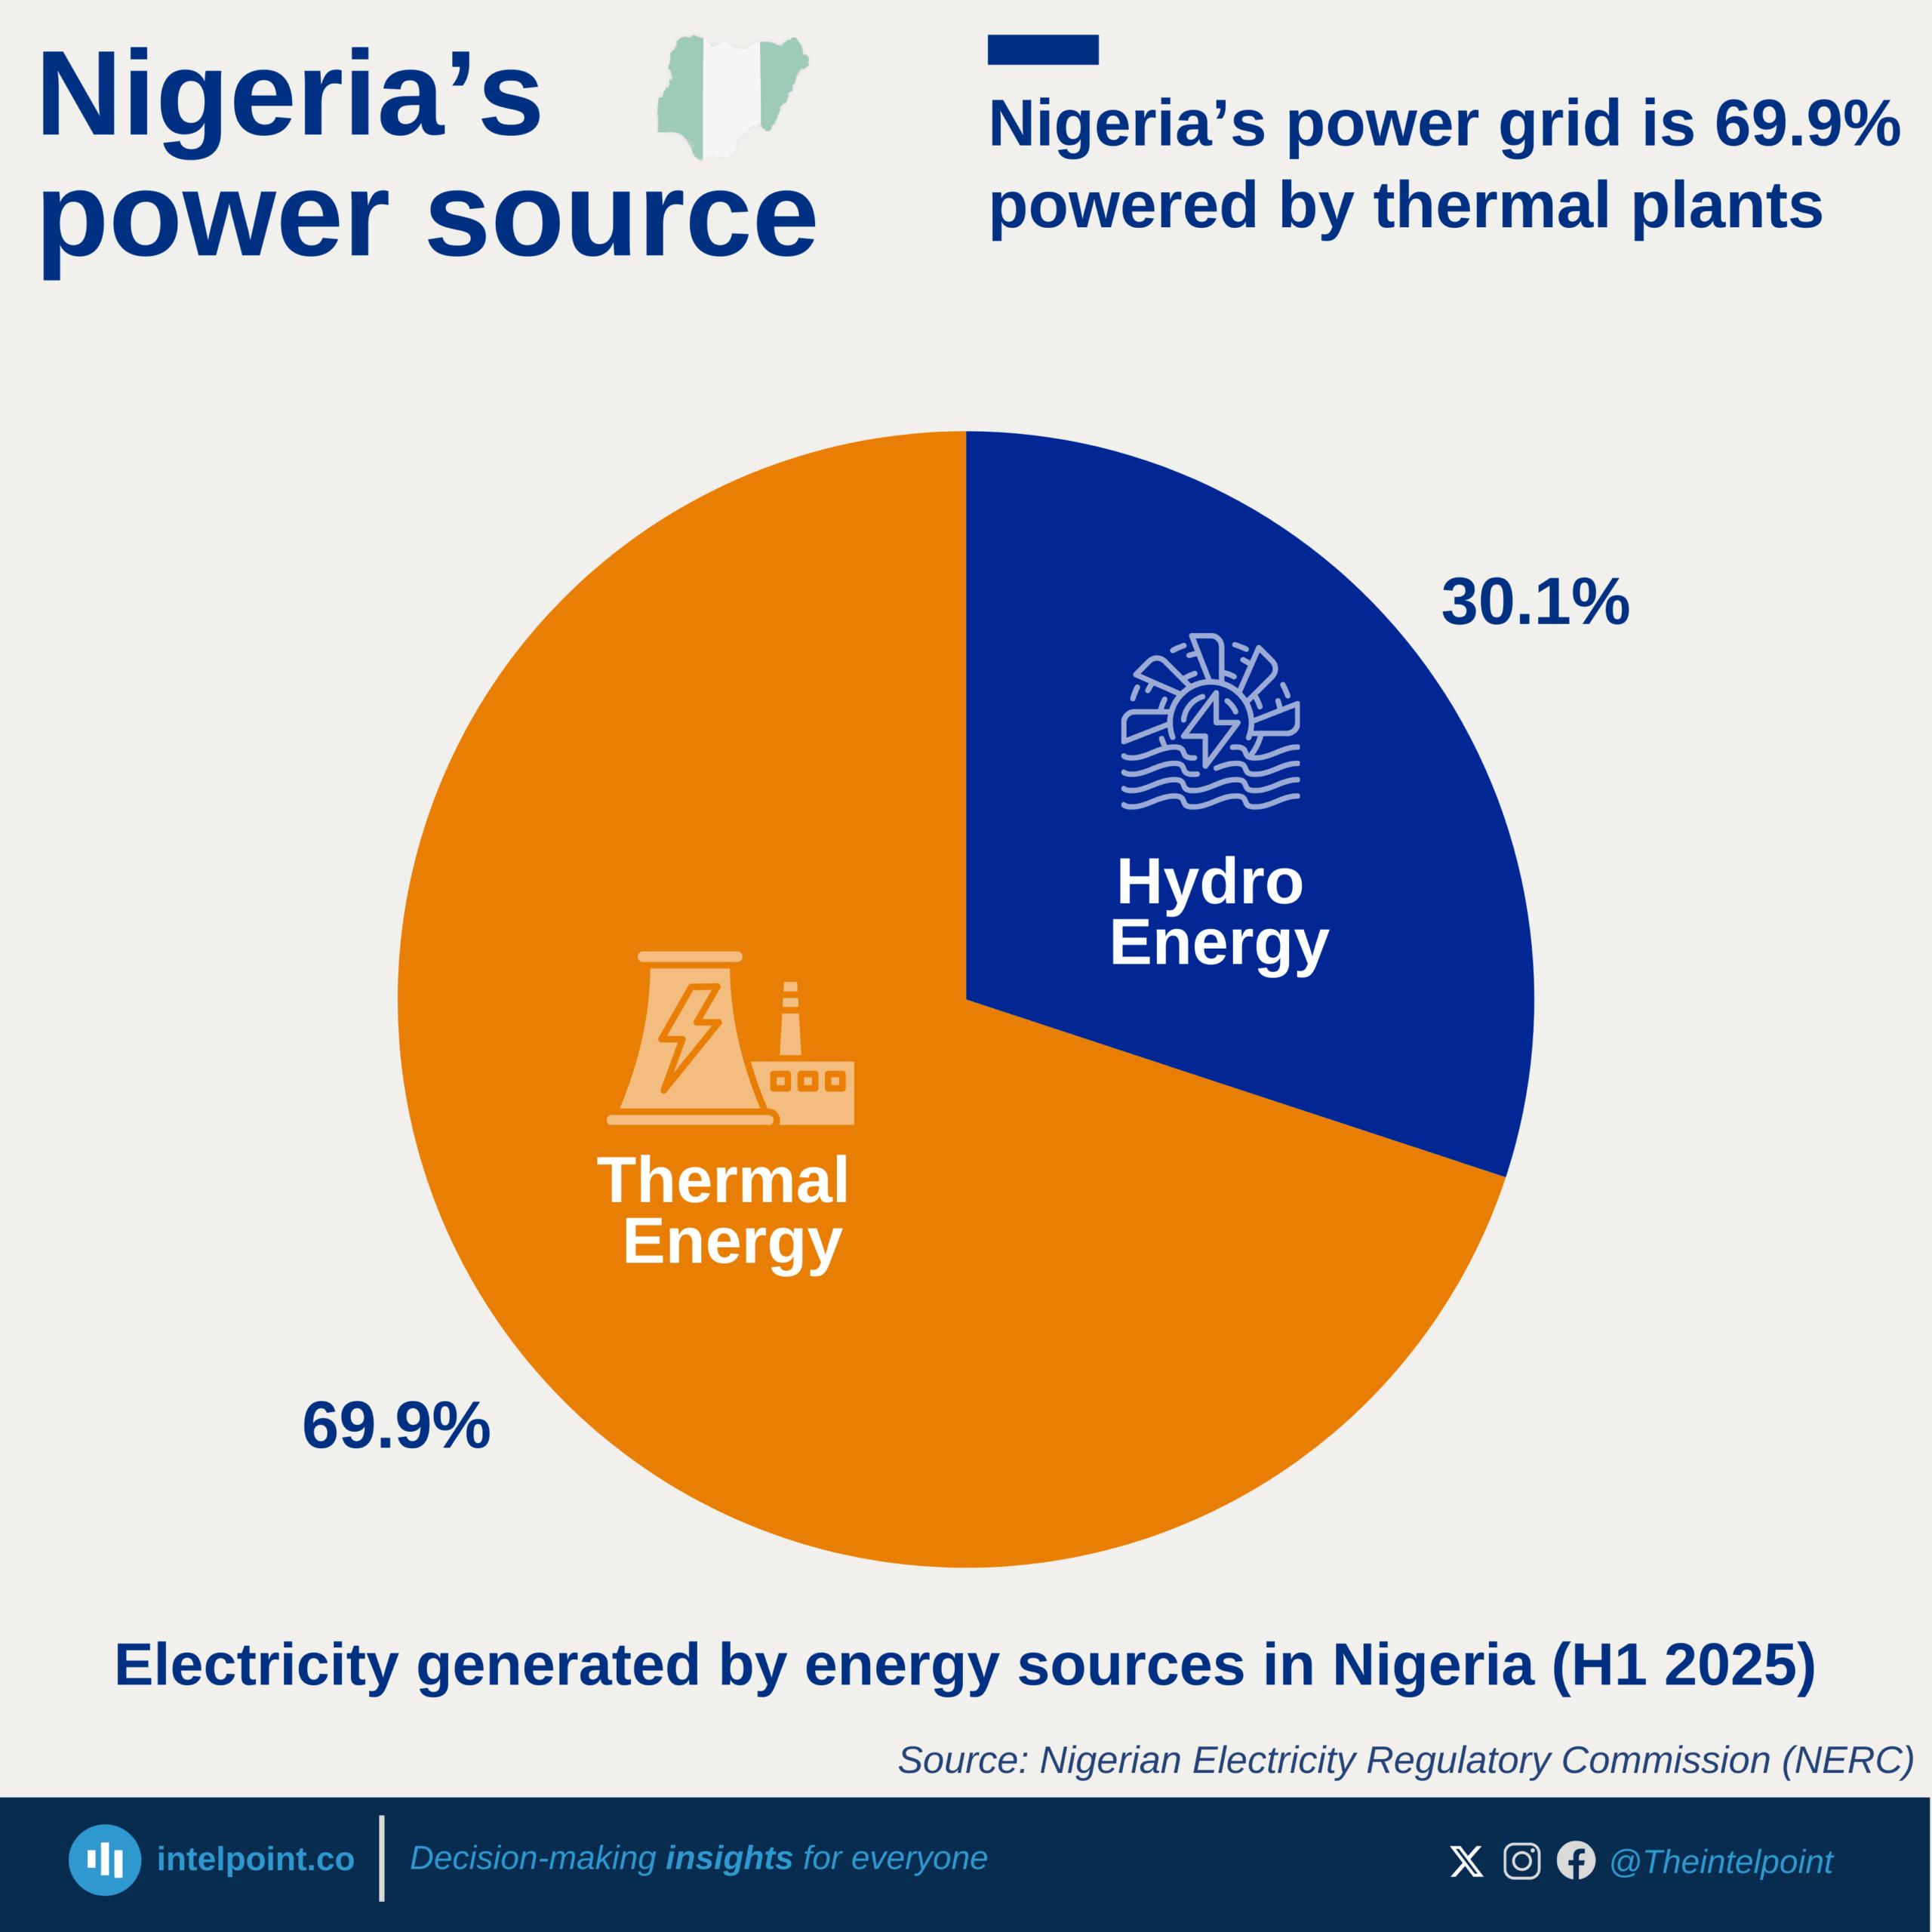
Nigeria’s power grid is 69.9% powered by thermal plants
  • Thermal energy dominates Nigeria’s grid, supplying 69.9% of total power.
  • Hydro plants contribute 30.1%, making them the country’s second major source.
  • The heavy reliance on thermal generation shows Nigeria’s grid is still largely fossil-fuel driven.
  • Hydro remains a crucial but secondary source, supporting overall supply stability.

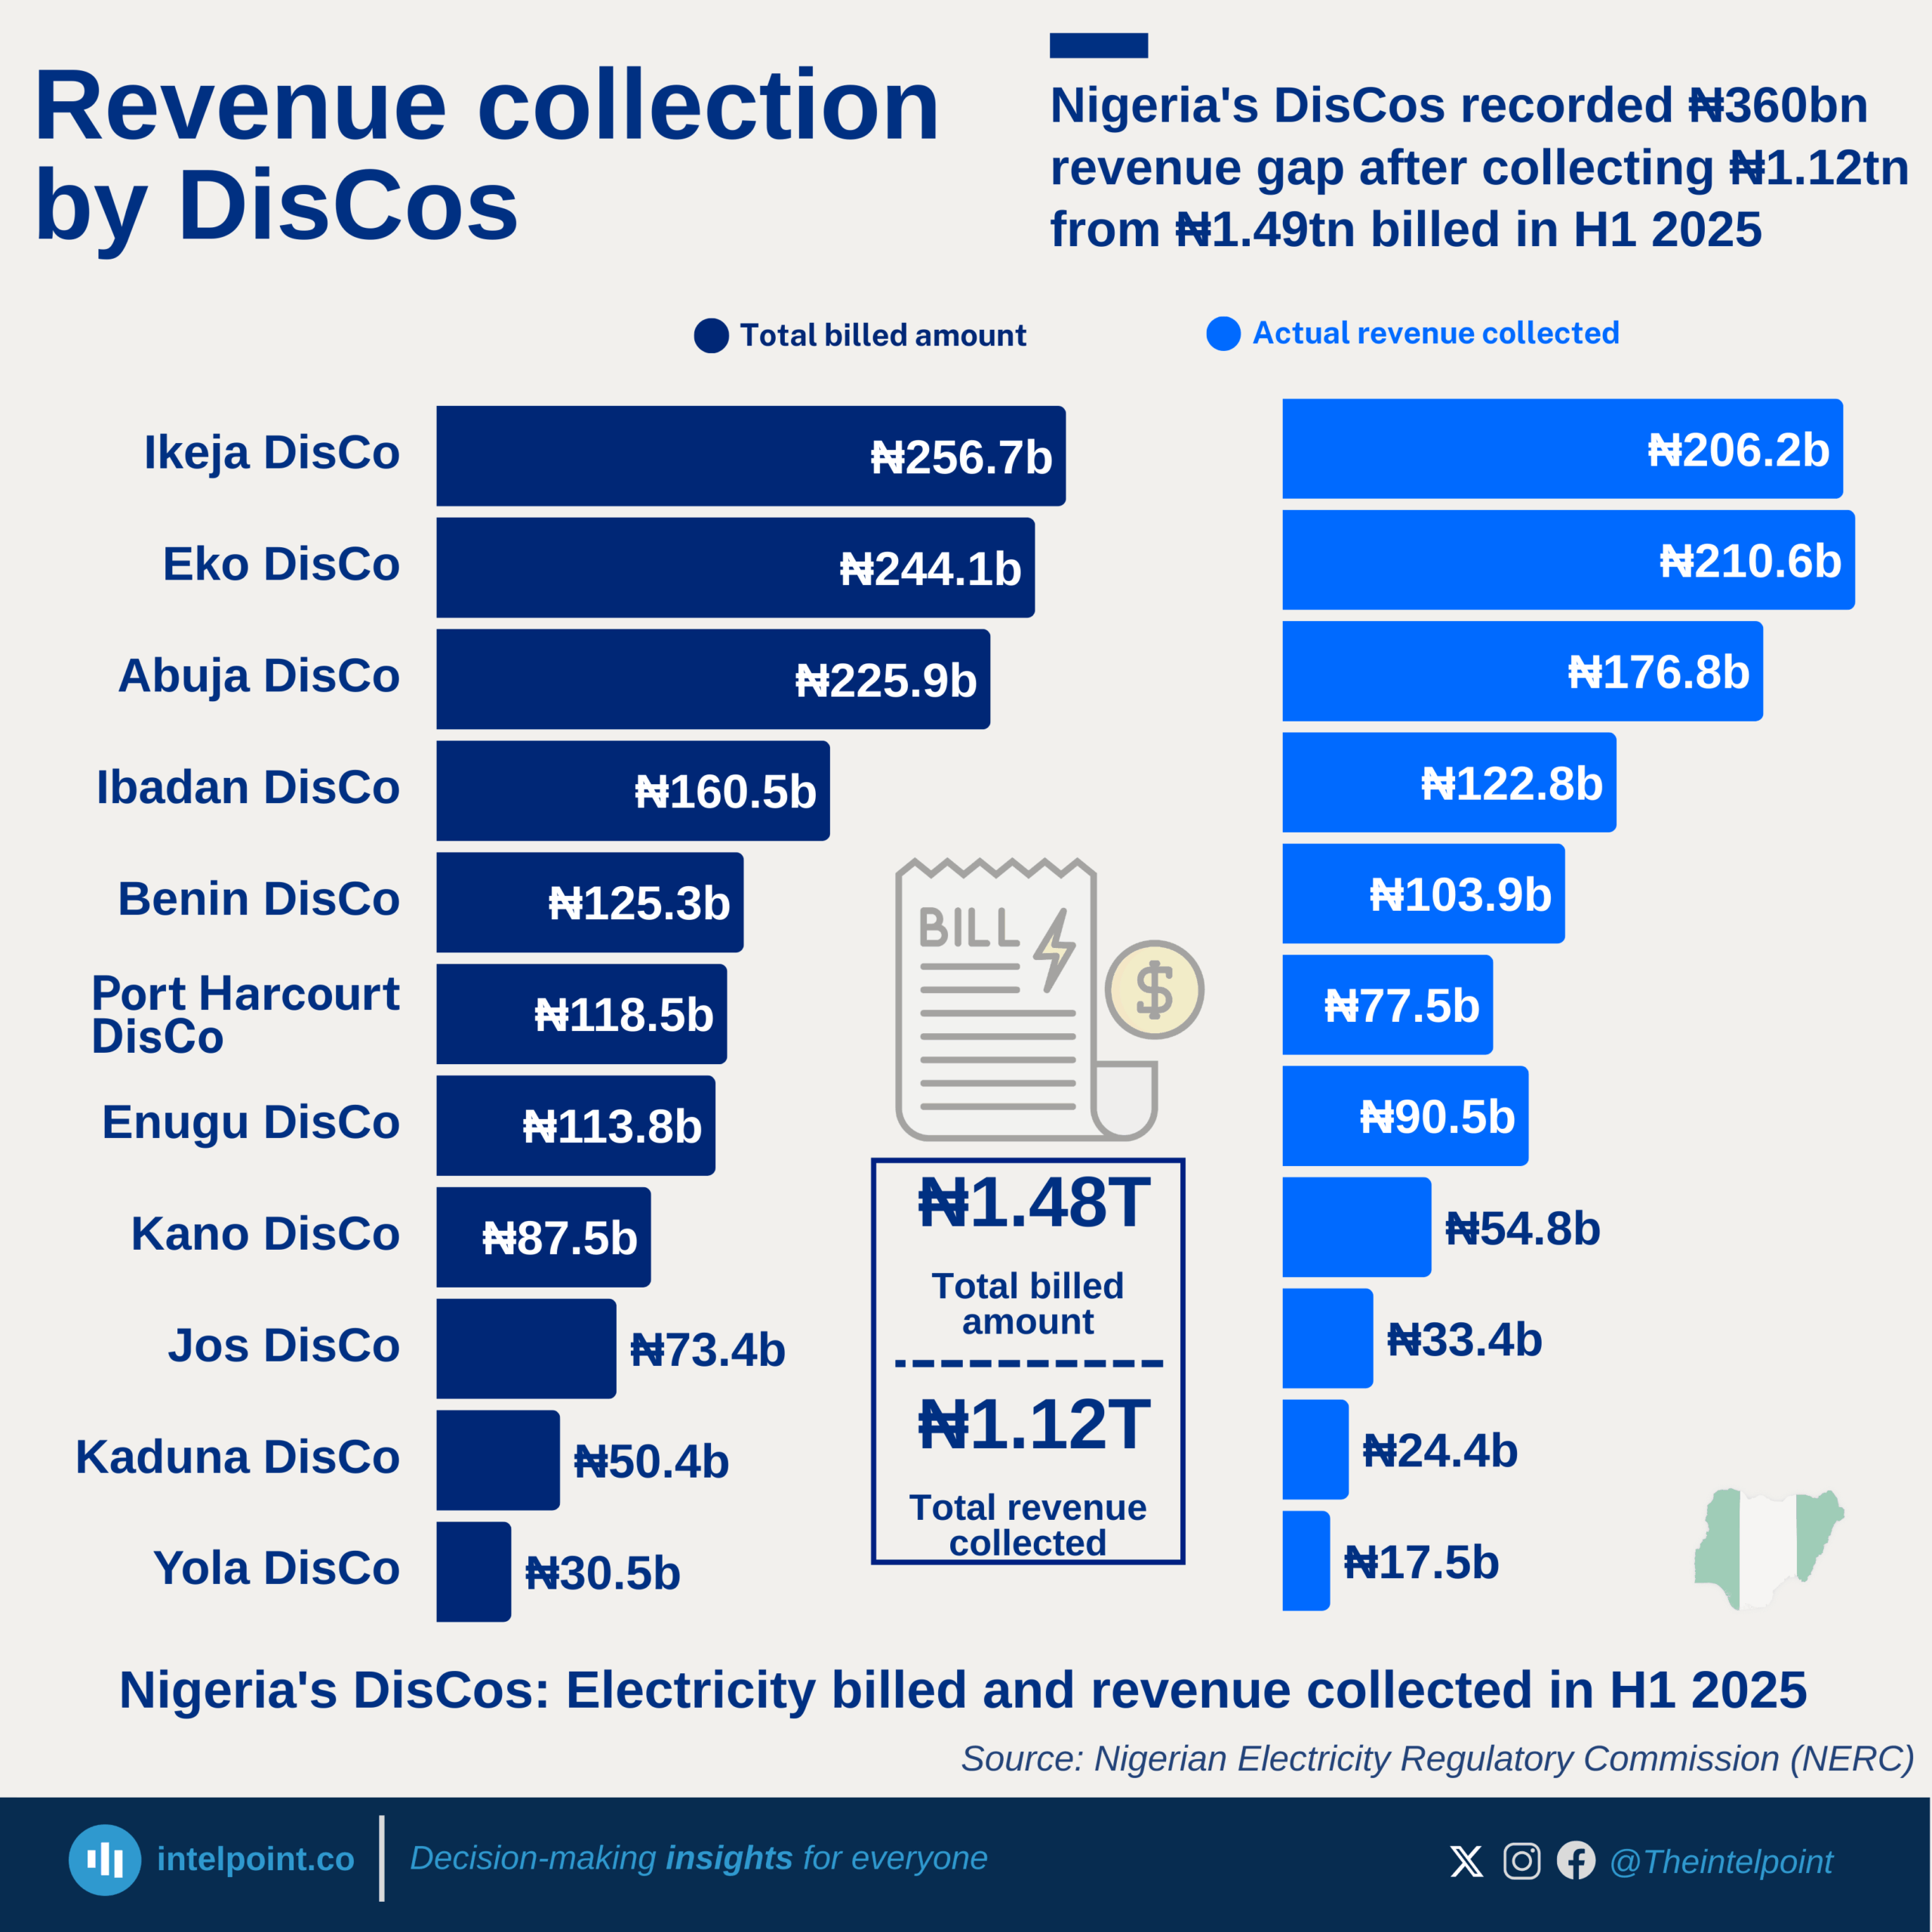
Nigeria's DisCos recorded ₦360bn revenue gap after collecting ₦1.12tn from ₦1.49tn billed in H1 2025
  • DisCos billed approximately ₦1.49 trillion but collected only ₦1.12 trillion in H1 2025.
  • Ikeja and Eko DisCos generated the highest revenues, collecting ₦206.22 billion and ₦210.59 billion, respectively.
  • Revenue collection gaps remain significant, with Jos, Kaduna, and Yola posting the weakest collection performances.
  • The wide gap between billings and actual collections suggests persistent challenges in customer payment compliance, metering, and distribution efficiency.

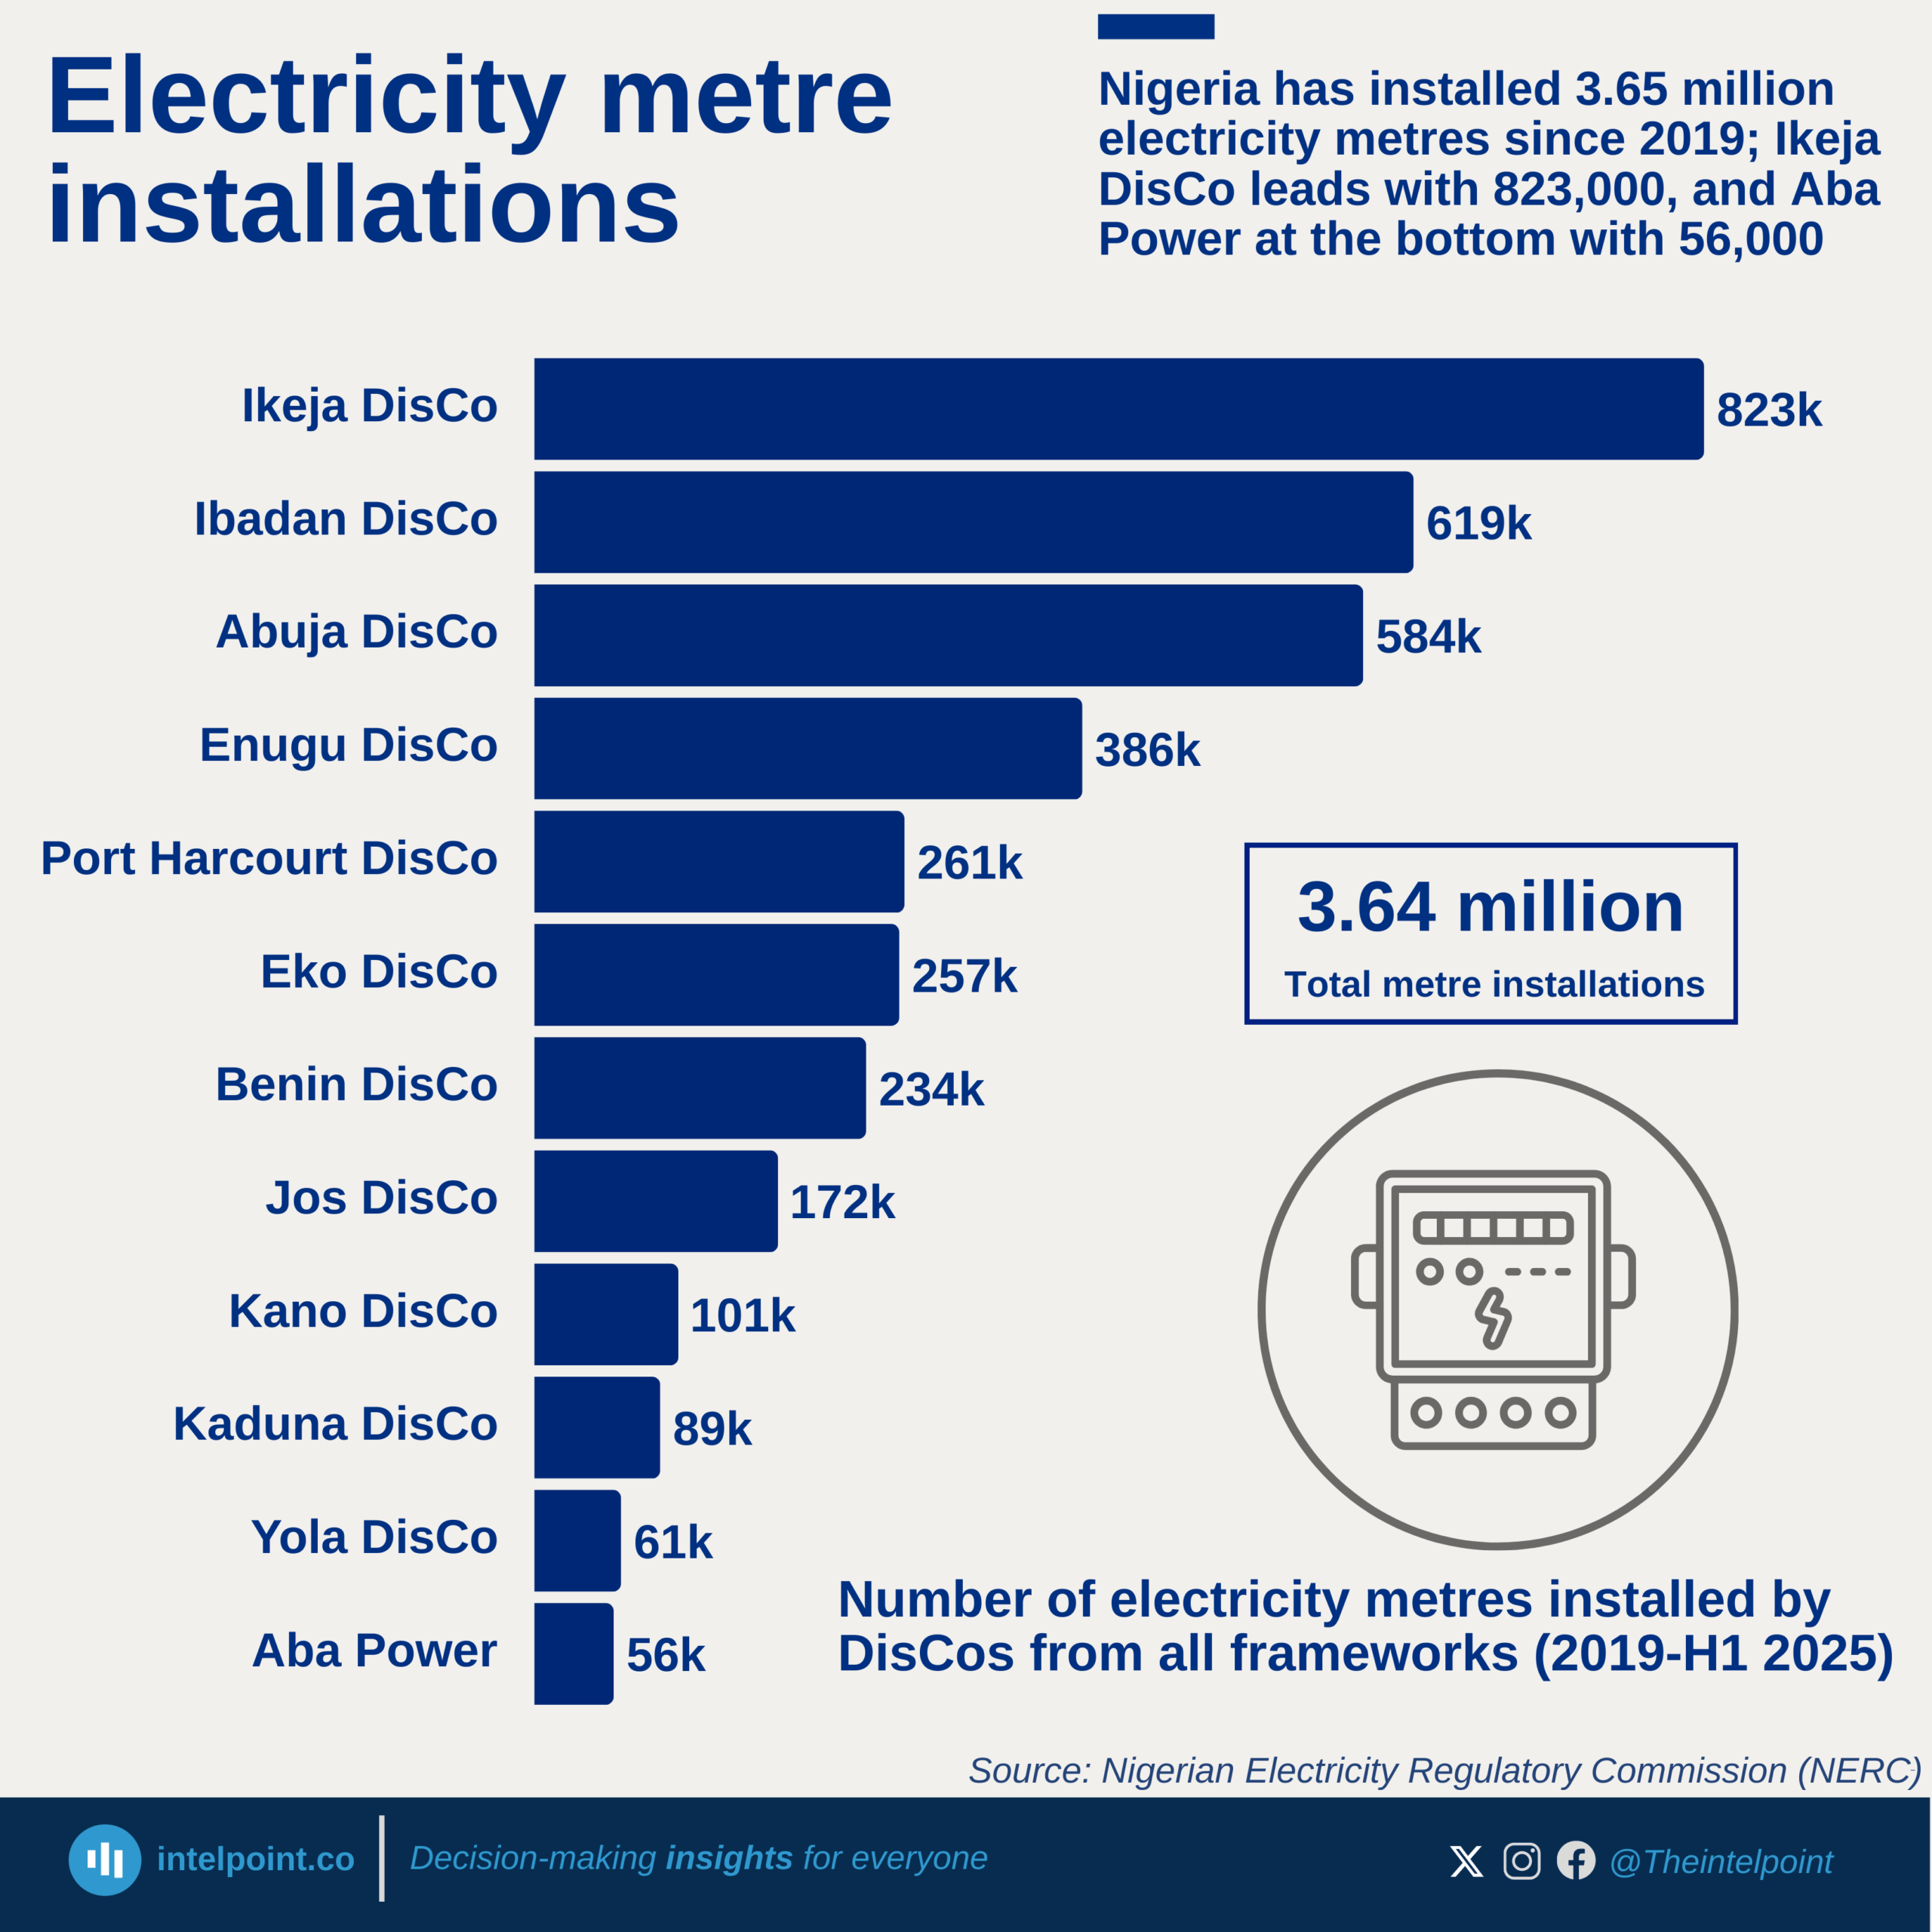
Nigeria has installed 3.65 million electricity metres since 2019; Ikeja DisCo leads with 823,000, and Aba Power at the bottom with 56,000
  • Approximately 3.65 million metres have been installed nationwide across all frameworks since 2019.
  • Ikeja DisCo leads by a wide margin with 823,000 installations, over twice the volume of most other DisCos.
  • Kaduna, Yola, and Aba Power recorded the lowest metre installations, each below 100,000.
  • The disparities in installation totals reveal uneven progress in achieving nationwide metering coverage.

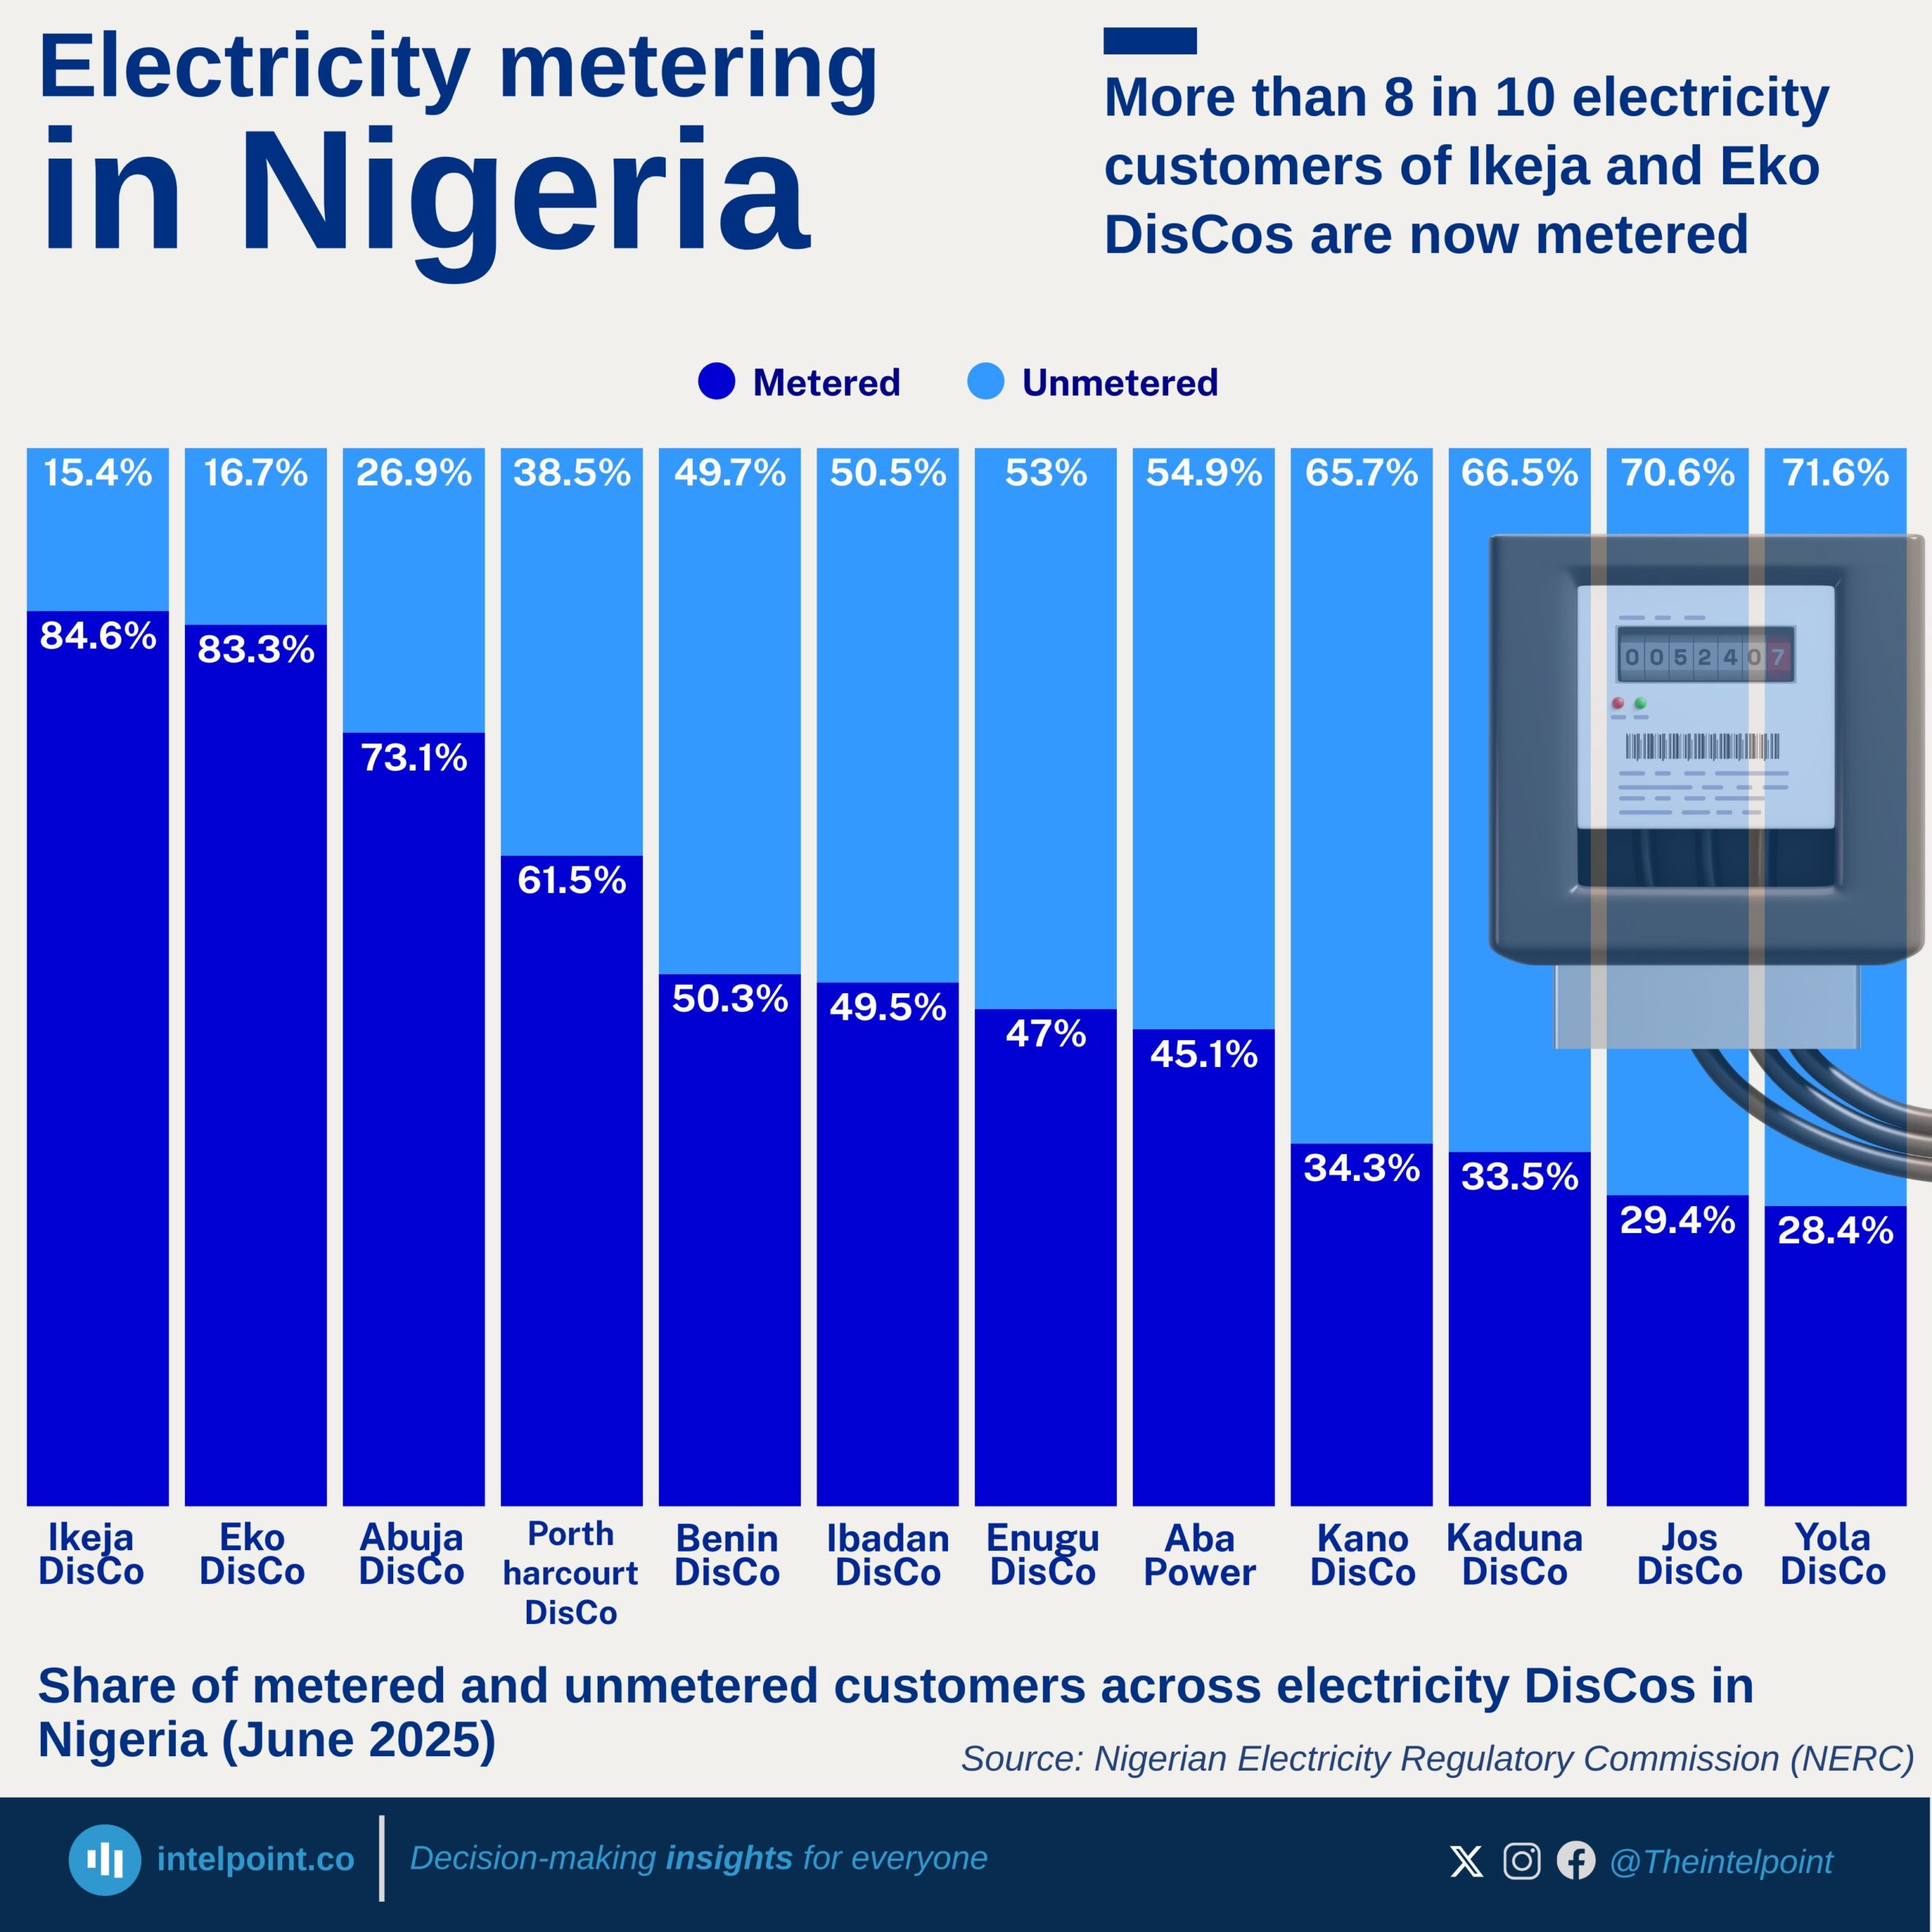
More than 8 in 10 electricity customers of Ikeja and Eko DisCos are now metered
  • Ikeja (84.6%) and Eko (83.3%) lead Nigeria’s metering performance, keeping unmetered customers below 17%.
  • Eight out of the twelve DisCos have metering rates below 60%, showing a wide sector imbalance.
  • The worst-performing DisCos — Yola, Jos, Kaduna, and Kano — have over 65% unmetered customers.
  • Regional disparities are sharp: Lagos and Abuja outperform northern and south-eastern DisCos by large margins.

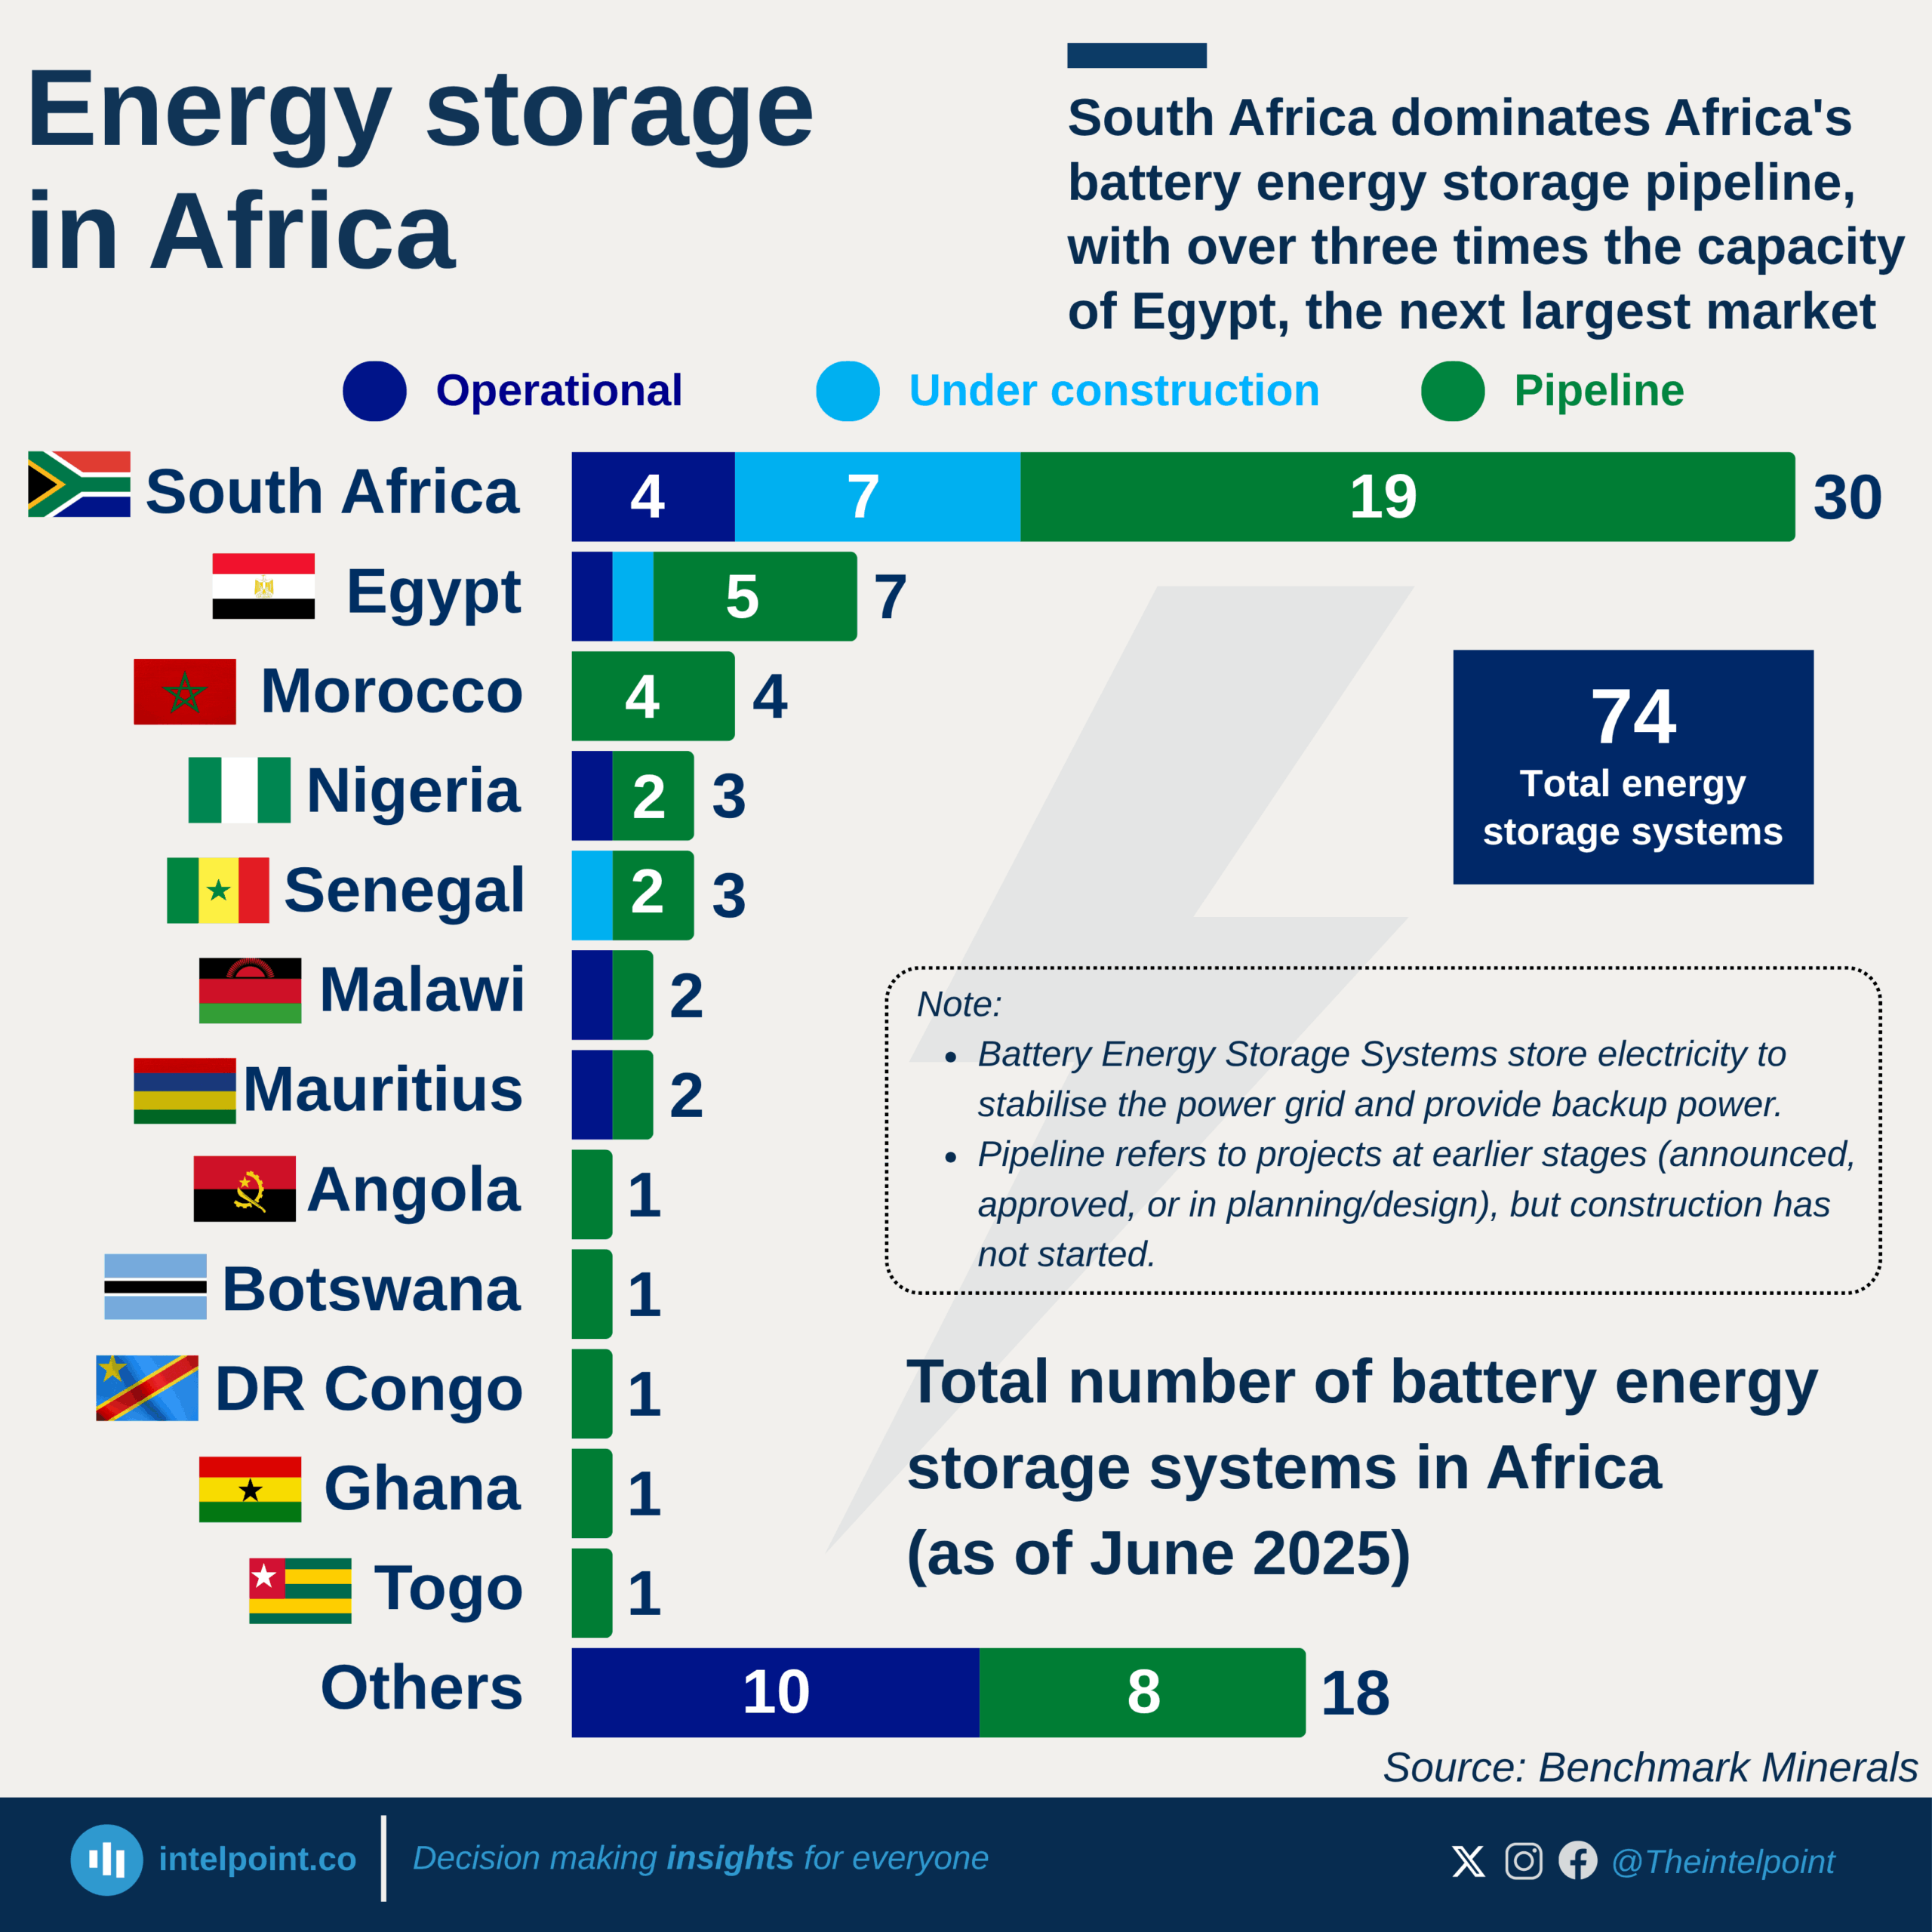
South Africa dominates Africa's battery energy storage pipeline, with over three times the capacity of Egypt, the next largest market
  • South Africa dominates with 30 battery storage systems, the largest by far.
  • Egypt is the second-largest market with 7 projects, while Morocco has 4.
  • Nigeria and Senegal have five projects each (operational + pipeline).
  • Several countries, including Ghana, Togo, Angola, Botswana, DR Congo, and Mauritius, each have just one or two projects, indicating an uneven spread across the continent.
  • South Africa also leads in systems under construction (7).
  • Operational projects are still limited continent-wide, with most systems either under construction or in the planning pipeline.

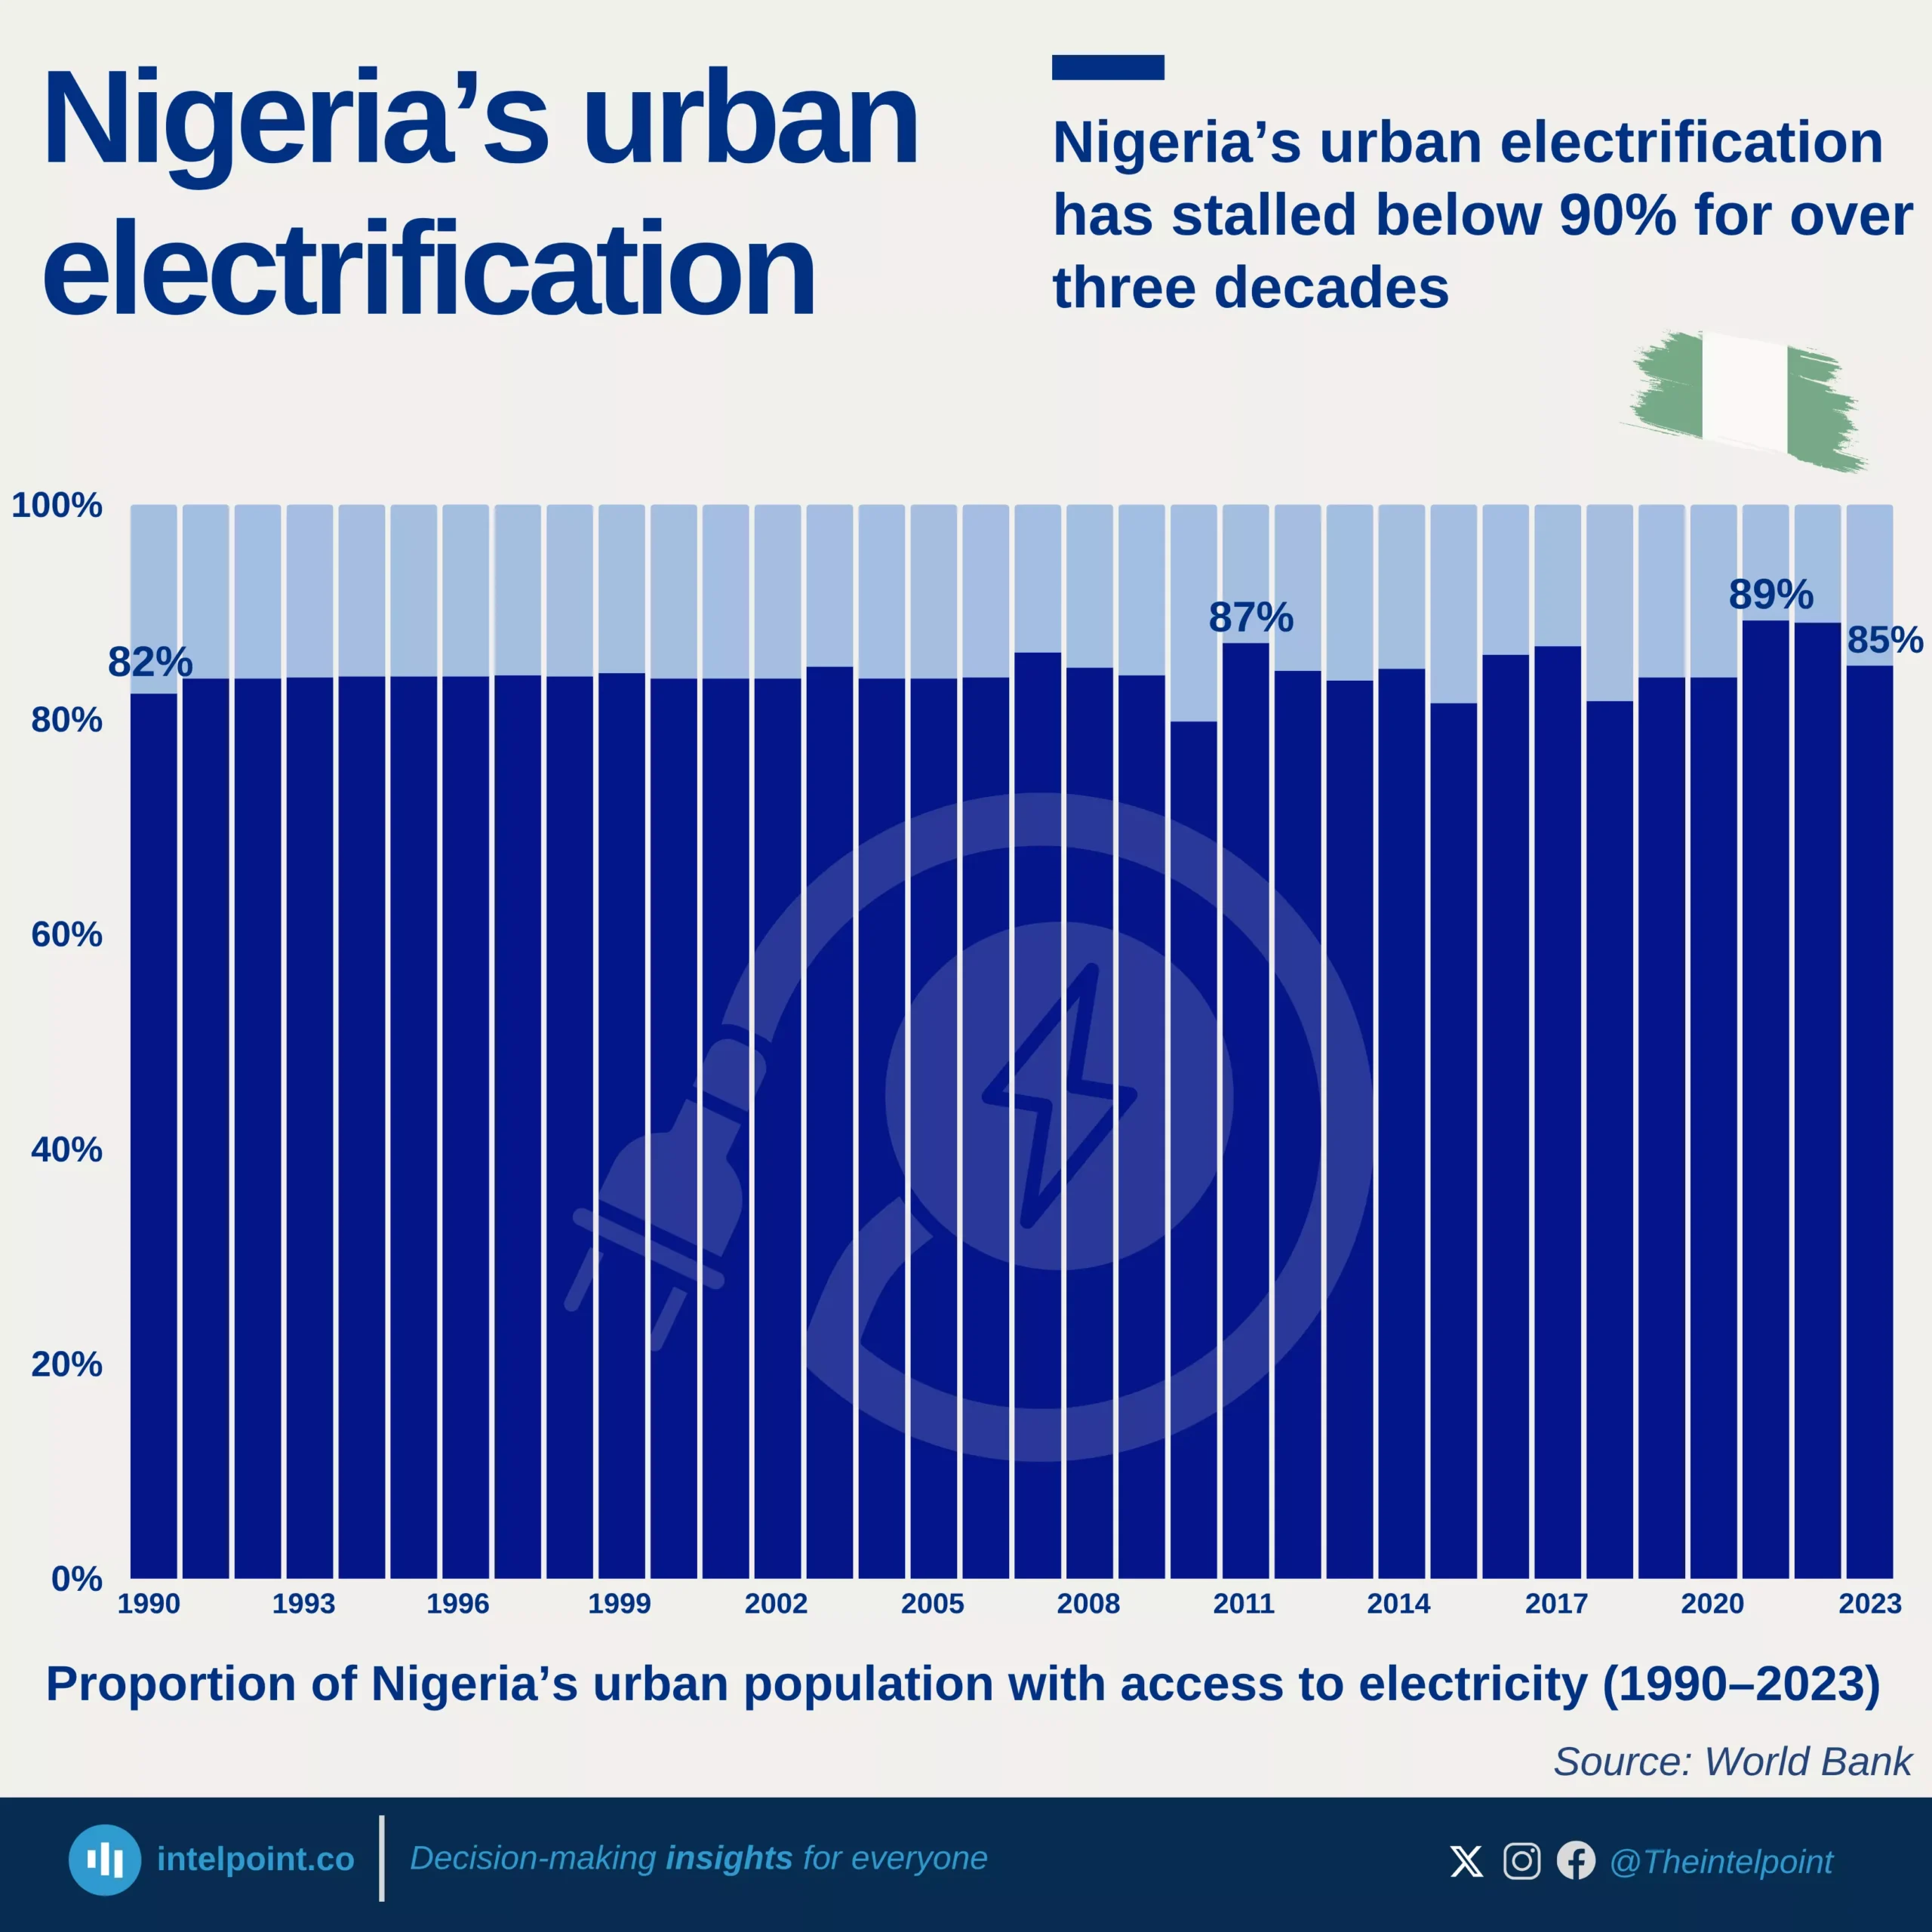
Nigeria’s urban electrification has stalled below 90% for over three decades
  • Urban electricity access has remained between 80% and 89% since 1990, never crossing to 90%.
  • The inability to achieve universal access suggests that infrastructure expansion has struggled to keep pace with rapid urbanisation and population growth.
  • Periodic dips in access, such as in 2010 and 2015, point to challenges in maintaining consistent electricity supply rather than just extending connections.
  • Insufficient generation, outdated grids, and policy inefficiencies have constrained Nigeria’s ability to deliver reliable and universal electricity access even in its urban centres.

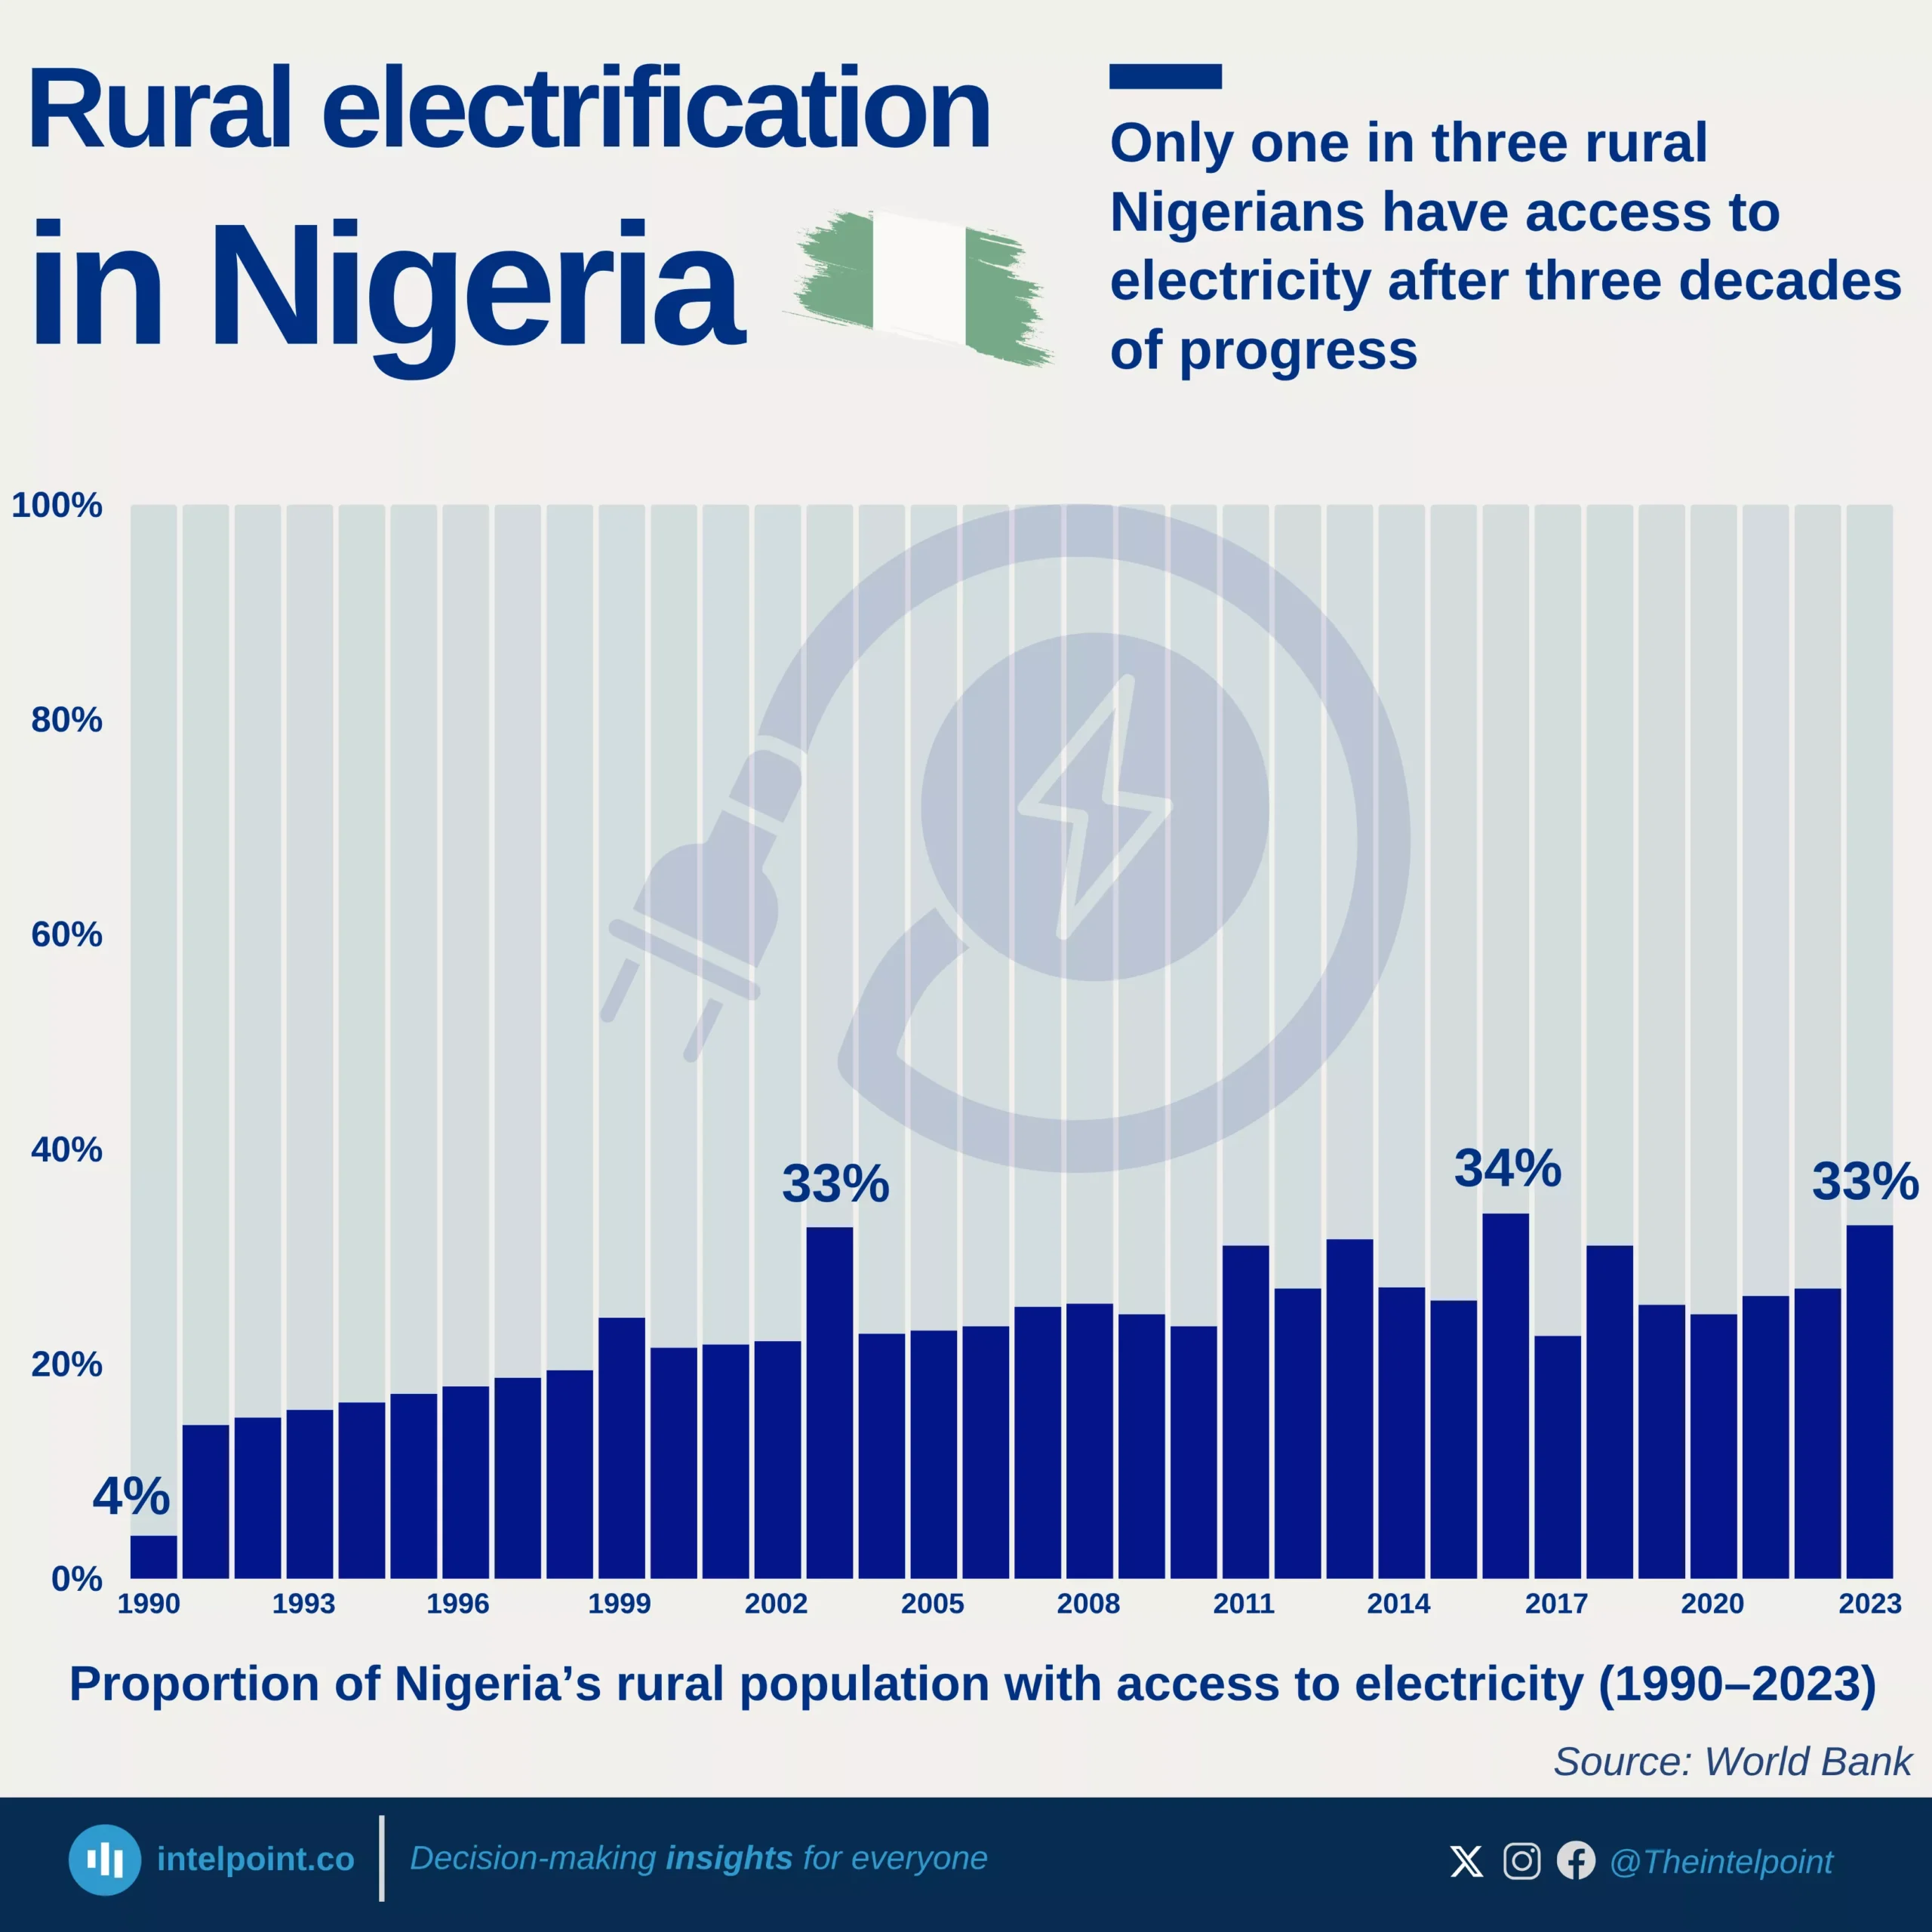
Only one in three rural Nigerians have access to electricity after three decades of progress
  • Rural electricity access increased from just 4% in 1990 to about 33% in 2023, showing gradual progress over three decades.
  • The data reveals irregular jumps in certain years—such as 2003, 2011, and 2016—likely tied to temporary electrification programmes or revised data estimates. D
  • espite improvements, nearly two-thirds of rural Nigerians still lack electricity, underscoring a wide disparity in energy access across regions.
  • The slow rate of expansion highlights ongoing issues with investment, grid extension, and maintenance that continue to limit rural electrification efforts.
1 2 3 4 … 7

Can’t find what you’re looking for? Please fill the form below
Contact Form Demo
SIGN UP TO OUR NEWSLETTER
Get periodic updates about the African startup space, access to our reports, among others.
Subscribe Here
Subscription Form

A product of Techpoint Africa. All rights reserved