Crude oil alone accounts for 55.7% of all exports. Remove it and Nigeria runs a ₦26.7tn trade deficit. The entire surplus rests on one commodity.
Nigeria imports ₦31.97tn in manufactured goods but exports only ₦2.50tn, a 12-to-1 ratio that reflects near-total dependence on foreign industrial output.
Nigeria exports ₦25.3tn in petroleum products yet imports ₦13.3tn of refined petroleum. Africa's top oil producer still can't fully process its own crude.
Despite Nigeria's vast farmland, agri-exports (₦5.07tn) barely exceed agri-imports (₦4.76tn). The sector earns almost nothing net.
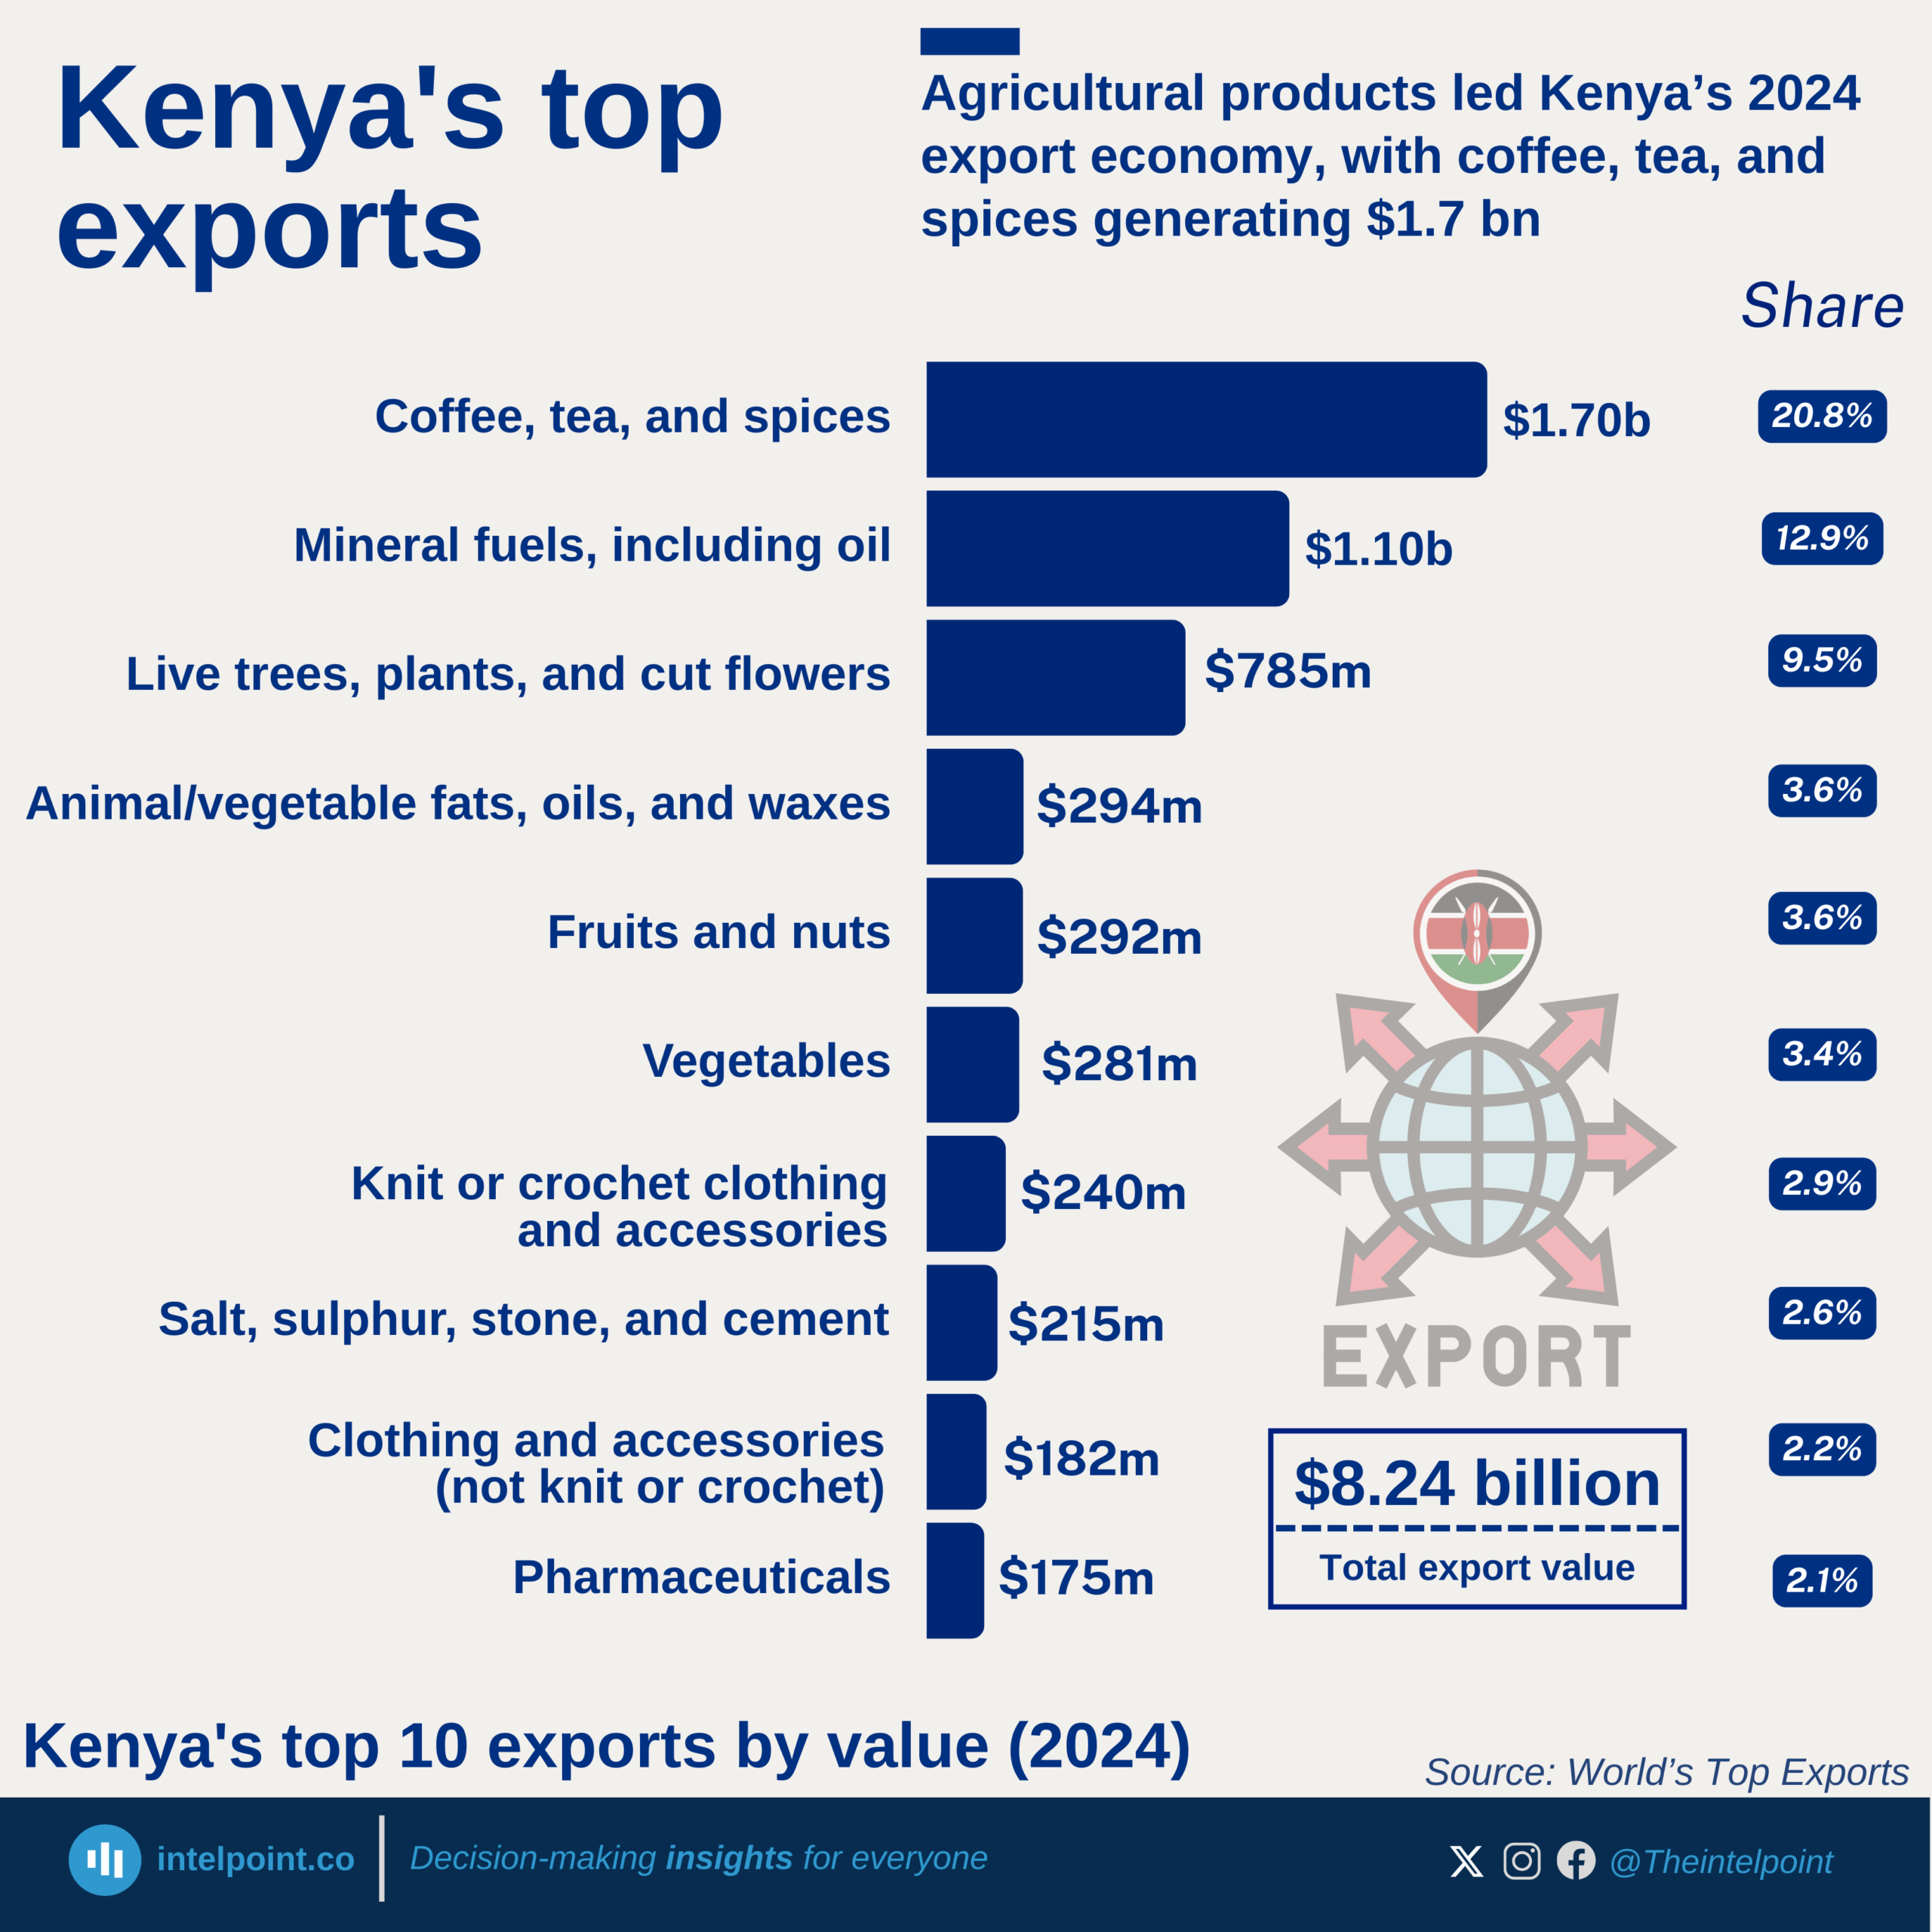
Agriculture dominated Kenya’s exports, with coffee, tea, and spices alone contributing $1.7 billion, the largest single export category.
Mineral fuels were a surprisingly strong second, delivering $1.1 billion, and showing Kenya’s growing role in regional fuel distribution.
Horticultural exports (flowers, live plants, and trees) contributed $790 million, reinforcing Kenya’s global strength in floriculture.
All other export categories fall below $300 million individually, reflecting a long list of small but diverse export segments such as textiles, vegetables, and pharmaceuticals.