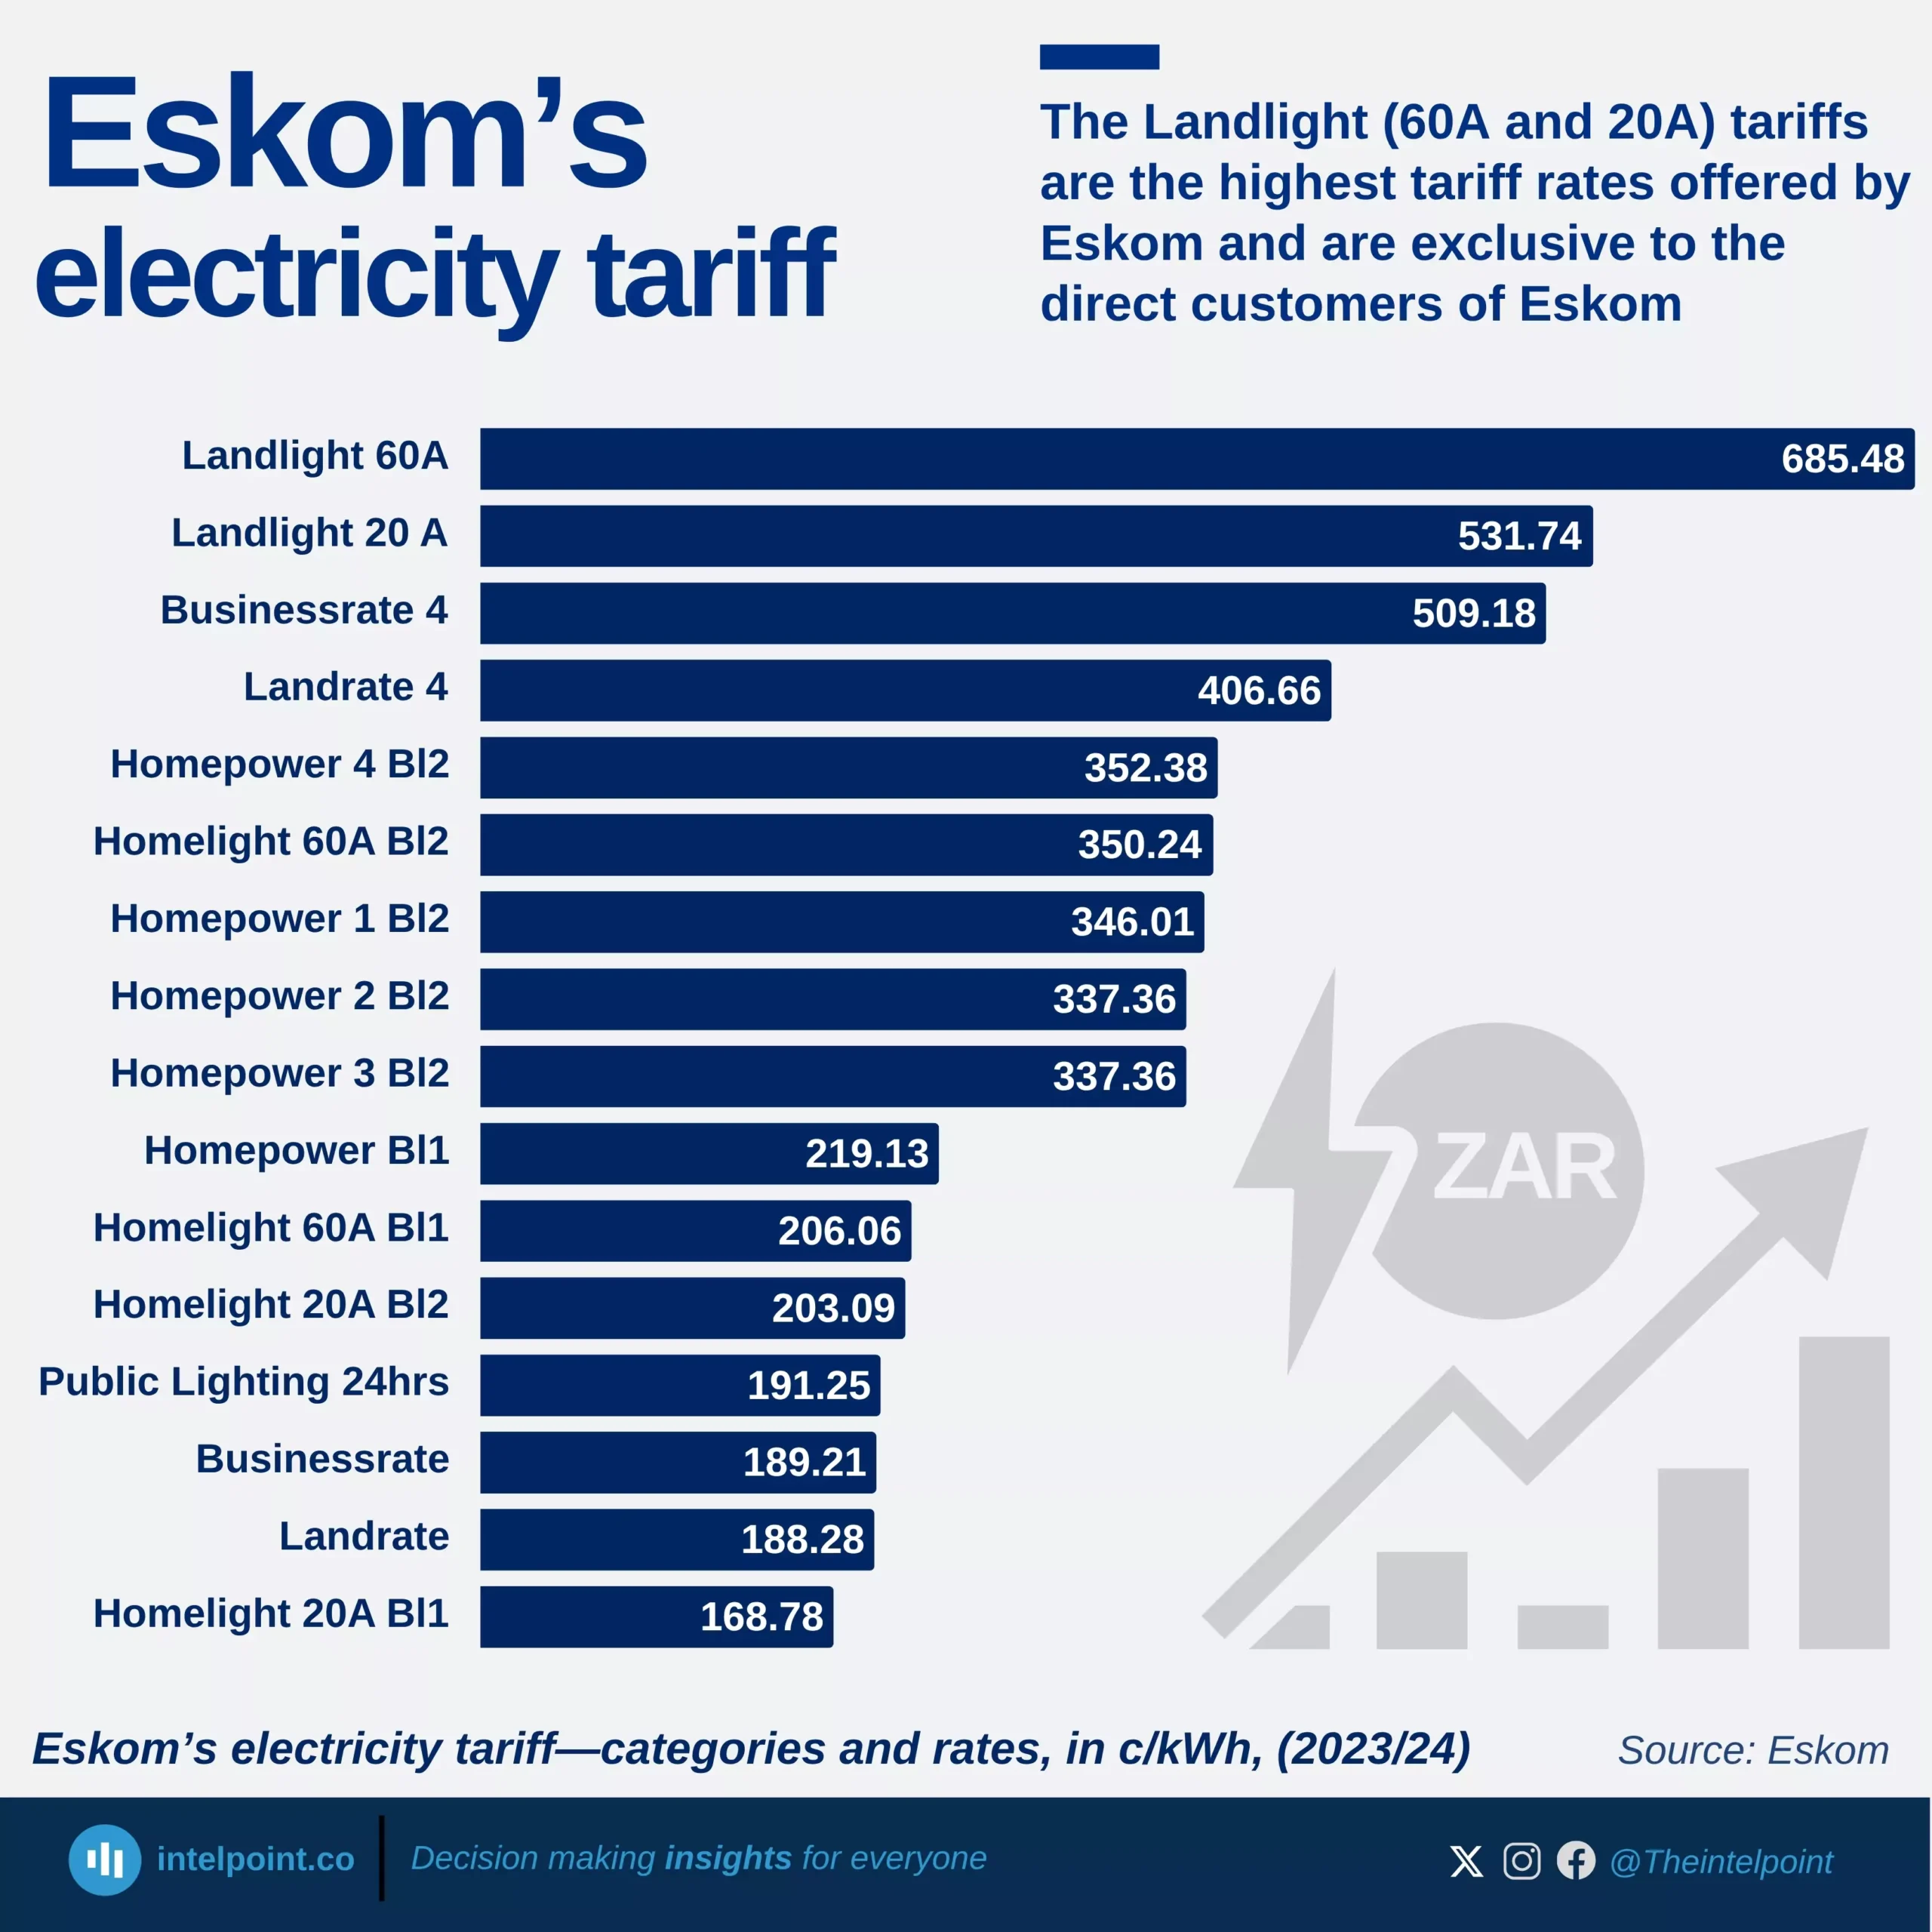
Eskom electricity tariff—categories and rates (2023/24, c/kWh)

Key Takeaways

  • Landlight tariffs (20A and 60A), offered primarily in rural areas, are Eskom’s highest tariff rates and are exclusive to direct (non-local authority) customers.
  • The Homelight 20A Block 1 tariff, which applies to consumption between 0–350 kWh, is the lowest among Eskom’s tariffs.
  • Landlight tariffs carry higher rates because they exclude other fixed charges such as: Ancillary service charge (c/kWh), Network demand charge (c/kWh), Network capacity charge (R/POD/day), and Service charge (R/POD/day). This structure makes Landlight more suitable for rural or low-income areas, where simplifying cost recovery is necessary.
  • Eskom classifies its tariffs into the following categories:
    • Residential Tariffs (for household electricity supply): Homelight 20A, Homelight 60A, Homepower, and Homeflex
    • Urban Tariffs (for large industrial and commercial users): Megaflex, Miniflex, Nightsave Urban (Large and Small), Business Rate, Public Lighting, Transflex (rail), and Gen-Wheeling/Offset tariffs
    • Rural Tariffs (for agricultural, business, and residential customers in rural areas): Ruraflex, Nightsave Rural, Landrate, and Landlight
    • Municipal Tariffs (for municipalities purchasing in bulk and for municipal services like water pumps or offices): Municrate, Municflex, and Public Lighting.
  • Customers with rooftop solar PV systems are required to be on the Homeflex tariff plan, which is based on Time-of-Use (ToU) pricing.
  • Several Eskom tariffs are Time-of-Use-based, where charges vary depending on peak, standard, and off-peak periods. These include: Nightsave Urban Large, Nightsave Urban Small, Megaflex, Miniflex, Homeflex, Nightsave Rural, Ruraflex, and Ruraflex Gen

Over the years, Eskom has developed a range of tariff structures to cater to the diverse needs of its customers across South Africa. In the 2023/24 tariff year, Landlight tariffs, specifically the 60A and 20A variants, remain the highest charged rates, standing at 685.48 c/kWh and 531.74 c/kWh respectively. These tariffs are exclusive to direct (non-local authority) customers and are predominantly applied in rural areas where Eskom supplies electricity directly to end-users, without municipal intermediaries.

At the other end of the spectrum, the Homelight 20A Block 1 tariff, applicable to households consuming between 0–350 kWh, is the lowest, at 168.78 c/kWh. This affordability makes it ideal for lower-income or low-usage households, reinforcing Eskom's attempt to maintain accessibility in basic electricity consumption.

The high cost of the Landlight tariffs is compensated by the absence of several fixed charges typically included in other Eskom tariffs.
Source:

Eskom

Period:

2023/24
HTML code to embed chart
Want a bespoke report?
Reach out
Tags
Related Insights

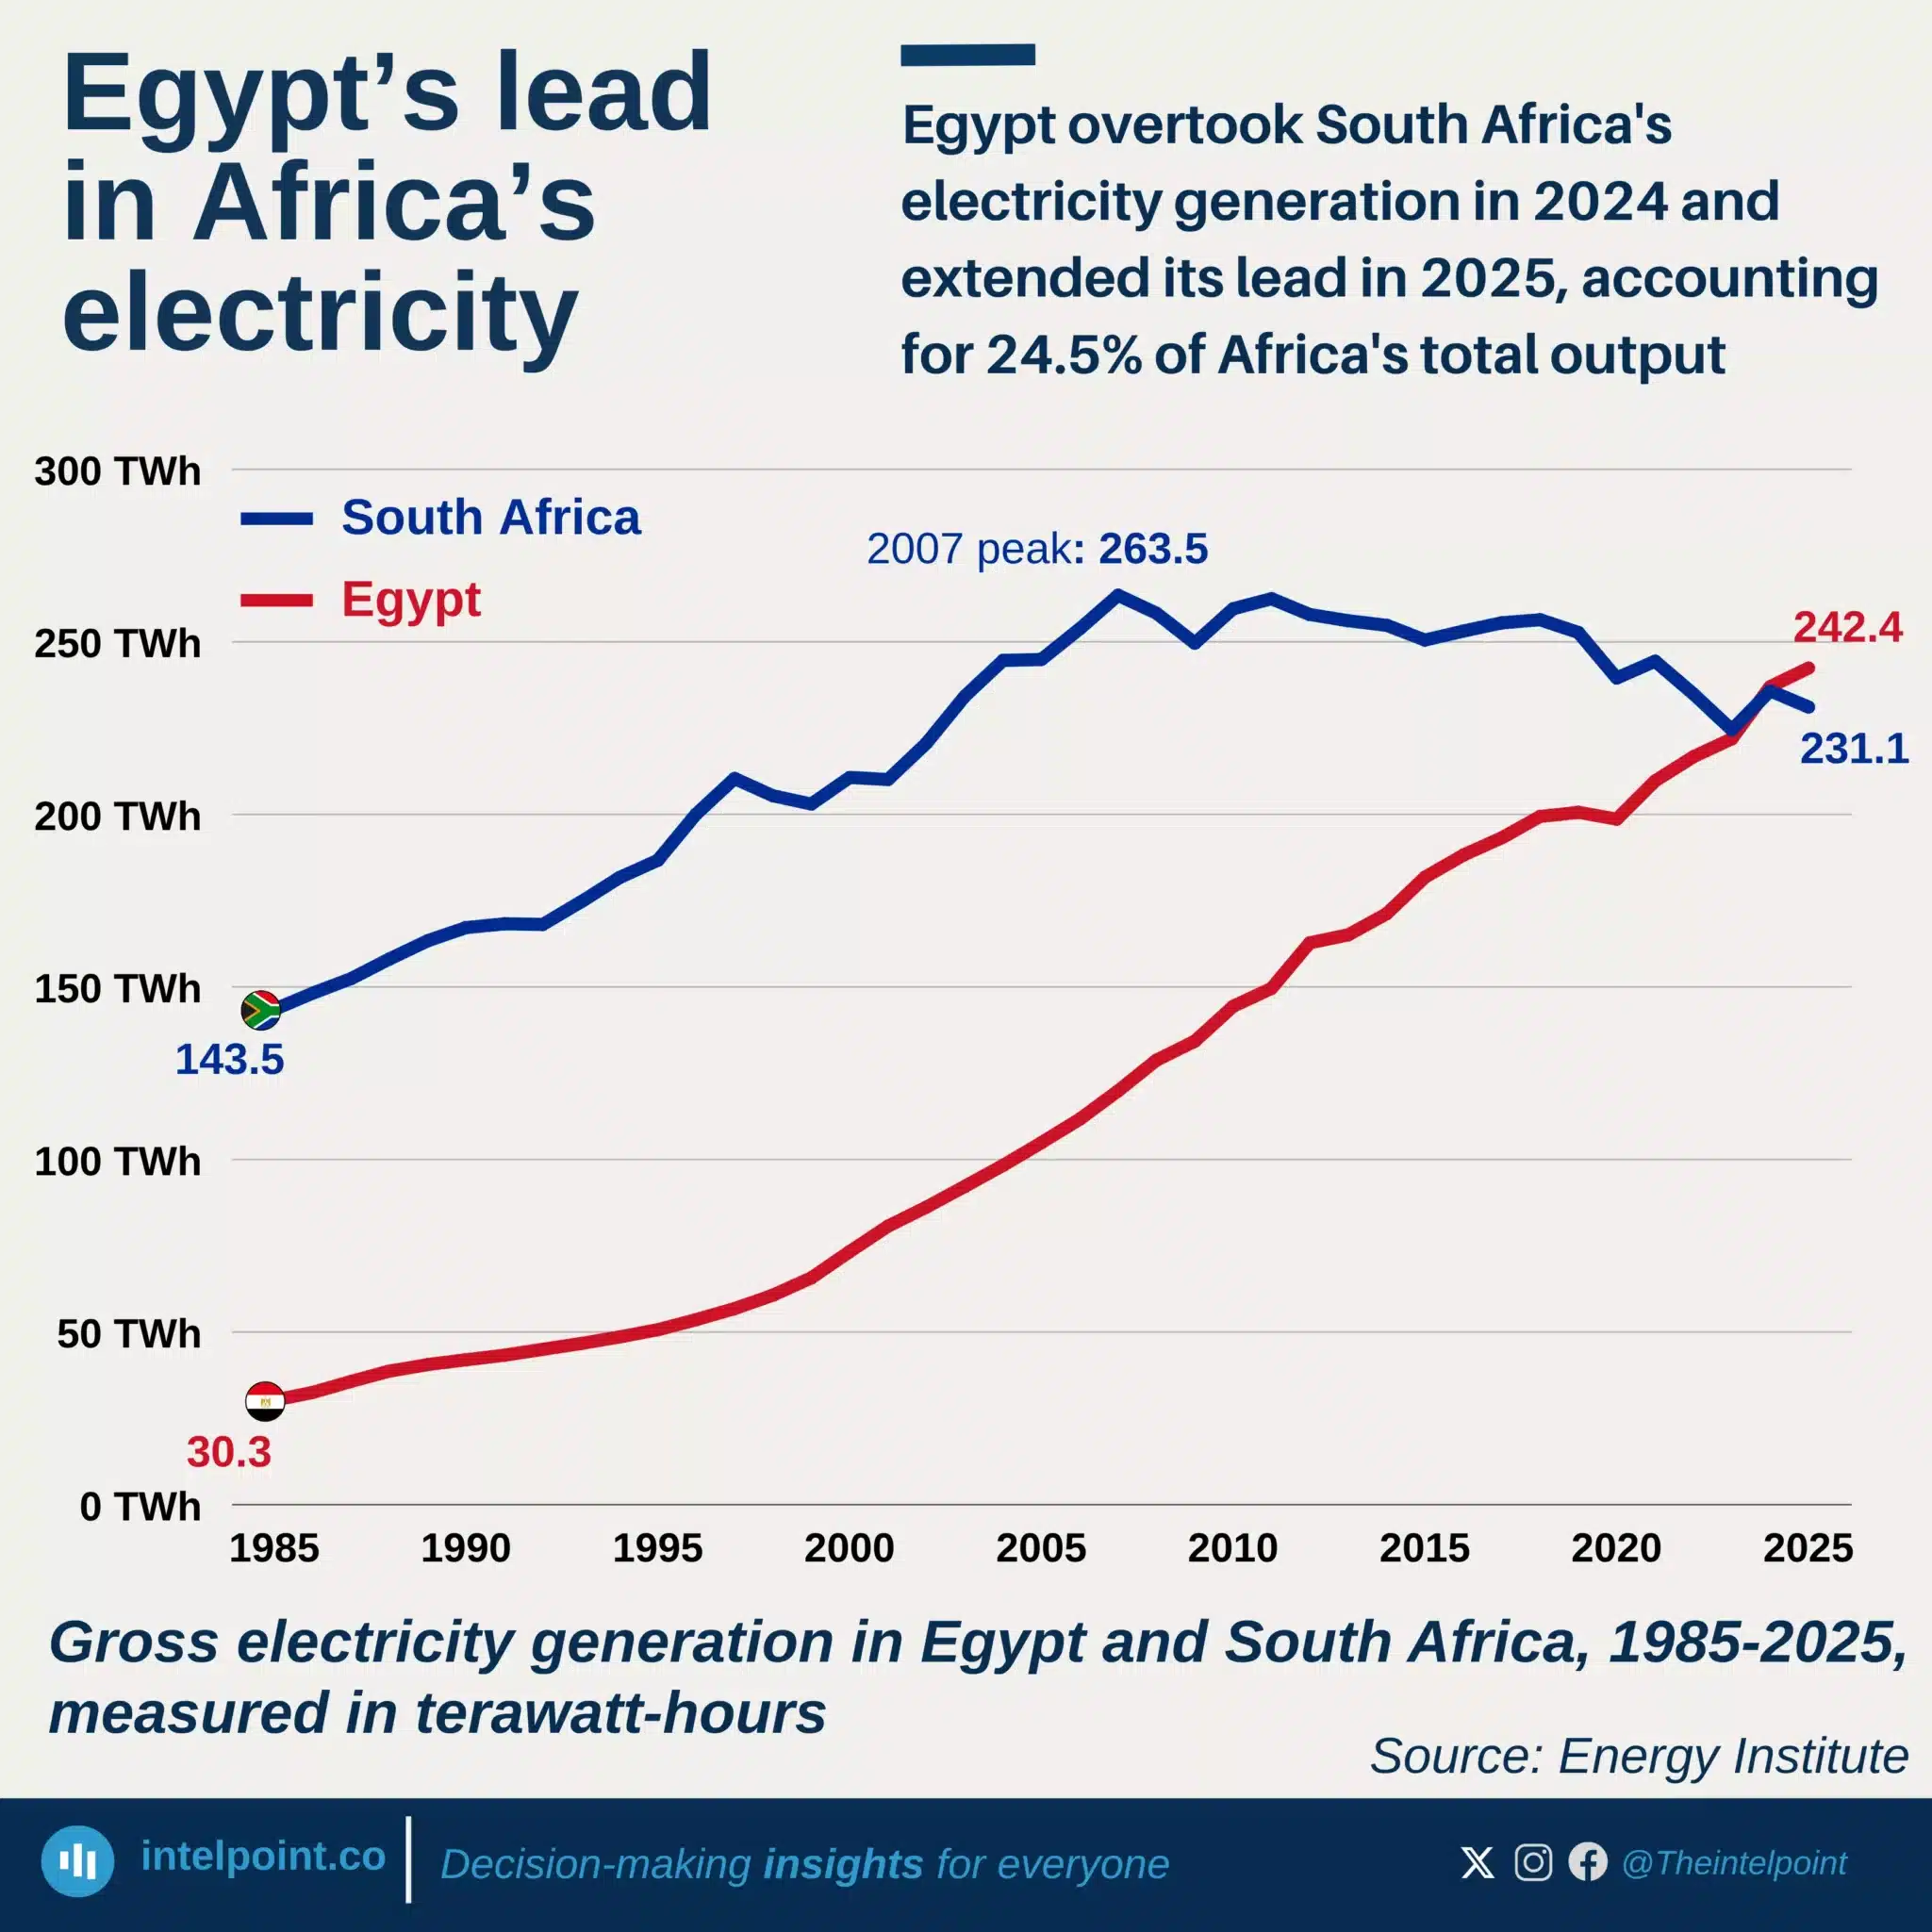
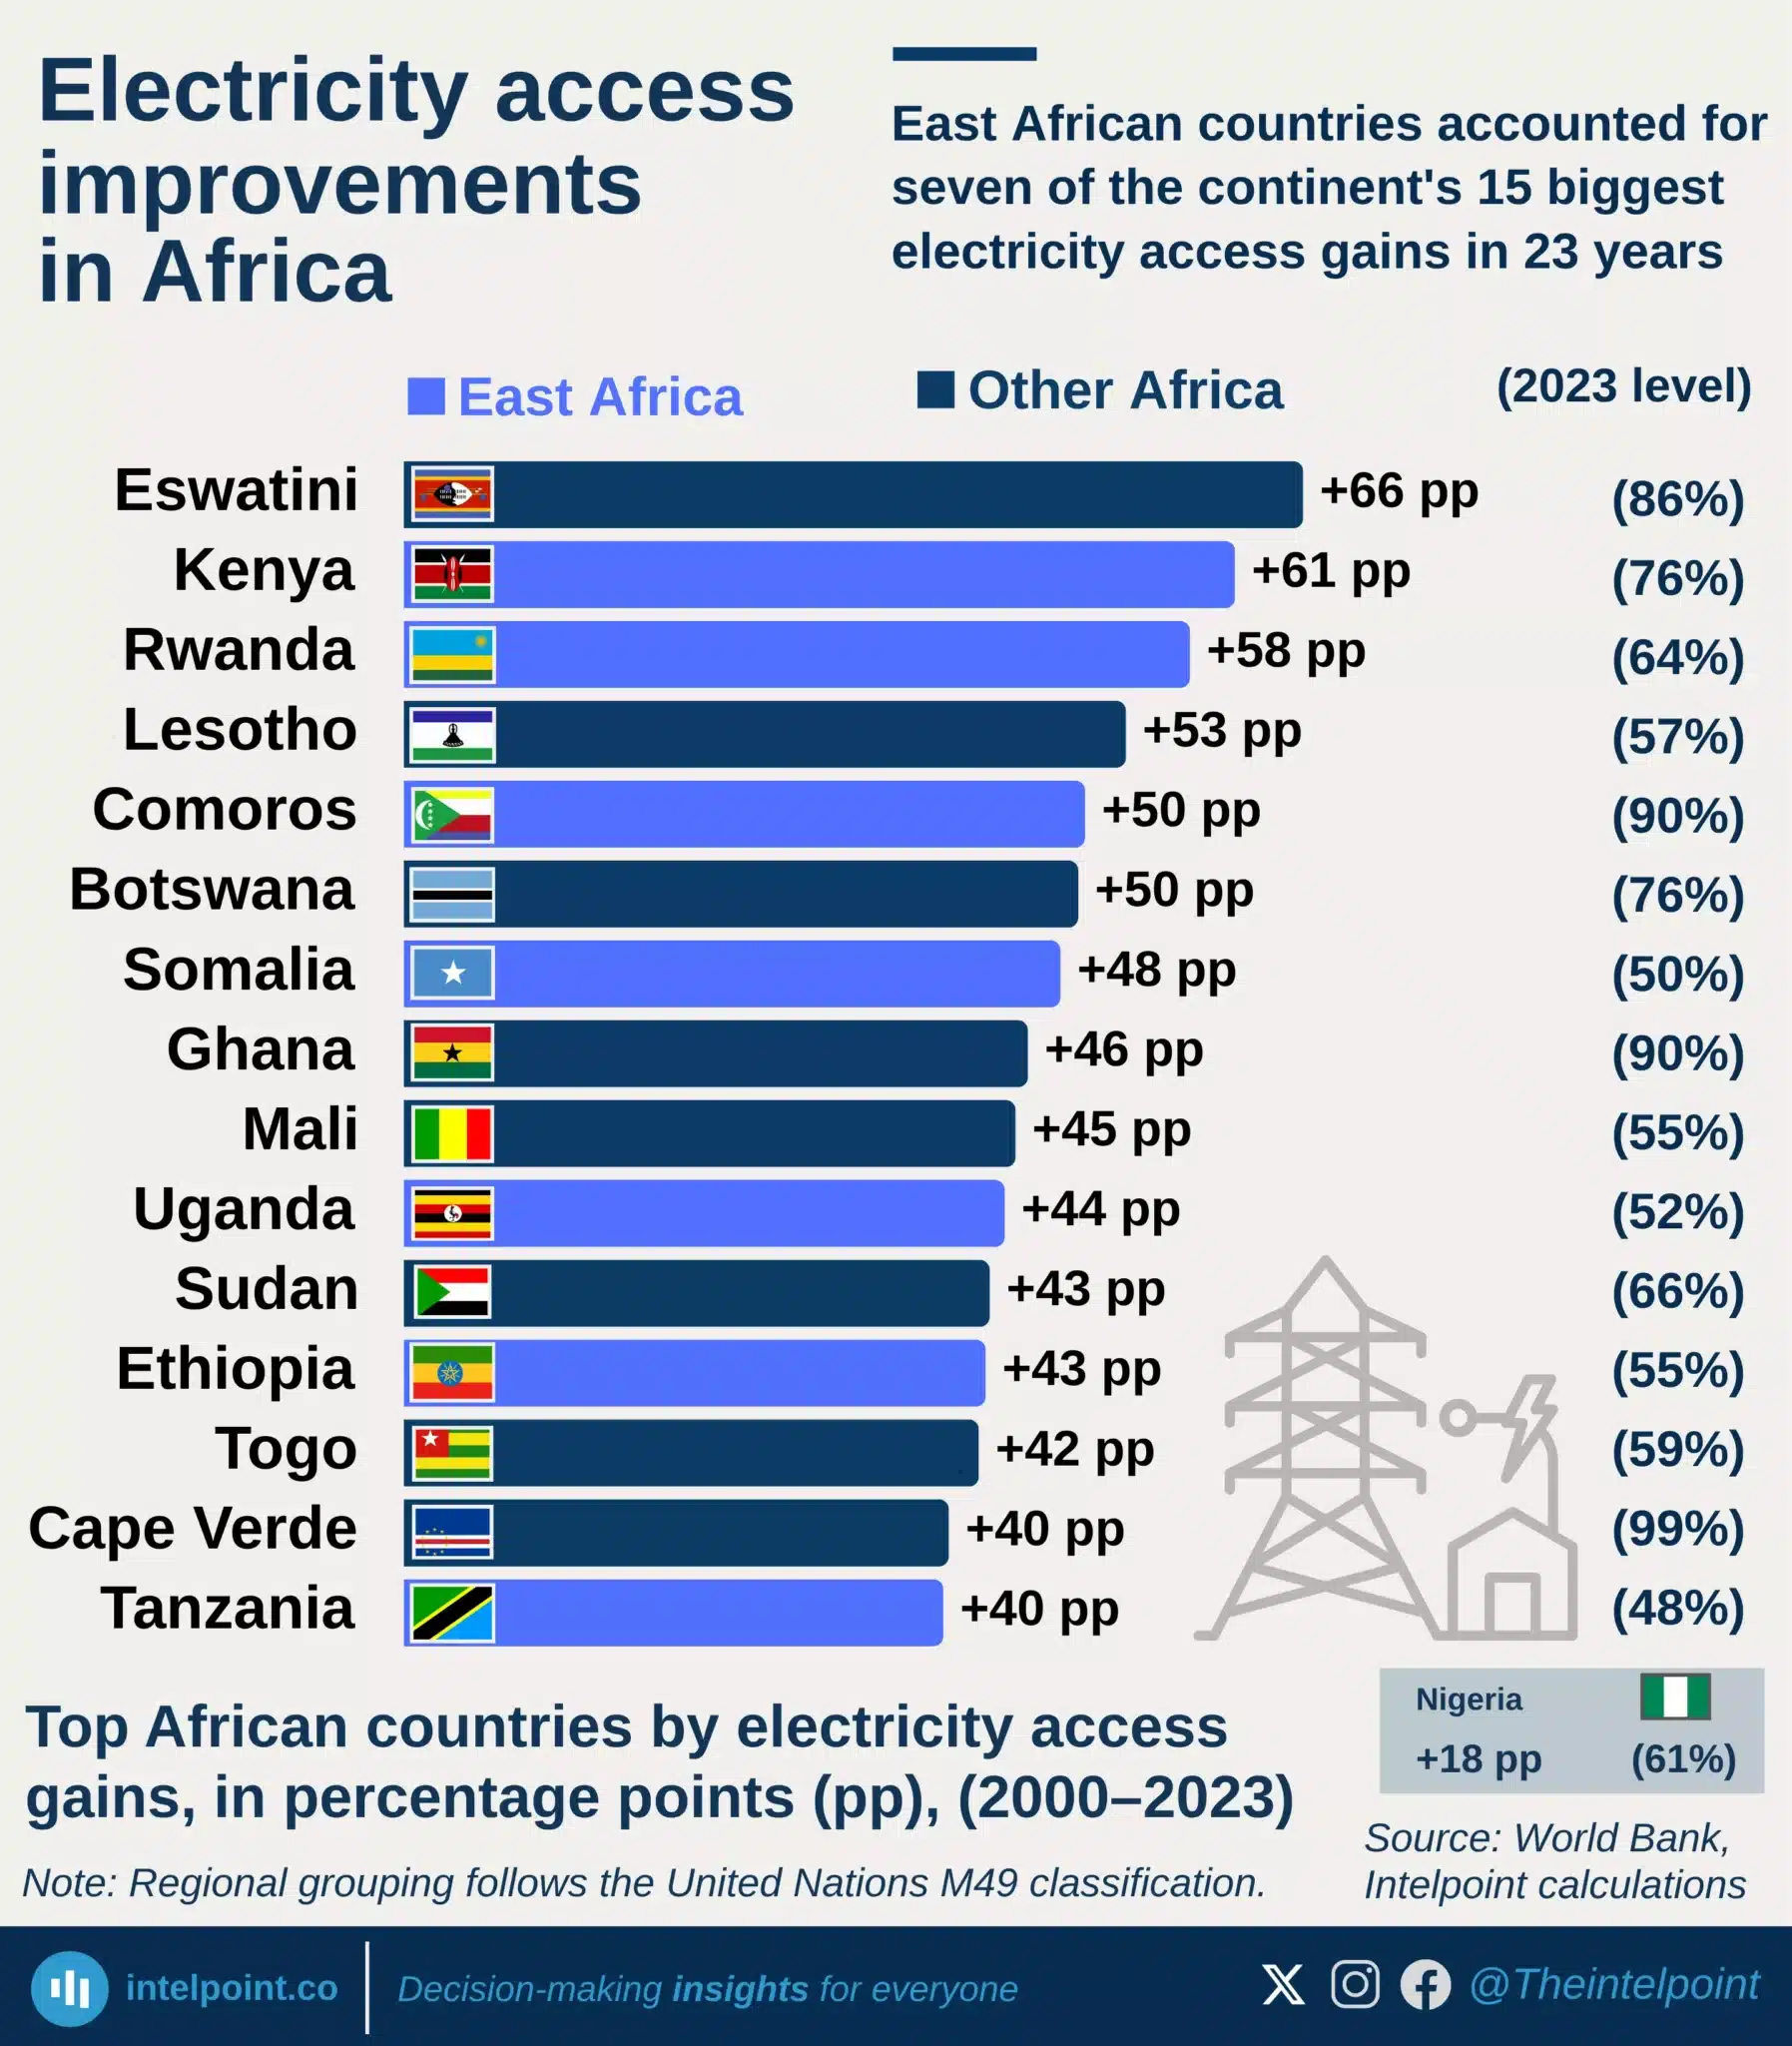
East African countries accounted for seven of the continent's 15 biggest electricity access gains in 23 years
  • Eswatini recorded Africa’s largest electricity access gain, rising by 66 percentage points from 2000 to 2023.
  • Kenya and Rwanda followed with gains of 61 pp and 58 pp, respectively.
  • East African countries accounted for 7 of Africa’s top 15 electricity access improvements.
  • Comoros, Ghana and Cape Verde reached very high access levels by 2023, at 90%, 90% and 99% respectively.
  • Nigeria’s electricity access improved by 18 percentage points, from 43% in 2000 to 61% in 2023.
  • Despite that improvement, Nigeria remained outside Africa’s top 15 gainers over the period.
  • Some countries were absent from the ranking because they had already reached high access levels by 2000.

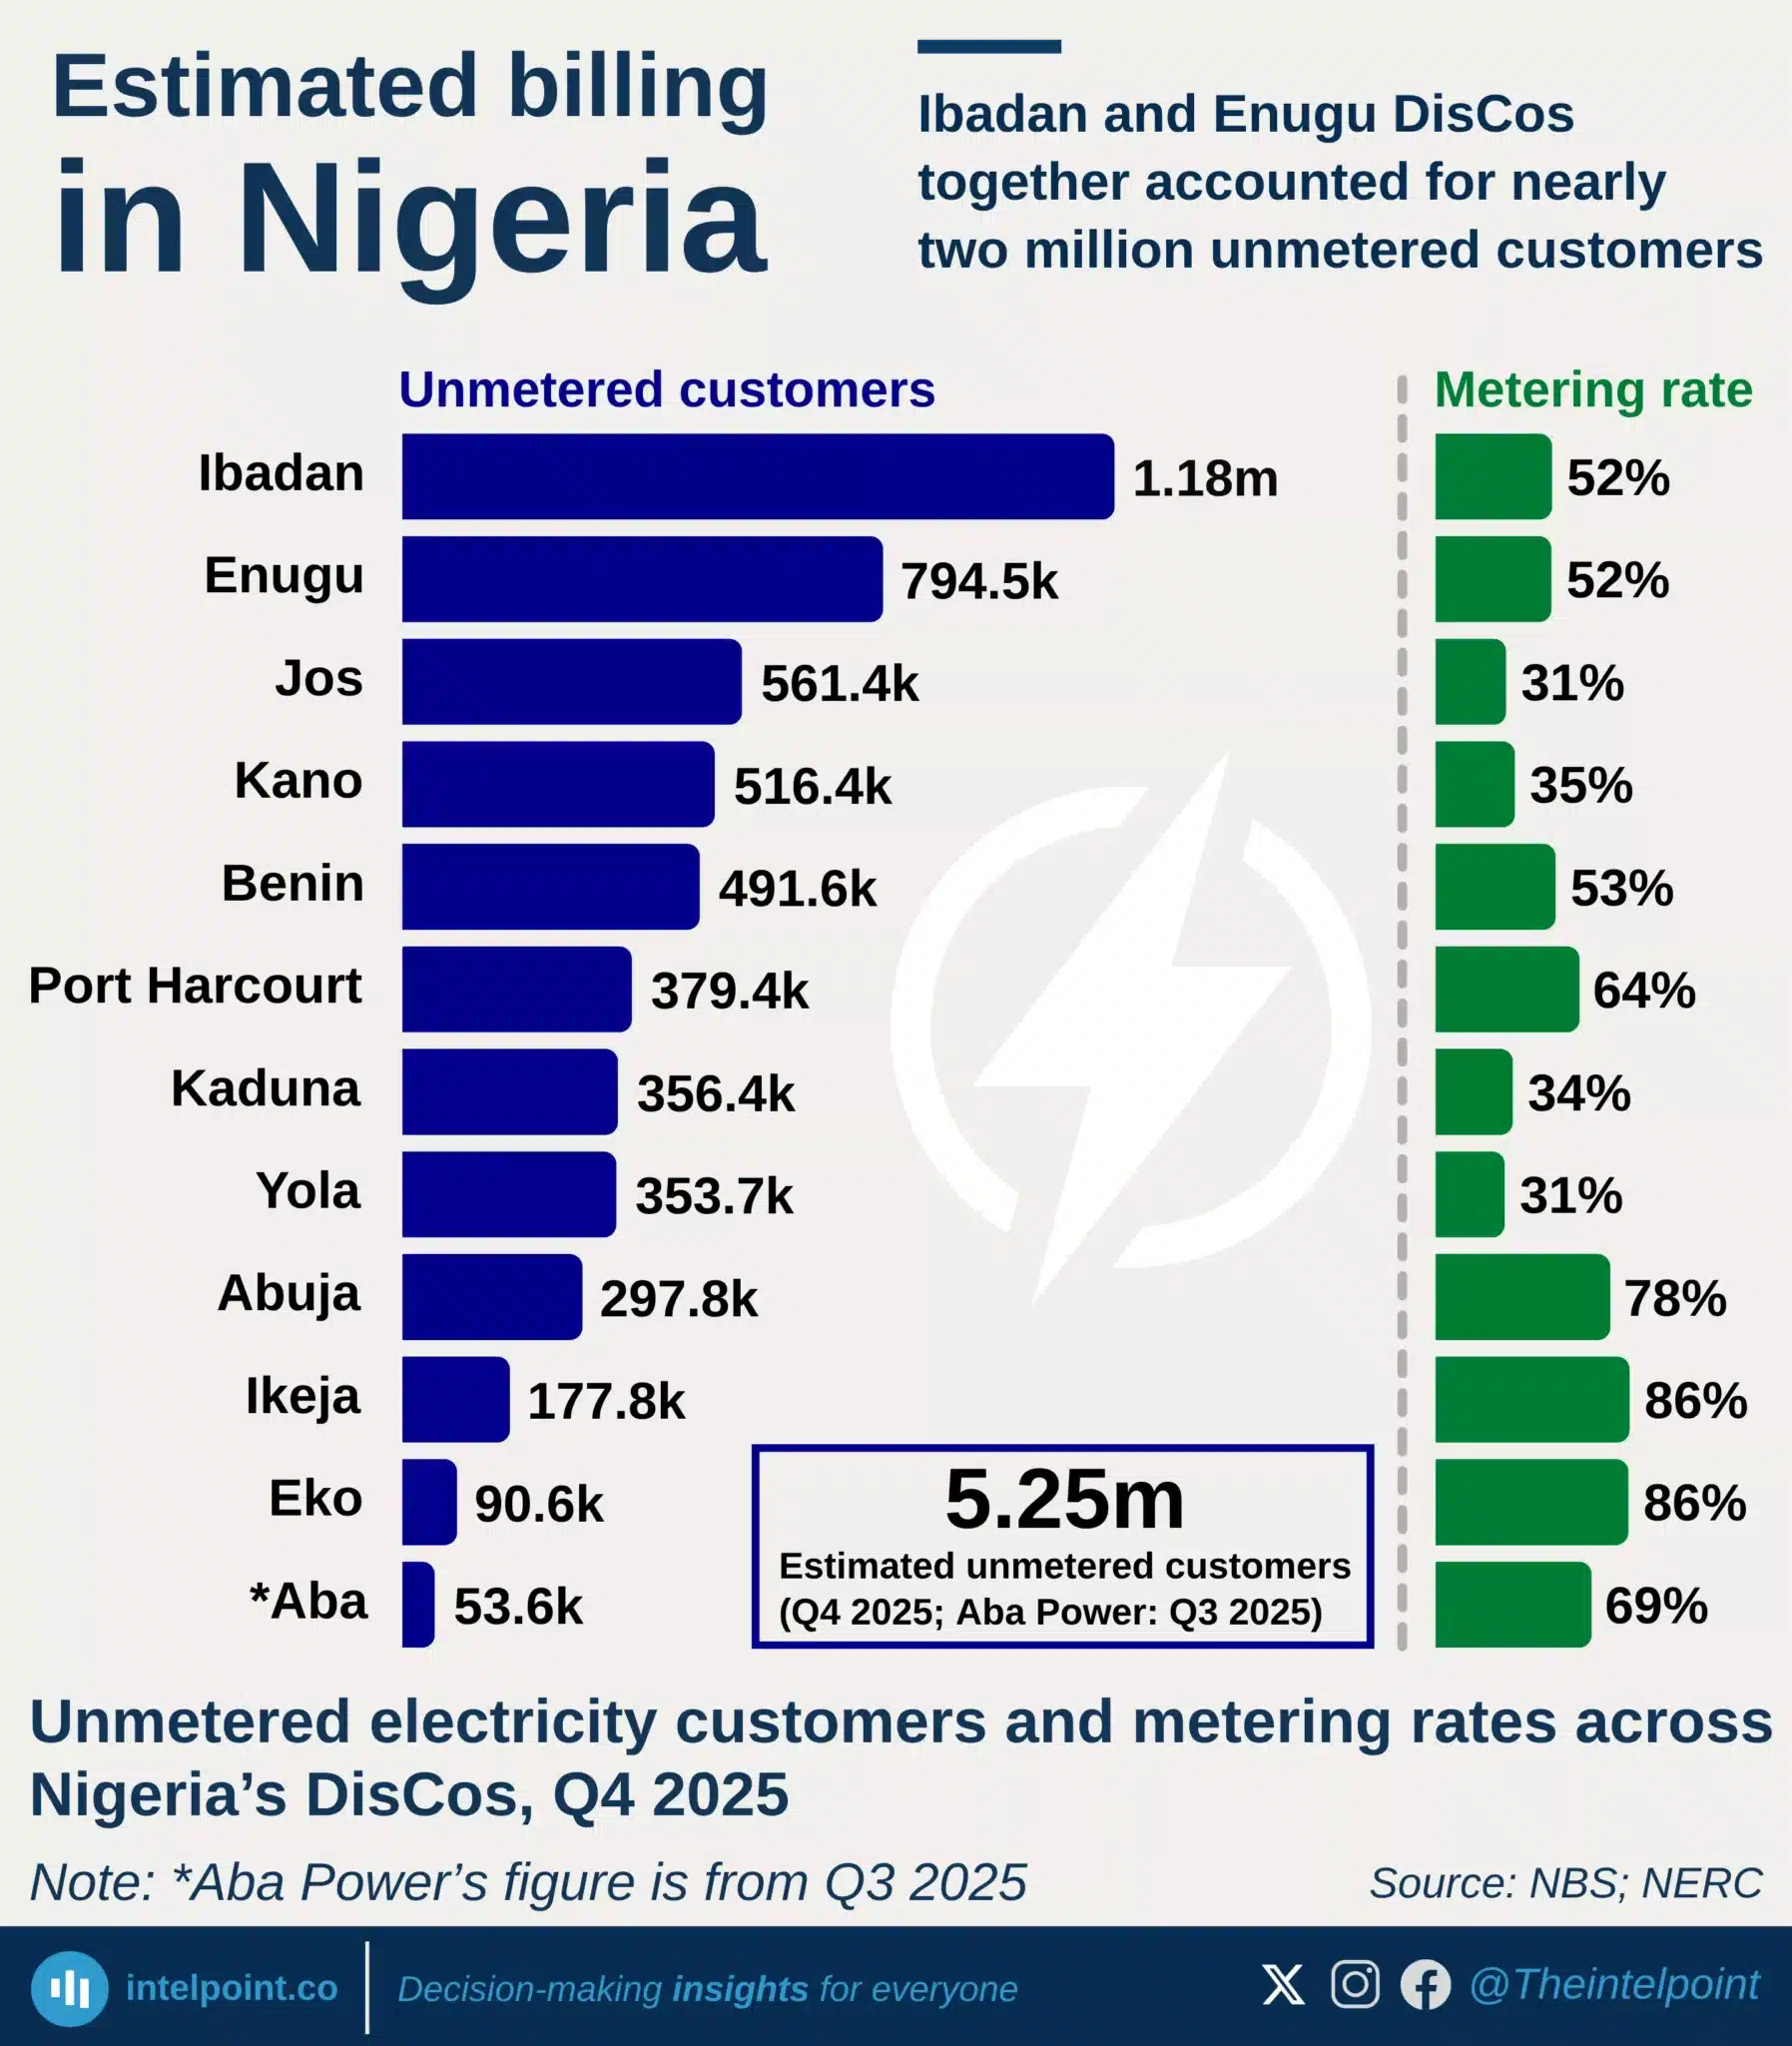
Ibadan and Enugu DisCos together accounted for nearly two million unmetered customers
  • Nigeria still had about 5.25 million unmetered electricity customers across DisCos.
  • The 11 DisCos reported in Q4 2025 had 5.20 million unmetered customers.
  • Nigeria’s reported metering rate stood at 57.3% as of Q4 2025.
  • Ibadan and Enugu had the largest gaps, with nearly two million unmetered customers combined.
  • Ibadan alone had 1.18 million unmetered customers, the highest of any DisCo.
  • Ikeja and Eko had the strongest metering performance, both at about 86%.
  • At the 2025 pace of meter additions, closing the current gap could take close to seven years.

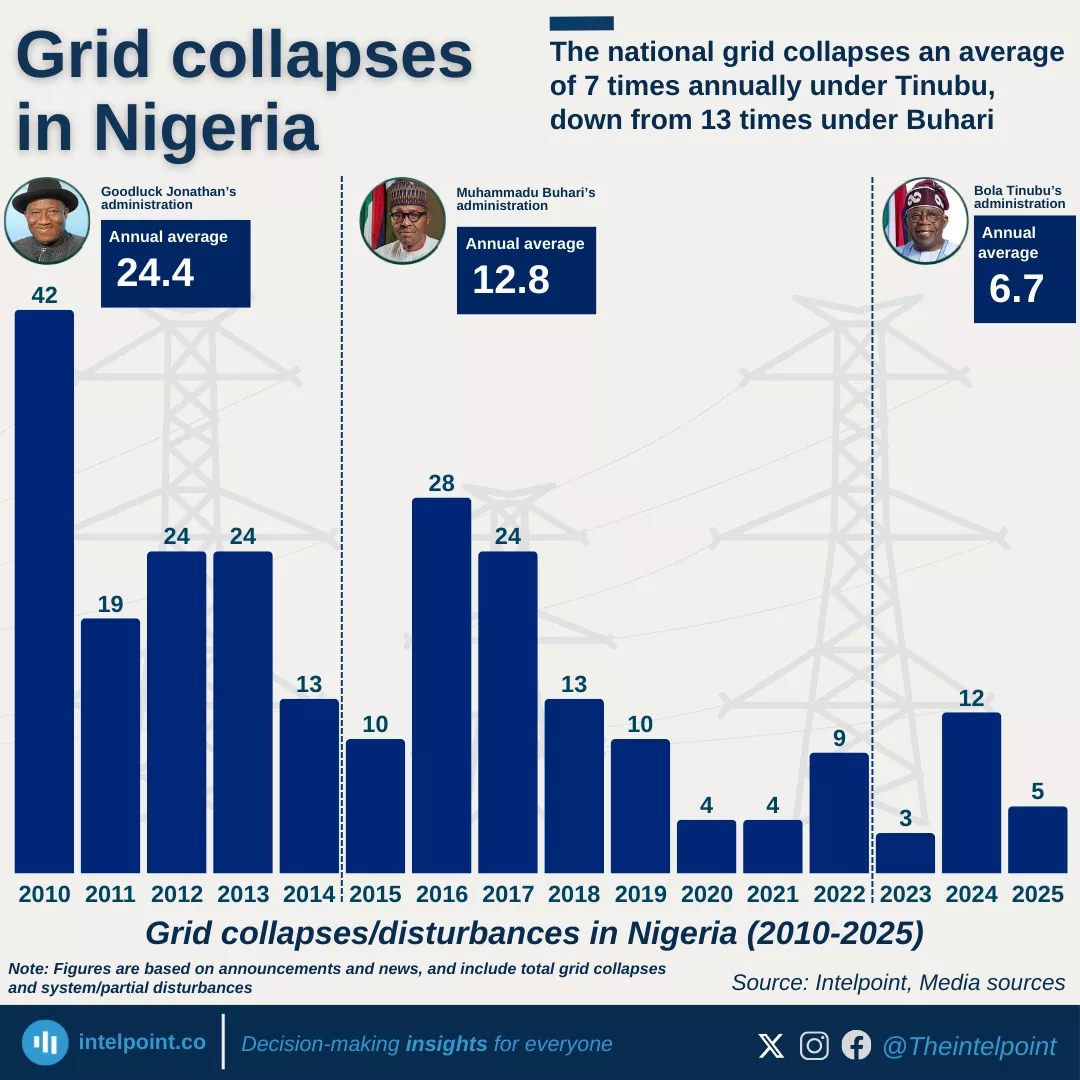
The national grid collapses an average of 7 times annually under Tinubu, down from 13 times under Buhari
  • The highest number of grid collapses in the past 16 years occurred in 2010, with 42 incidents recorded.
  • During Goodluck Jonathan’s administration, Nigeria’s grid collapsed an average of 24.4 times a year, the highest among the three administrations.
  • Under Muhammadu Buhari, the annual average dropped to 12.8 collapses per year, indicating improved grid stability compared to earlier years.
  • Under Bola Ahmed Tinubu, the average has fallen further to about 6.7 collapses annually.
  • 2016 recorded the highest number of collapses during the Buhari administration, with 28 incidents.
  • The most stable years in the dataset were 2020 and 2021, with only four collapses each.

Nigeria’s power grid is 69.9% powered by thermal plants
  • Thermal energy dominates Nigeria’s grid, supplying 69.9% of total power.
  • Hydro plants contribute 30.1%, making them the country’s second major source.
  • The heavy reliance on thermal generation shows Nigeria’s grid is still largely fossil-fuel driven.
  • Hydro remains a crucial but secondary source, supporting overall supply stability.

Nigeria's DisCos recorded ₦360bn revenue gap after collecting ₦1.12tn from ₦1.49tn billed in H1 2025
  • DisCos billed approximately ₦1.49 trillion but collected only ₦1.12 trillion in H1 2025.
  • Ikeja and Eko DisCos generated the highest revenues, collecting ₦206.22 billion and ₦210.59 billion, respectively.
  • Revenue collection gaps remain significant, with Jos, Kaduna, and Yola posting the weakest collection performances.
  • The wide gap between billings and actual collections suggests persistent challenges in customer payment compliance, metering, and distribution efficiency.

Nigeria has installed 3.65 million electricity metres since 2019; Ikeja DisCo leads with 823,000, and Aba Power at the bottom with 56,000
  • Approximately 3.65 million metres have been installed nationwide across all frameworks since 2019.
  • Ikeja DisCo leads by a wide margin with 823,000 installations, over twice the volume of most other DisCos.
  • Kaduna, Yola, and Aba Power recorded the lowest metre installations, each below 100,000.
  • The disparities in installation totals reveal uneven progress in achieving nationwide metering coverage.

POPULAR TOPICS
SIGN UP TO OUR NEWSLETTER
Get periodic updates about the African startup space, access to our reports, among others.
Subscribe Here
Subscription Form

A product of Techpoint Africa. All rights reserved