From 45% to 2%: How Nigeria lost its global palm oil production share to Asia

  • Indonesia dominated with 46.8M tonnes in 2022, up from 145.7 ktonnes in 1961
  • Malaysia was the second-largest producer in 2022 with 18.5M tonnes
  • Global production has increased from under 2M tonnes (1961) to over 75M tonnes (2022)
  • Thailand, Colombia, and Guatemala have emerged as major producers in recent decades
  • Nigeria was historically significant, but has been overtaken by Asian producers

In 1961, Nigeria dominated the global palm oil market with 669 ktonnes, far ahead of Malaysia’s 95 ktonnes and Indonesia’s ktonnes, accounting for over 45% of the world's output. But while Nigeria relaxed, Malaysia and Indonesia invested in large plantations, subsidies, and technology, sparking an agricultural revolution.

By 1980, Malaysia had surged to 2.57M tonnes, Indonesia to 800 ktonnes, while Nigeria stagnated at around 700 ktonnes due to the oil boom, weak infrastructure, and political instability. By 2000, Indonesia reached 7M tonnes, then 21.9M tonnes by 2010, and 46.8 M tonnes by 2022, recording a 321-fold increase. Malaysia followed with 18.5M tonnes. Together, they now account for 87% of the global supply.

Nigeria, meanwhile, grew only to 1.42M tonnes by 2022, barely double its 1961 numbers, despite ideal conditions. New entrants like Thailand (3.2M tonnes), Colombia (1.76M tonnes), and Guatemala (940 ktonnes) have overtaken it.

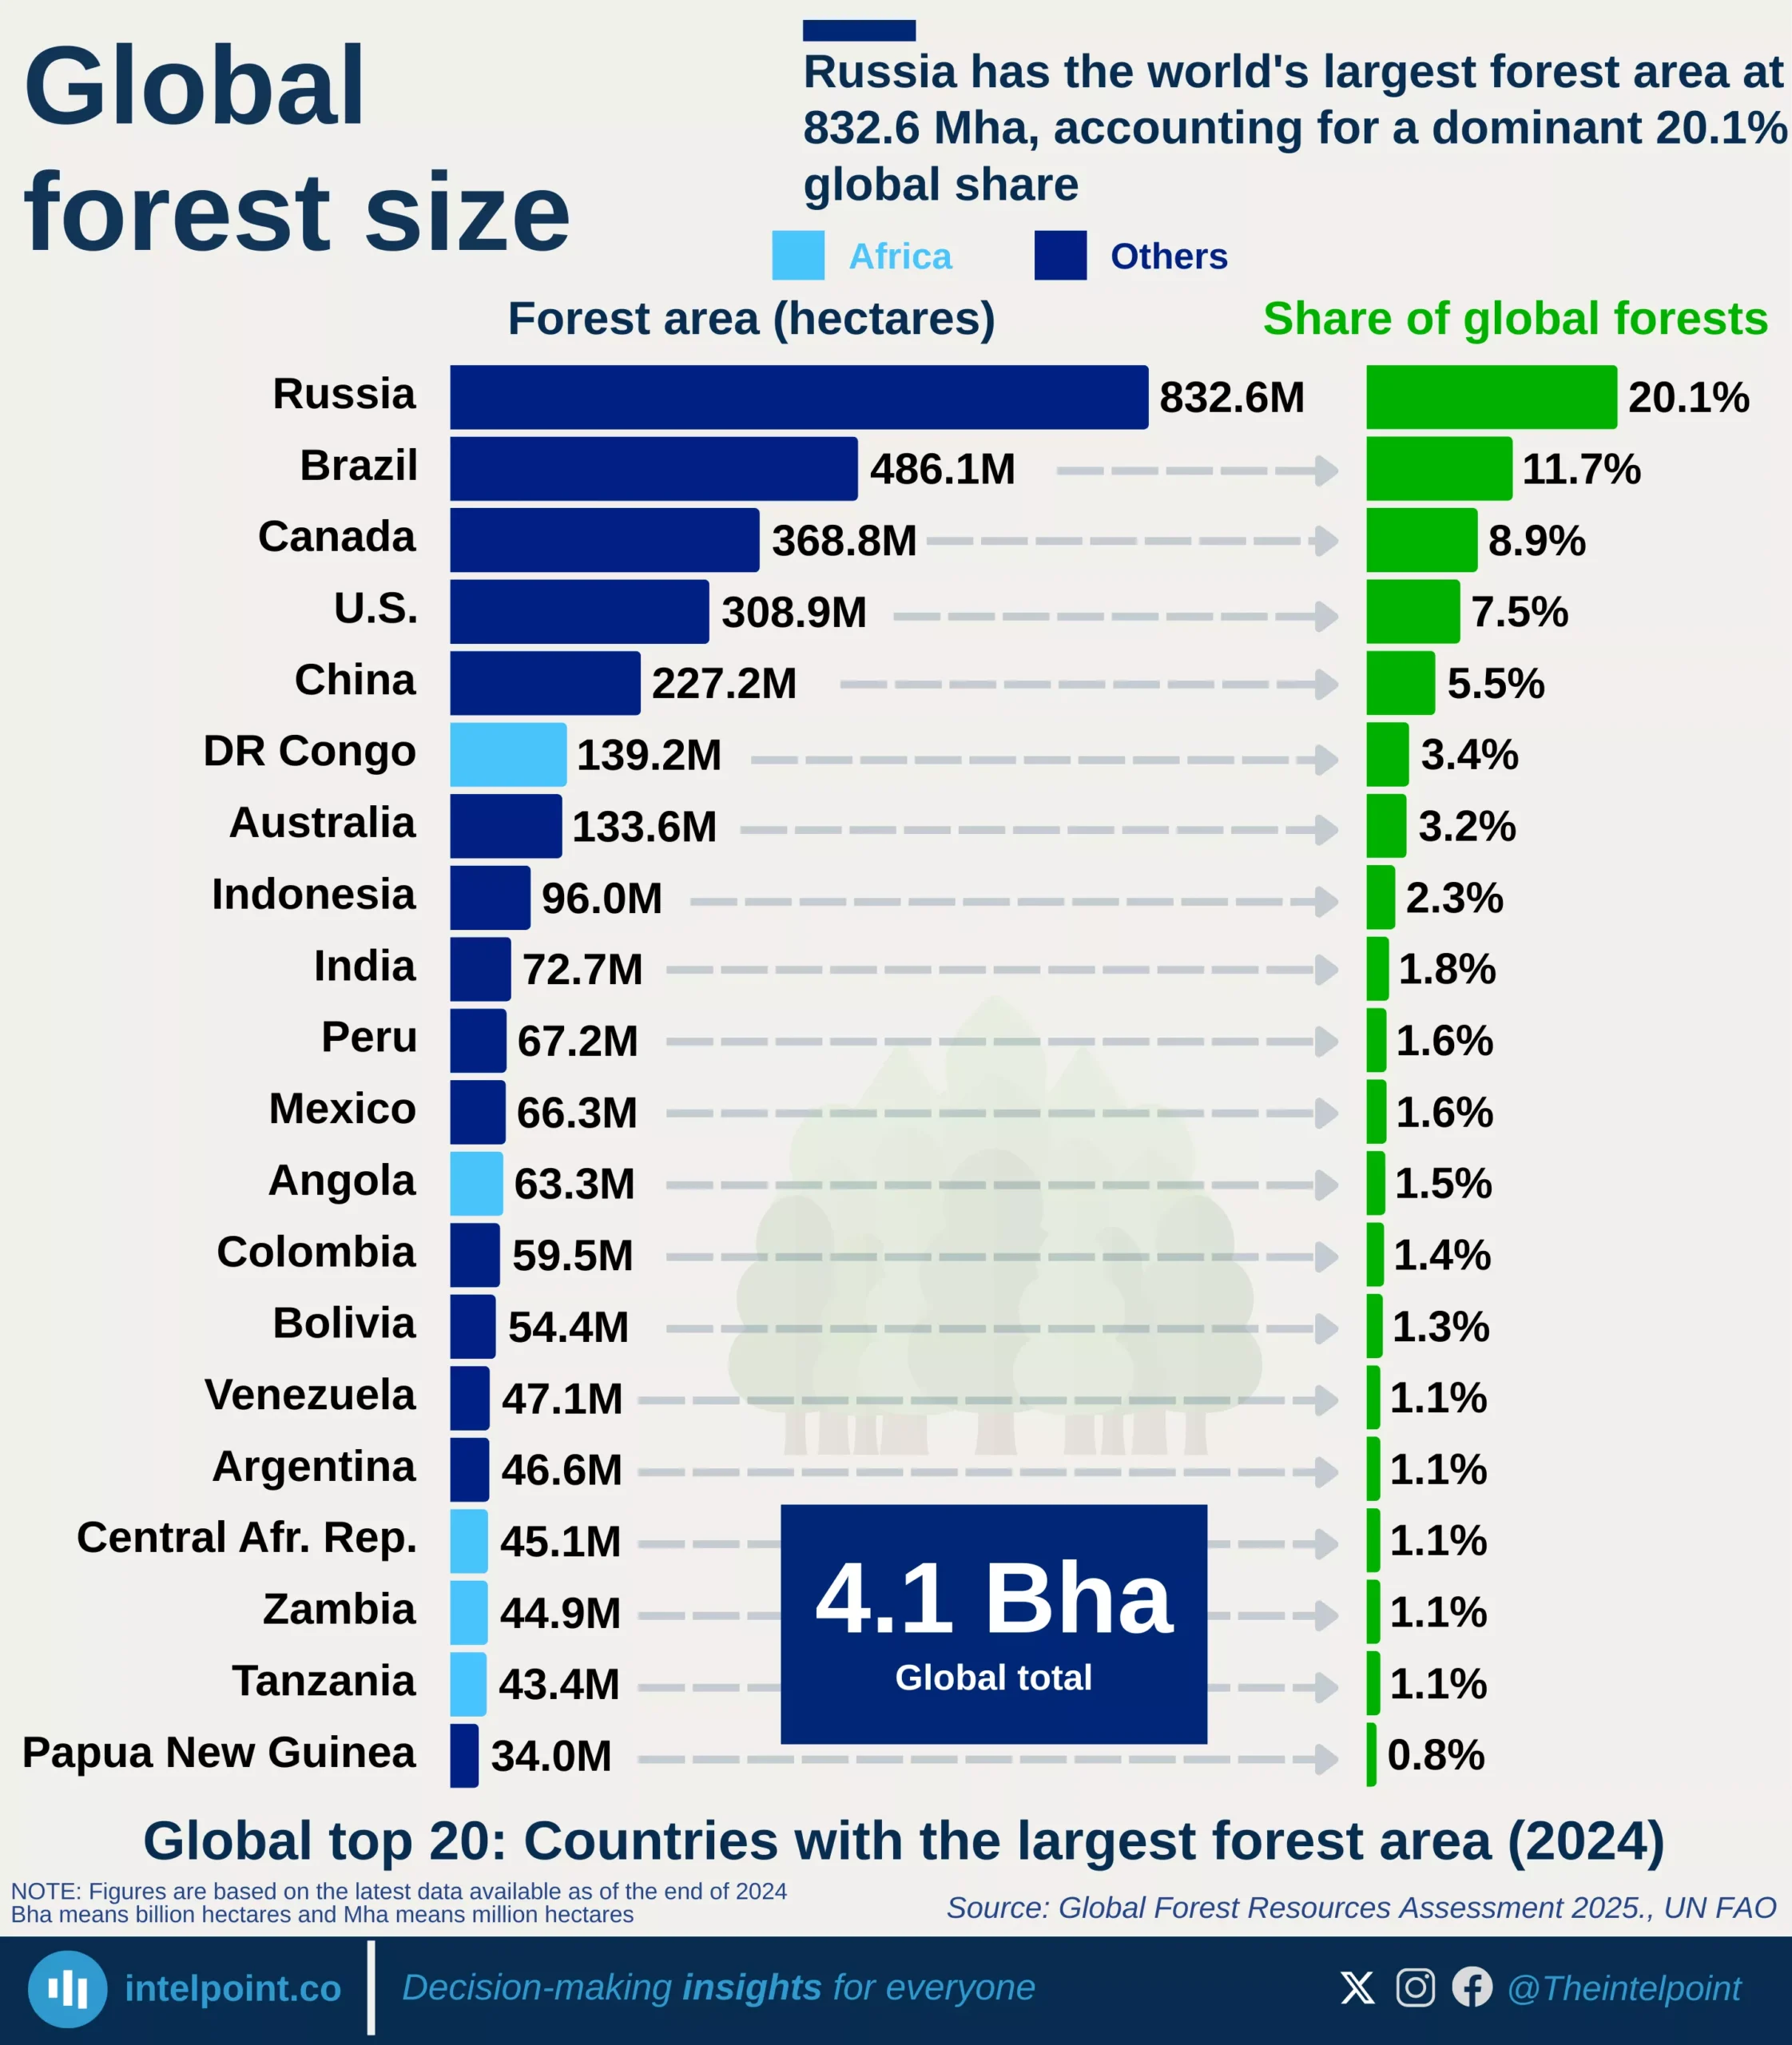
Today, Africa contributes less than 5% of global production, despite holding 20% of the world's suitable land.

Source:

Food and Agriculture organization of the UN

Period:

1961-2022
HTML code to embed chart
Want a bespoke report?
Reach out
Tags
Related Insights

Over one-fourth of Asia’s forests were in legally established protected areas as of 2024
  • Asia leads globally with 26% of its forests in legally protected areas.
  • The global average stands at 20%, meaning that one-fifth of all forests are under some form of legal protection.
  • Africa and Europe are tied at 23%, both above the global average.
  • South America has only 17% of its forests protected, despite being home to the Amazon rainforest.

Russia has the world's largest forest area at 832.6 Mha, accounting for a dominant 20.1% global share
  • Global forest cover is 4.1 Bha, according to the latest FAO assessment.
  • At 832.6 Mha, 20.1% of the global total, Russia has the world’s largest forest area.
  • Brazil (486.1 Mha; 11.7%) and Canada (368.8 Mha; 8.9%) rank second and third, respectively.
  • The United States (7.5%) and China (5.5%) complete the global top five.
  • Africa’s top contributor is the Democratic Republic of Congo, with 139.2 Mha, 3.4% of the global total.
  • Other African countries in the top 20 include Angola, Zambia, Tanzania, and the Central African Republic, each accounting for approximately 1% of the global forest area.
  • Together, the top ten countries account for over 78% of the world’s total forest area, highlighting the global concentration of forest resources.

Yams produced in Nigeria in 2023 were valued at $25.4b, the highest among major reported commodities
  • After yielding 61.9 million tonnes, yams were valued at $25.4 billion in 2023, the highest among reported commodities.
  • With 62.7 million tonnes produced, cassava generated $9.1 billion, making it the second most valuable crop.
  • Okra ($818/t), tomatoes ($808/t), and pineapples ($753/t) earned the highest returns per unit despite smaller volumes (1.6–3.8 million tonnes).
  • Maize ($3.7 b, 11.1 m t), rice ($3.1 b, 8.9 m t), sorghum ($2.3 b, 6.4 m t), cowpeas ($1.2 b, 4.3 m t), and groundnuts ($0.9 b, 4.3 m t) form the backbone of production.

Nearly one in six of Africa’s goats are in Nigeria, the continent’s leader since 1998
  • Africa’s goat population grew from 94 million in 1961 to 522 million in 2023 — more than a fivefold increase.
  • The continent’s share of the world’s goats rose from 27% in 1961 to 46% in 2023.
  • Nigeria leads with nearly 89 million goats in 2023, holding the top spot since 1998.
  • Ethiopia, Chad, Sudan, Niger, and Mali consistently rank among the largest goat producers.
  • Around 70% of Africa’s goats are concentrated in the top ten countries each year.

Netherlands, US, and Germany dominated cocoa imports from 1961 to 2023
  • Netherlands imported the most cocoa beans — 25.48 million tonnes (1961–2023)
  • US (21.1M) and Germany (16.8M) followed in total volume
  • These three countries dominated the top 5 nearly every year
  • Malaysia, UK, France, and Belgium also ranked high over time
  • USSR stayed in the top 10 despite dissolving in 1991
  • Global cocoa imports grew from 1M tonnes in 1961 to nearly 4M in 2023

Between 1961 and 2022, African wine production decreased by 43%, with recent years’ production levels falling below the volume in the 1960s and 1970s
Key Takeaways:
  • African wine production peaked in 1965 at 2.39 million tonnes, the highest level recorded during the entire period.
  • The most dramatic single-year drop occurred between 1965 and 1966, when production fell by 40%, from 2.39 to 1.44 million tonnes.
  • A gradual recovery began in the early 2000s, with production consistently exceeding 1 million tonnes from 2003 onward.
  • The most recent peak occurred in 2021, with production reaching 1.23 million tonnes, a 48.5% decline from the 1965 high.
  • Despite this partial recovery, current production levels remain well below the highs of the 1960s.
  • As of 2022, African wine production stood at 1.16 million tonnes, representing a 43% decrease from 1961.

POPULAR TOPICS
SIGN UP TO OUR NEWSLETTER
Get periodic updates about the African startup space, access to our reports, among others.
Subscribe Here
Subscription Form

A product of Techpoint Africa. All rights reserved