After years of volatility, Nigeria’s crude oil production has increased in four consecutive quarters, rising to 1.68 mbpd in Q2 2025

Key Takeaways

  • Production dipped sharply in 2022, with the steepest quarterly decline of –16.08% in Q3, before recovering at year-end.
  • 2023 marked a rebound year, highlighted by strong quarterly growth of 18.85% in Q3, lifting production back above 1.5 mbpd.
  • 2024 showed relative stability, with modest fluctuations; production only briefly fell below 1.5 mbpd before gradually recovering.
  • By Q2 2025, output hit 1.68 mbpd, the highest in the series, supported by consistent growth in three straight quarters.

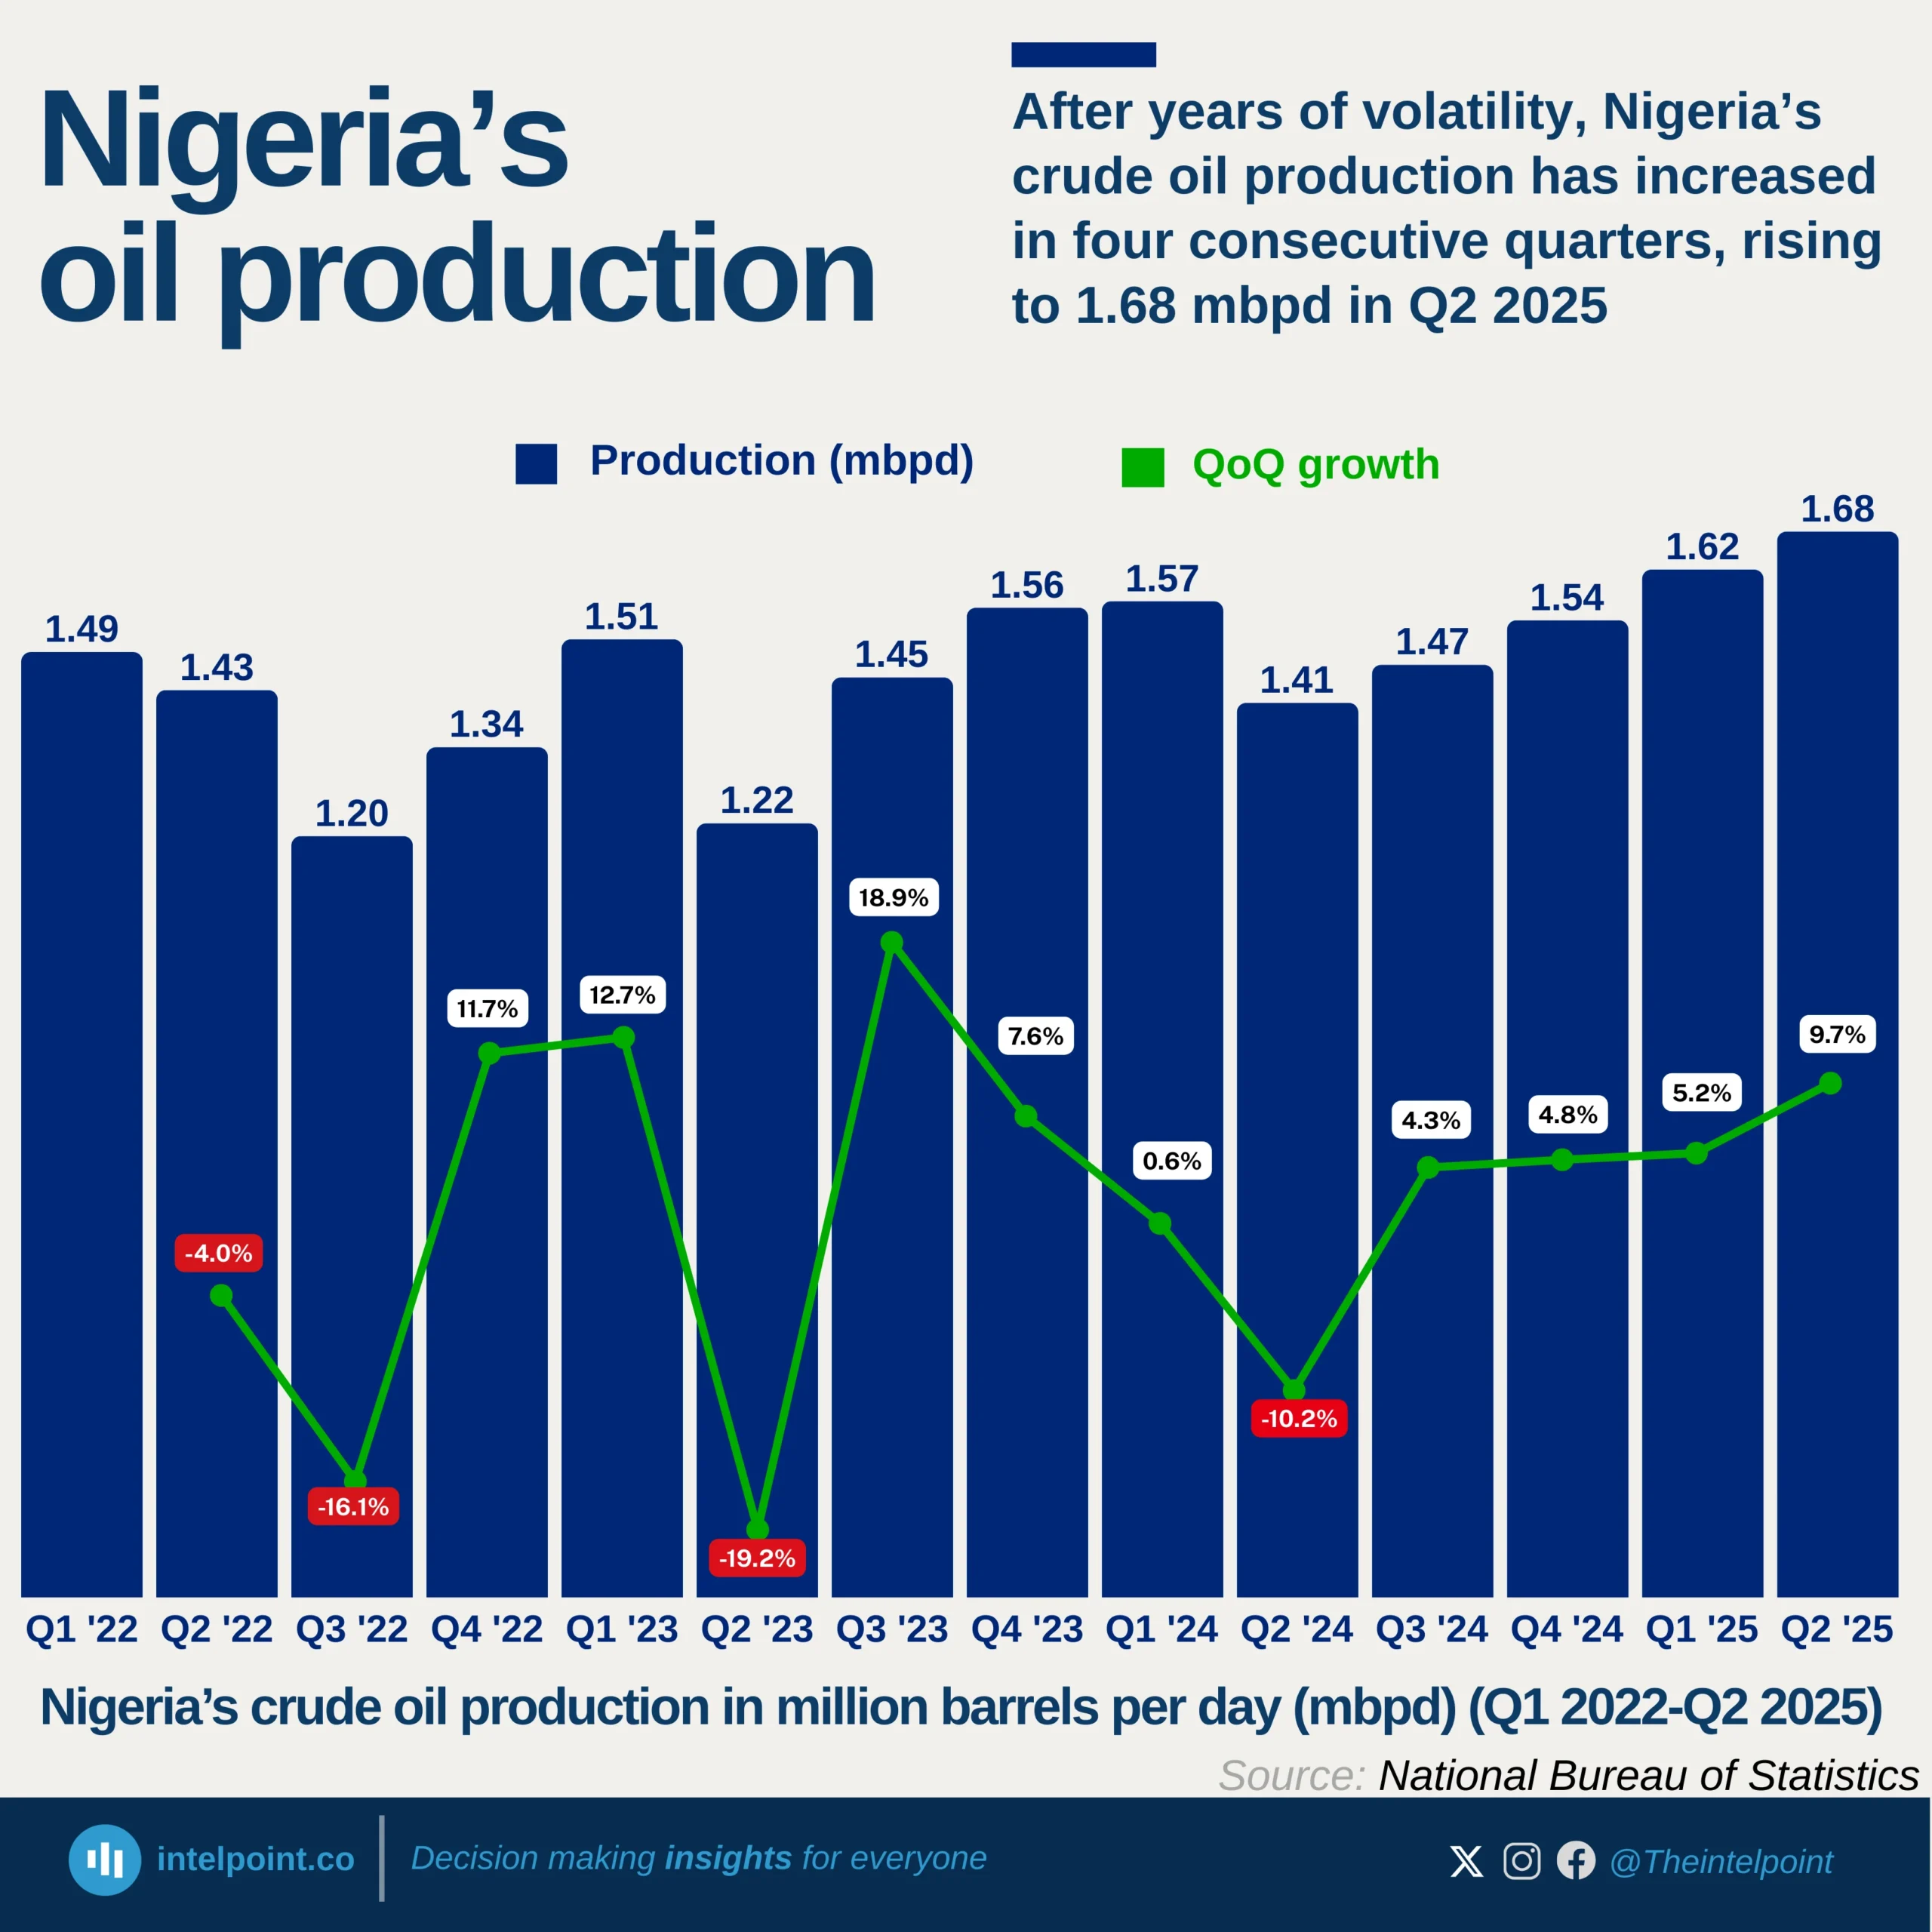
Nigeria’s crude oil production between Q1 2022 and Q2 2025 reflects a cycle of volatility followed by gradual recovery. In 2022, production struggled, dropping from 1.49 mbpd in Q1 to just 1.20 mbpd in Q3—the lowest point of the period—before closing the year with a partial rebound. The following year, 2023, saw a strong recovery, particularly in Q3 when output surged by nearly 19% quarter-on-quarter, pushing production back toward pre-decline levels.

In 2024, output growth was more subdued, fluctuating within a narrow range as Nigeria stabilised production despite challenges from pipeline issues and OPEC quota pressures. Entering 2025, the sector gained momentum again: three consecutive quarters of positive growth lifted production to 1.68 mbpd by Q2, its highest point in over three years. This trend suggests Nigeria may be consolidating gains from reforms and improved security in oil-producing regions, signalling cautious optimism for sustained output.

Source:

National bureau of statistics

Period:

Q1 2022 to Q2 2025
HTML code to embed chart
Want a bespoke report?
Reach out
Tags
Related Insights

Trade and agriculture led Nigeria’s ₦51.20 trillion economy in Q2 2025, as oil’s share remained modest
  • Trade contributed 18.28%, making it the largest sector in Q2 2025's GDP.
  • Crop production followed with 17.8%, underscoring agriculture’s central role.
  • Oil and gas added just 4.05%, highlighting its shrinking share compared to non-oil sectors.
  • Real estate and telecoms reinforced the growing strength of services in the Nigerian economy.

Nigerian nationals received 880 H-1B visas in FY 2024, with the highest number of approvals recorded in December 2023
  • Nigeria received a total of 880 H-1B visas in FY 2024, averaging about 73 per month.
  • December 2023 was the peak month, with 118 issuances, while June 2024 recorded the lowest at just 46.
  • Issuances fluctuated throughout the year, reflecting no clear upward trend but significant month-to-month volatility.
  • Despite peaks and dips, overall activity remained steady, with most months ranging between 60–90 approvals.

Nigeria’s H-1B visa approvals hit a record 880 in 2024 following the decline during the COVID-19 pandemic
  • 2024 recorded the highest number of H1-B issuances to Nigerians at 880, nearly double 2022’s level.
  • Issuances dropped sharply to 231 in 2020 and 197 in 2021, marking the lowest levels in nearly two decades.
  • Between 2006 (483) and 2017 (354), there was a gradual decline in approvals before a steeper fall in 2020.
  • From 2021 to 2024, issuances surged by more than 340%, suggesting strong demand for U.S. tech and professional opportunities among Nigerians.

Manufactured goods drove imports as oil products pushed total to ₦15.29 trillion in Q2 2025
  • ₦7.88 trillion worth of manufactured goods made up 51.6% of imports, underscoring Nigeria’s dependence on foreign industrial products.
  • Other petroleum oil products accounted for ₦2.79 trillion (18.2%) of imports, showing continued reliance on external energy supplies despite Nigeria’s oil-rich status.
  • ₦1.72 trillion in raw material imports (11.3%) highlights the gap in local processing capacity.
  • Solid minerals (₦70.9 bn, 0.46%) and energy goods (₦150 mn, almost 0%) show almost no role in imports.

Nigeria’s foreign trade hit ₦38 trillion in Q2 2025, driven by strong export growth
  • Total trade in Q2 2025 was valued at ₦38.04tn.
  • Imports accounted for ₦15.29tn, led by manufactured goods and petroleum products.
  • Exports reached ₦22.75tn, boosted mainly by crude oil.
  • The trade gap favoured Nigeria with a surplus of ₦7.46tn.

Financial services dominated Nigeria’s $1.5bn digital services exports in 2024
  • Financial services dominate Nigeria’s digitally delivered exports, contributing $1.15bn (over 74%).
  • Telecommunications ($184m) and insurance & pension services ($147m) follow, though far smaller.
  • Computer, information, and IP services registered almost no exports, highlighting untapped digital potential.
  • Nigeria’s digital exports remain highly concentrated in finance, leaving other sub-sectors underdeveloped.

POPULAR TOPICS
SIGN UP TO OUR NEWSLETTER
Get periodic updates about the African startup space, access to our reports, among others.
Subscribe Here
Subscription Form

A product of Techpoint Africa. All rights reserved