South Africa, the only African country producing black liquor, recorded 16.4 PJ of energy content in 2023 — approximately 1% of the global total

Key takeaways:

  • The United States of America led the production of black liquor with 696.0PJ produced making up 38.9% of the global total produced in 2023.
  • South Africa is the only African country producing black liquor with 16.4PJ produced making up 1% of the global total.
  • The total amount of black liquor produced globally in 2023 was 1,787PJ.
  • Sweden, Canada, Finland and Japan produced 185.1PJ - 10.4%, 157.9PJ - 8.8%, 142.5PJ - 8.0% and 133.0PJ - 7.4% respectively.

Black liquor is the by-product from the kraft process when digesting pulpwood into paper pulp. It is a source of biofuel derived from organic, renewable biomass sources and a very important form of energy.

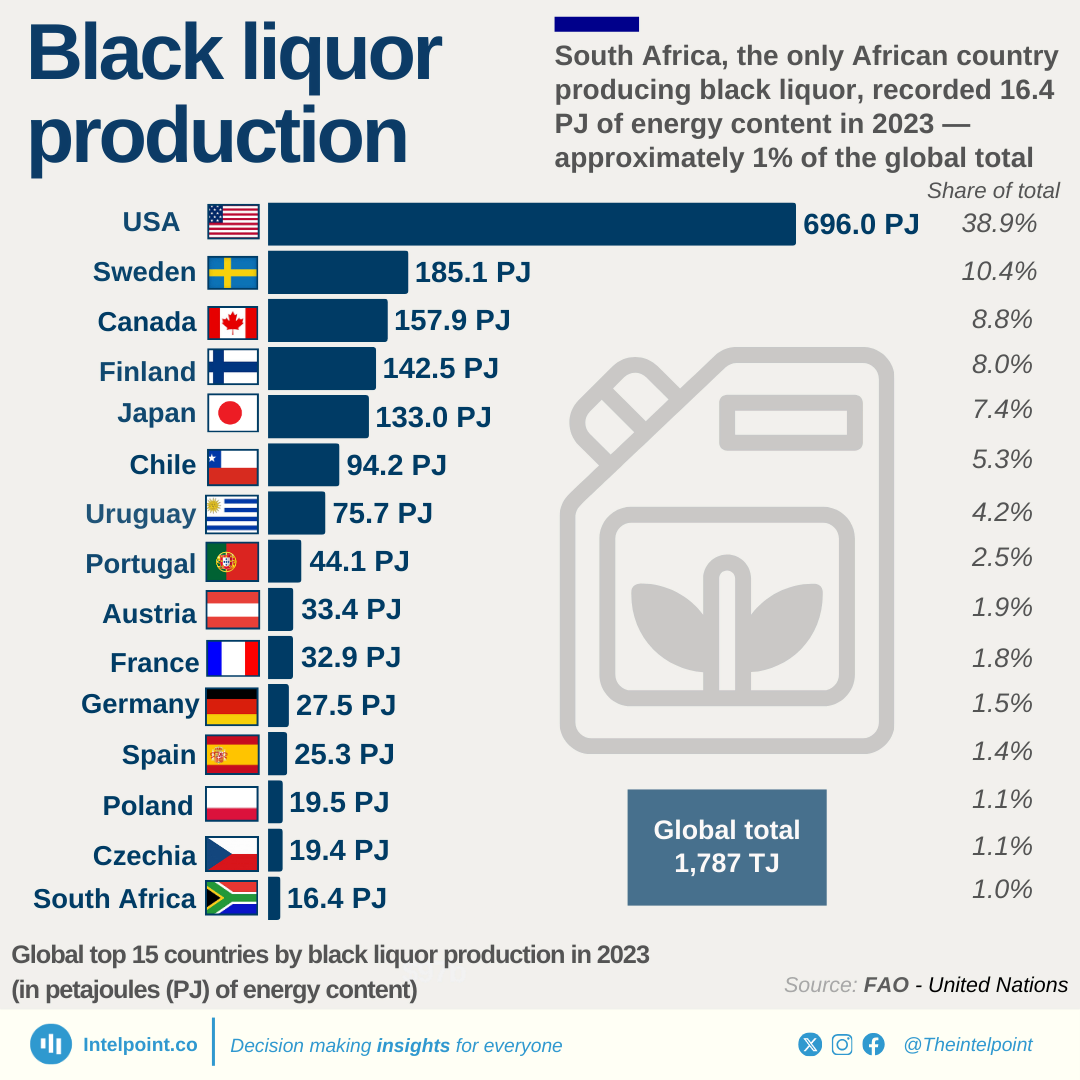
In 2023, the United States of America led the production of black liquor with 696.0PJ (petajoules) produced, making up 38.9% of the total quantity produced globally. Sweden, Canada, Finland and Japan produced 185.1PJ (10.4%), 157.9PJ (8.8%), 142.5PJ (8.0%), and 133.0PJ (7.4%), respectively.

South Africa is the only African country producing black liquor, with 16.4PJ produced, making up 1% of the global total. Comparing the growth of the pulp and paper industry in Africa with the fact that Africa produced only 1% of black liquor in 2023, it was revealed that there is a huge gap in the recycling of by-products, commonly called waste products, in Africa.

Source:

Food and Agriculture Organization of the United Nations

Period:

2023
HTML code to embed chart
Want a bespoke report?
Reach out
Tags
Related Insights

Nigeria’s renewable energy capacity held steady at 2.1–2.3 GW from 2015 to 2021, then surged from 2022 onward
  • Nigeria’s renewable energy capacity grew from 2.1 GW in 2015 to 3.7 GW in 2024.
  • This represents a 76% increase over the decade.
  • The compound annual growth rate (CAGR) was 5.7% between 2015 and 2024.
  • From 2015 to 2020, capacity was stagnant at around 2.2 GW.
  • The biggest growth year was 2022, with a sharp 34.9% increase.
  • Capacity stagnated in 2023 at 3.1 GW before climbing again in 2024.
  • Nigeria’s renewable growth remains modest compared to its population size and energy demand.

From 2015 to 2024, Morocco's renewable capacity grew from 2.4 GW to 4.0 GW, a 67% increase
  • Morocco’s renewable energy capacity grew from 2.4 GW in 2015 to 4.0 GW in 2024.
  • This represents a 67% increase over the decade.
  • The compound annual growth rate (CAGR) was 5.3% between 2015 and 2024.
  • Capacity was stagnant at 2.4 GW from 2015 to 2017 before growth resumed.
  • The biggest single-year increase happened in 2022, with a 13.7% jump.
  • Capacity additions slowed in 2023 (3.7 GW) and 2024 (4.0 GW).

From 2015 to 2024, South Africa's renewable energy capacity more than tripled, from 3.4 GW to 13.5 GW
  • South Africa’s renewable energy capacity grew from 3.4 GW in 2015 to 13.5 GW in 2024.
  • The country recorded a CAGR of 14.7% over the period.
  • The biggest annual growth was in 2016, when capacity surged by 49.2%.
  • Stagnation occurred in 2021 (0.8% growth) and 2023 (0.0%), reflecting project delays or policy issues.
  • The most recent increase was in 2024, when capacity rose to 13.5 GW, showing renewed momentum.
  • South Africa’s renewable energy capacity is more than three times Nigeria’s 3.7 GW in 2024.

From 2015 to 2024, Kenya's renewable capacity almost doubled, increasing from 1.6 GW to 3.1 GW
  • Kenya’s renewable energy capacity grew from 1.6 GW in 2015 to 3.1 GW in 2024.
  • This represents a near doubling of capacity in less than a decade.
  • The compound annual growth rate (CAGR) was 6.9% between 2015 and 2024.
  • The largest single-year jump came in 2016 with a 23.2% increase.
  • Kenya faced a setback in 2021 when capacity dipped by -8.6%.
  • A strong rebound occurred in 2022 (+15.5%), reaffirming momentum.

In 2024, Egypt’s renewable capacity reached 11.8 GW, up 5.6 GW from 2015
  • Egypt’s renewable capacity grew from 6.2 GW in 2015 to 11.8 GW in 2024.
  • This represents a net increase of 5.6 GW over the decade.
  • Egypt recorded a 6.5% compound annual growth rate (CAGR) from 2015 to 2024.
  • Between 2015 and 2019, growth was very slow, with capacity almost flat.
  • The turning point came in 2020, when expansion began to pick up pace.
  • The largest jump occurred in 2022, with a 26.3% year-over-year increase.
  • By 2024, Egypt’s renewable capacity was more than three times Nigeria’s 2024 level of 3.7 GW.

Ethiopia’s renewable energy capacity grew at an 8.6% compound annual rate from 2015 to 2024
  • Ethiopia’s renewable capacity grew from 2.6 GW in 2015 to 6.0 GW in 2024.
  • The country achieved an 8.6% compound annual growth rate over this period.
  • Ethiopia’s capacity is higher than Nigeria’s 3.7 GW in 2024, despite Nigeria’s larger economy.
  • The biggest surge occurred in 2017, with a 64.9% year-over-year increase.
  • Growth was steady but modest between 2017 and 2021, averaging small annual increments.
  • A slight dip occurred in 2023, but Ethiopia recovered to 6.0 GW in 2024.

POPULAR TOPICS
SIGN UP TO OUR NEWSLETTER
Get periodic updates about the African startup space, access to our reports, among others.
Subscribe Here
Subscription Form

A product of Techpoint Africa. All rights reserved