Nigeria experienced substantial year-on-year declines in exchange rate gain revenue from April to June 2025, with decreases of 90%, 81%, and 85% respectively

  • Nigeria’s exchange rate gain revenue dropped by 73.2% in H1 2025 compared to H1 2024.
  • In April 2025, exchange rate gain fell by 90% year-on-year from ₦285.5B to ₦28.7B.
  • May saw an 81% drop, with revenue declining from ₦438.9B in 2024 to ₦81.4B in 2025.
  • January 2025 was the only month with a stable figure, matching January 2024’s ₦402.7B.
  • Exchange rate gain revenue for February and March 2025 was unavailable, likely worsening the total.
  • The first half of 2025 generated only ₦589.4B in FX gains, compared to ₦2.2T in the same period in 2024.

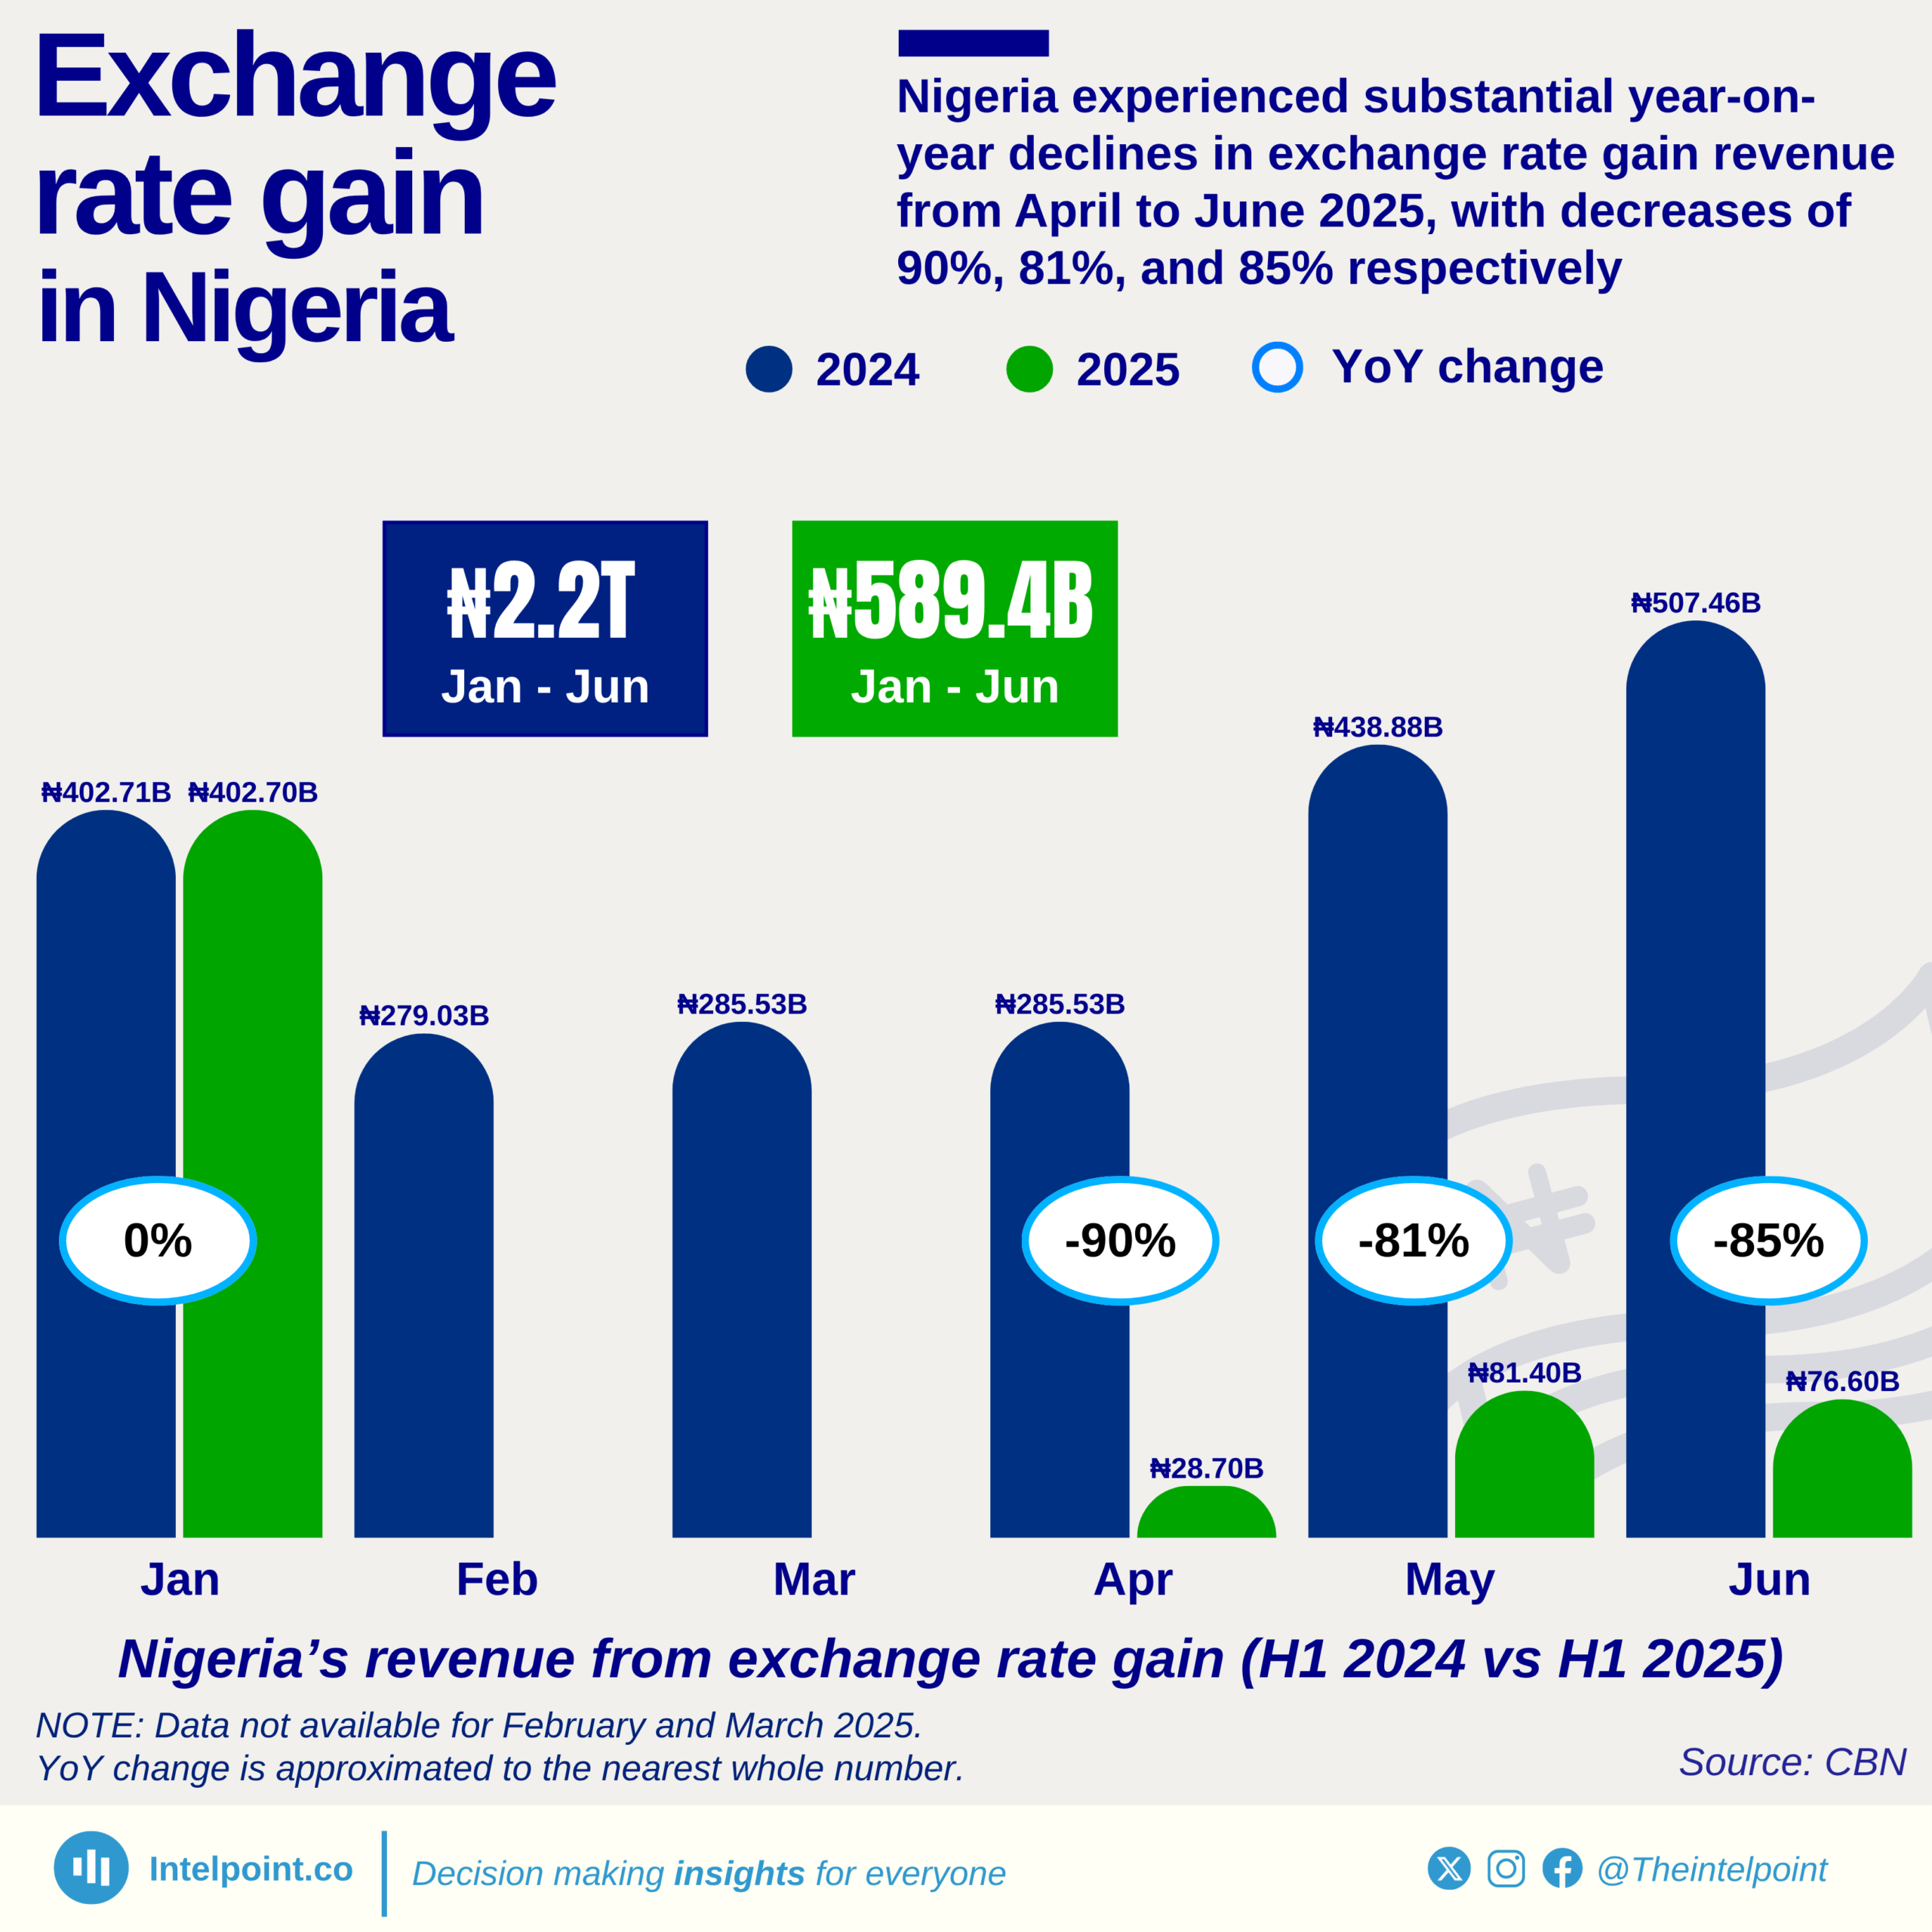
Nigeria experienced a significant decline in revenue from exchange rate gains in the first half of 2025, dropping from ₦2.2 trillion in H1 2024 to just ₦589.4 billion—a 73.2% decrease. This collapse was most pronounced in the second quarter of 2025, where year-on-year comparisons showed sharp contractions of 90%, 81%, and 85% in April, May, and June, respectively, while January held steady at ₦402.7 billion.

This means that, in April 2024, Nigeria earned ₦285.5 billion in exchange rate gains. A year later, it earned only ₦28.7 billion. May followed the same pattern, plunging from ₦438.9 billion to ₦81.4 billion. And in June, revenue further collapsed from ₦507.5 billion to ₦76.6 billion.

Source:

CBN

Period:

Jan-Jun 2025
HTML code to embed chart
Want a bespoke report?
Reach out
Tags
Related Insights

Total FAAC revenue shared in Nigeria consistently grew year-on-year from February to June 2025, with increases ranging from 39% to 49%
  • Nigeria’s FAAC revenue increased 49% YoY in March 2025 (₦1.68T vs ₦1.12T in March 2024).
  • February 2025 saw a 48% increase YoY (₦1.70T vs ₦1.15T in February 2024).
  • April 2025 revenue rose by 41% YoY, moving from ₦1.12T in April 2024 to ₦1.58T.
  • January 2025 showed no YoY change, recording ₦1.42T in both 2024 and 2025.
  • The consistent growth in H1 2025 FAAC revenues signals improved government revenue mobilisation, better oil/non-oil collections, and higher capacity for states to meet obligations.

East Africa is heavily represented among the weakest African currencies in 2024, with Somalia leading at 28,118.33 SOS per US$
  • Eight East African nations made the list of the top 15 worst African currencies.
  • Somalia has the weakest African currency in 2024, with an exchange rate of 28,118.33 SOS per US$.
  • Guinea, with 8,613.26 GNF per US$, has the second weakest currency, but is still far behind Somalia.
  • Madagascar, Uganda, and Zimbabwe follow, each with exchange rates between 3,200 and 4,500 LCU per US$.
  • Nigeria’s currency traded at 1,478.97 Naira per US$, about 20 times stronger than Somalia's currency.
  • Despite economic turmoil, South Sudan’s currency remained below 2,200 SSP per US$, performing better than Somalia and Guinea.
  • The gap between Somalia and the rest of Africa’s currencies highlights extreme economic pressures unique to the Somali economy in 2024.

Nigeria's naira depreciated by 129% in 2024, hitting an average of 1,479 NGN per US$
  • The Nigerian naira depreciated by a record-breaking 129.23% in 2024, the highest drop in the last decade.
  • From 2015 to 2022, the naira's depreciation was relatively controlled, rarely exceeding 20% year-on-year.
  • The exchange rate remained nearly flat from 2017 to 2019, showing signs of stability.
  • In 2023, the naira lost over half its value (51.46%), marking the beginning of the current volatility wave.
  • The exchange rate crossed the ₦1,000/$ threshold in 2024 for the first time in history.

Somalia's official exchange rate (SOS per US$) has generally trended upwards from 2015 to 2024, reaching 28,118.33 SOS per US$
  • Somalia’s currency has depreciated by 26.4% between 2015 and 2024.
  • The sharpest yearly depreciation was in 2019, at 4.64%.
  • From 2020 to 2021, the SOS saw its smallest year-on-year shift at 1.08%.
  • Despite fluctuations, every year from 2015 to 2024 recorded a net increase in SOS per US$.
  • 2017 recorded near-stable currency performance with just a 0.16% change from the previous year.

North Africa dominates the strongest African currencies in 2024, with Tunisia taking the lead at TND 3.11/USD
  • Tunisia held the top spot with the strongest African currency, trading at 3.11 TND per USD in 2024.
  • Libya followed as the second-strongest, with an exchange rate of 4.83 LYD per USD.
  • Morocco maintained a strong regional position, with its dirham trading at 9.94 MAD per USD.
  • Botswana’s pula was relatively stable, exchanging at 13.56 per USD, highlighting Southern Africa’s economic steadiness.
  • Ghana and Seychelles had closely matched exchange rates, trading at 14.48 and 14.53 to the dollar, respectively.
  • South Africa, Lesotho, Namibia, and Eswatini all shared almost identical exchange rates of around 18.32–18.33 per USD, showing tight regional monetary coordination.

After a period of fluctuation, Tunisia's currency has demonstrated a stabilised exchange rate since 2022 at around 3.11 TND per US$
  • The Tunisian dinar stood at TND 2.15 per US$ in 2016 and has since depreciated to TND 3.11 per US$ in 2024.
  • Between 2016 and 2019, the dinar saw a strong depreciation.
  • 2020 marked a turning point with a 4.16% appreciation, the first notable currency strengthening in the period observed.
  • From 2022 onward, the exchange rate has stabilised closely around TND 3.10 to TND 3.11 per US$, with minimal yearly changes of 0.08% and 0.04%.
  • The largest year-on-year depreciation occurred in 2017 with a 12.63% change.
  • Despite the earlier years of high volatility, Tunisia’s currency performance in the last three years suggests better monetary management and external stability.

POPULAR TOPICS
SIGN UP TO OUR NEWSLETTER
Get periodic updates about the African startup space, access to our reports, among others.
Subscribe Here
Subscription Form

A product of Techpoint Africa. All rights reserved