Total FAAC revenue shared in Nigeria consistently grew year-on-year from February to June 2025, with increases ranging from 39% to 49%

  • Nigeria’s FAAC revenue increased 49% YoY in March 2025 (₦1.68T vs ₦1.12T in March 2024).
  • February 2025 saw a 48% increase YoY (₦1.70T vs ₦1.15T in February 2024).
  • April 2025 revenue rose by 41% YoY, moving from ₦1.12T in April 2024 to ₦1.58T.
  • January 2025 showed no YoY change, recording ₦1.42T in both 2024 and 2025.
  • The consistent growth in H1 2025 FAAC revenues signals improved government revenue mobilisation, better oil/non-oil collections, and higher capacity for states to meet obligations.

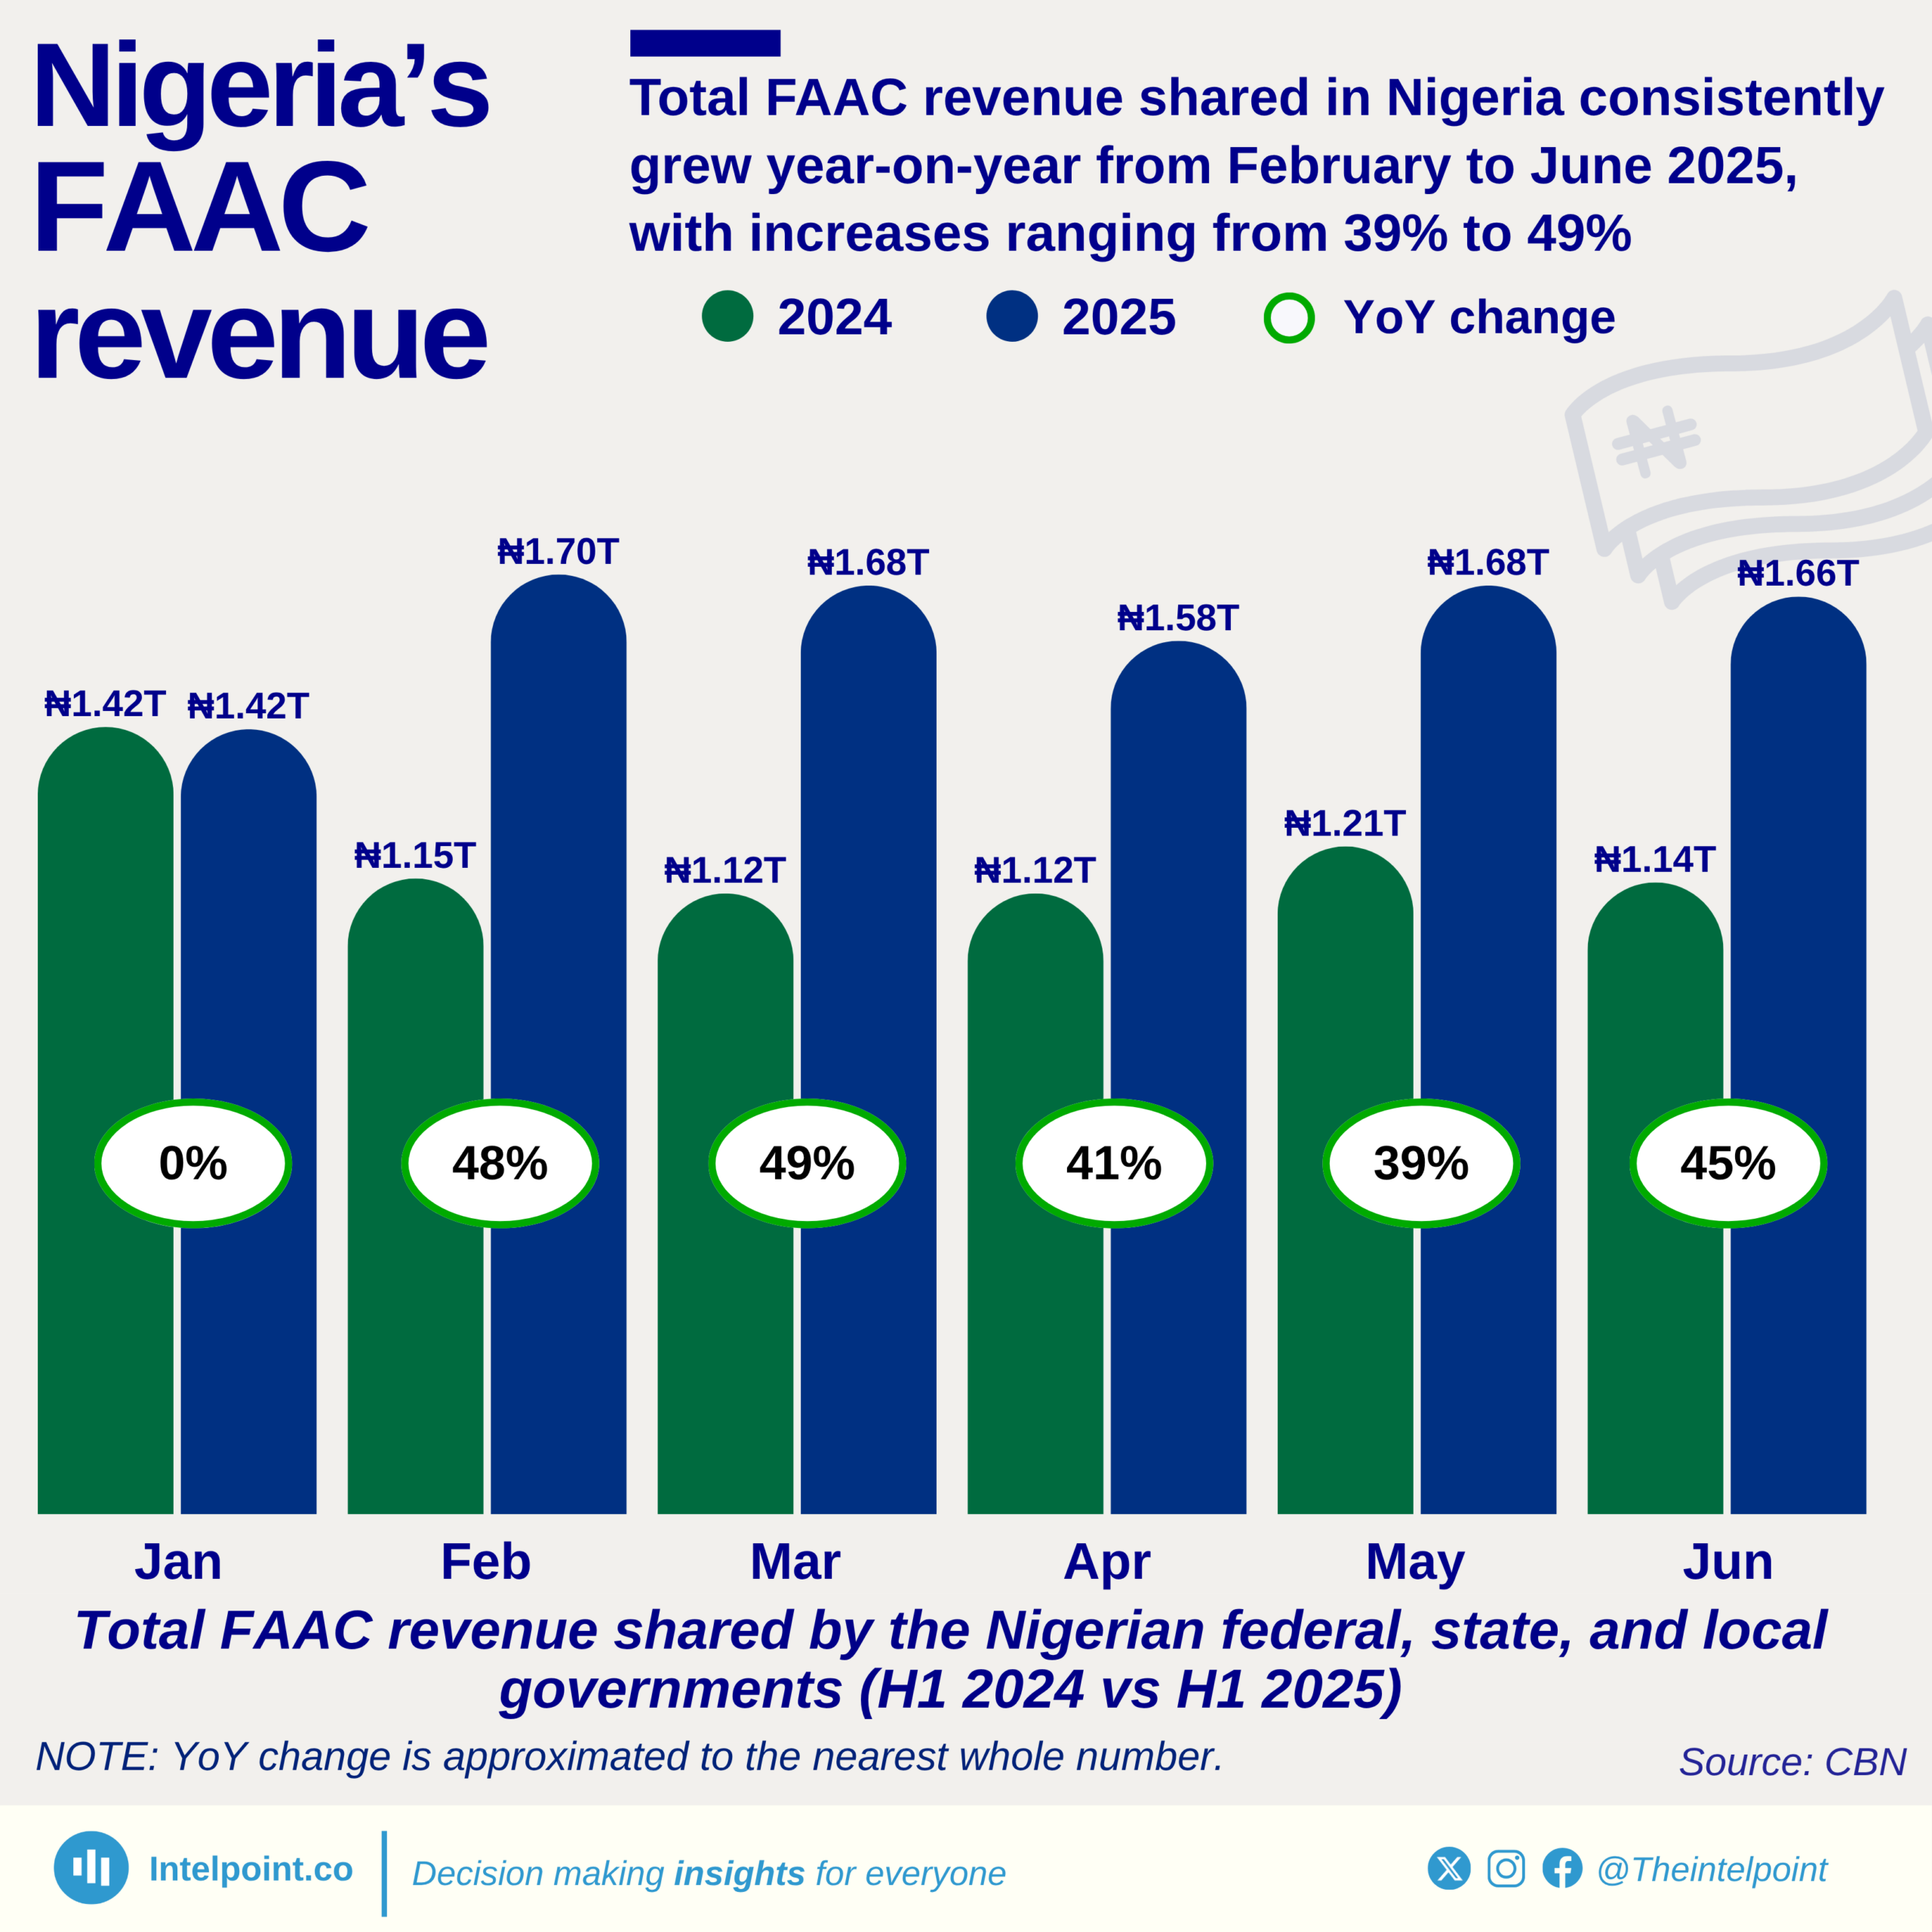
Nigeria’s Federation Account Allocation Committee (FAAC) revenue distribution has shown consistent year-on-year growth from February to June 2025, reflecting improved government revenue mobilisation and stronger inflows. Except for January, which saw no change, every month in H1 2025 posted a significant increase in shared revenue compared to the same period in 2024, with growth rates ranging from 39% to 49%. This consistent rise indicates stronger fiscal capacity to support federal, state, and local government operations amid economic challenges.

Source:

Period:

HTML code to embed chart
Want a bespoke report?
Reach out
Tags
Related Insights

GTCO turned ₦40 of every ₦100 earned into profit
  • GTCO had the strongest profit conversion in 2025.
  • GTCO turned about ₦40 of every ₦100 earned into profit.
  • Stanbic IBTC followed with about ₦34 profit per ₦100 earned.
  • Zenith made the highest profit, but not the strongest conversion.
  • First HoldCo had the weakest profit conversion among the banks reviewed.
 

Jaiz Bank spent the highest share of revenue on staff among NGX-listed banks
Jaiz Bank spent the highest share of revenue on staff in 2025. Jaiz spent nearly ₦18 on staff for every ₦100 of revenue. ETI and UBA followed with the next highest staff-cost-to-revenue ratios. GTCO had the lowest staff-cost burden among the listed banks. ETI spent the most in absolute staff costs, at ₦782.8 billion.

Lagos State generated the vast majority of Nigeria's IGR at ₦1.3 trillion, accounting for over 35% of the ₦3.7 trillion total IGR
  • Nigeria’s total IGR in 2024 was ₦3.7 trillion.
  • Lagos State generated ₦1.3 trillion, accounting for over 35% of the national IGR.
  • Rivers State (₦317.3 billion) and the FCT, Abuja (₦282.4 billion) ranked second and third, respectively.
  • The South West led regionally with ₦1.7 trillion in total IGR.
  • The North East recorded the lowest regional IGR at ₦129.8 billion.
  • Economic disparity between regions remains wide, with Lagos alone outpacing entire regions.

Nigeria’s South East region is the only one where MDAs' revenue (60.9%) exceeded Total Tax Revenue (39.10%) in 2024
  • The South East is the only region where the revenue of MDAs (60.9%) exceeded tax revenue (39.1%).
  • Other regions relied more heavily on tax revenue, with the South South leading at 85.25%.
  • The North East and North Central followed closely, with tax contributions of 79.9% and 79.15%, respectively.
  • The South West generated 75.04% of its IGR from taxes, indicating a strong formal revenue structure.
  • The North West maintained a more balanced mix, with 58.54% tax and 41.46% MDAs’ revenue.

Lagos and Rivers have dominated Nigeria’s revenue rankings since 2008
  • A total of ₦20.45 trillion in Internally Generated Revenue (IGR) has been recorded nationwide since 2008.
  • Lagos State generated ₦1.26 trillion in 2024, maintaining its position as the top revenue-generating state.
  • For five consecutive years, Yobe and Taraba have consistently ranked among the bottom five states in revenue generation.
  • FCT IGR records began in 2018.
  • Enugu State recorded a remarkable 433.03% year-on-year increase in 2024.
  • Ebonyi (–57.27%), Ondo (–24.70%), and Yobe (–0.99%) were the only states that experienced a decline in IGR in 2024.

The manufacturing sector leads Nigerian MSME revenues with ₦8.27 million monthly, far outpacing service sectors
  • Manufacturing records the highest monthly revenue at ₦8.27m, nearly double that of the next sector.
  • Healthcare (₦5.02m) and Transportation (₦3.70m) follow, reflecting essential service demand.
  • Industries like Marketing & Advertising (₦191k), Food & Beverages (₦320k), and Education (₦440k) earn significantly less on average.
  • The difference between top earners (Manufacturing, Healthcare) and bottom sectors highlights a stark inequality in industry.

POPULAR TOPICS
SIGN UP TO OUR NEWSLETTER
Get periodic updates about the African startup space, access to our reports, among others.
Subscribe Here
Subscription Form

A product of Techpoint Africa. All rights reserved