The northern regions of Nigeria saw the most significant rise in diesel prices over the past year, with the North East experiencing an increase of up to 36.26%

Key takeaways:

  • Diesel prices in the North East soared by 36.26%, the highest increase nationwide.
  • All three northern zones—North East (36.26%), North Central (33.71%), and North West (15.44%)—saw the steepest fuel price increases, outpacing their southern counterparts.
  • The South East (6.97%) and South South (9.23%) recorded the lowest diesel price increases.
  • The South West experienced a moderate rise at 13.30%, positioning it between the extremes of northern and other southern zones.
  • The uneven price changes point to a broader issue of fuel supply chain challenges, infrastructure, and perhaps market inefficiencies affecting certain regions more than others.

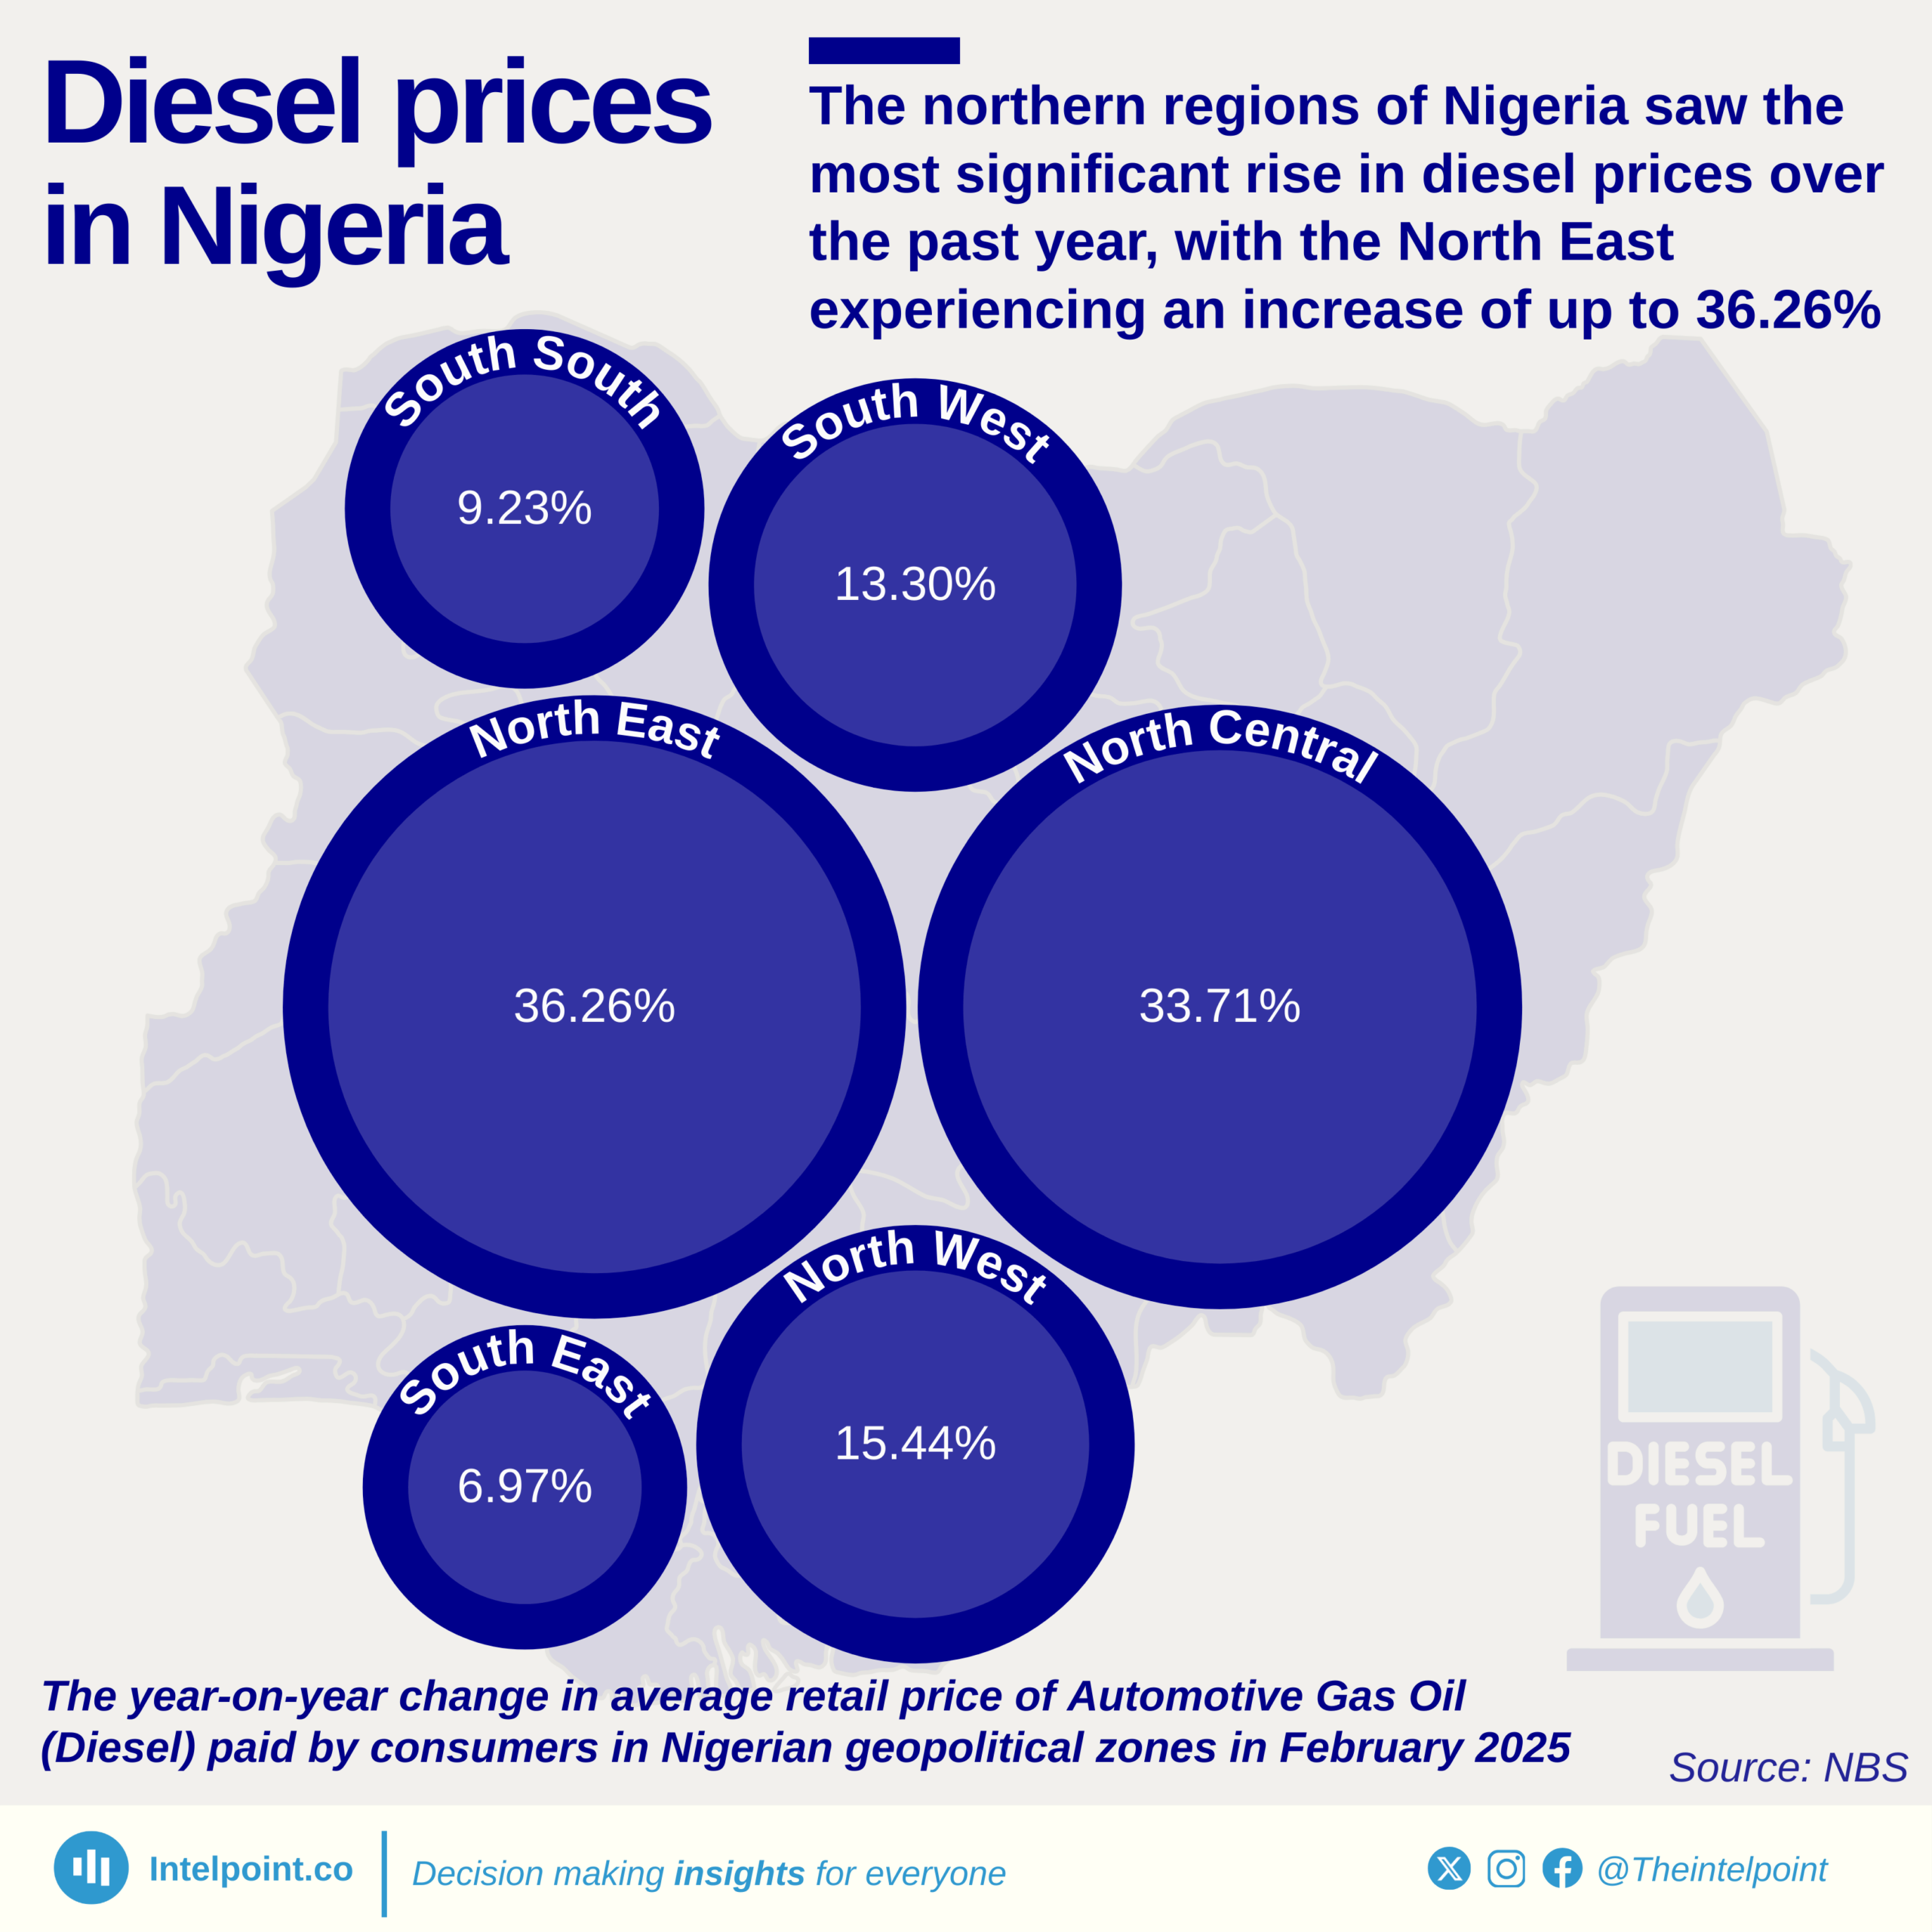
In February 2025, the North East recorded the highest year-on-year increase in diesel prices at 36.26%, followed closely by the North Central at 33.71%. This steep rise in energy costs in the northern regions contrasts sharply with the southern zones, where price changes were far more modest, dipping as low as 6.97% in the South East. The contrast highlights an uneven energy burden across Nigeria that could have ripple effects on transportation, business operations, and the overall cost of living in different parts of the country.

Source:

NBS

Period:

2025
HTML code to embed chart
Want a bespoke report?
Reach out
Tags
Related Insights

South Africa dominates Africa's battery energy storage pipeline, with over three times the capacity of Egypt, the next largest market
  • South Africa dominates with 30 battery storage systems, the largest by far.
  • Egypt is the second-largest market with 7 projects, while Morocco has 4.
  • Nigeria and Senegal have five projects each (operational + pipeline).
  • Several countries, including Ghana, Togo, Angola, Botswana, DR Congo, and Mauritius, each have just one or two projects, indicating an uneven spread across the continent.
  • South Africa also leads in systems under construction (7).
  • Operational projects are still limited continent-wide, with most systems either under construction or in the planning pipeline.

Nigeria’s urban electrification has stalled below 90% for over three decades
  • Urban electricity access has remained between 80% and 89% since 1990, never crossing to 90%.
  • The inability to achieve universal access suggests that infrastructure expansion has struggled to keep pace with rapid urbanisation and population growth.
  • Periodic dips in access, such as in 2010 and 2015, point to challenges in maintaining consistent electricity supply rather than just extending connections.
  • Insufficient generation, outdated grids, and policy inefficiencies have constrained Nigeria’s ability to deliver reliable and universal electricity access even in its urban centres.

Only one in three rural Nigerians have access to electricity after three decades of progress
  • Rural electricity access increased from just 4% in 1990 to about 33% in 2023, showing gradual progress over three decades.
  • The data reveals irregular jumps in certain years—such as 2003, 2011, and 2016—likely tied to temporary electrification programmes or revised data estimates. D
  • espite improvements, nearly two-thirds of rural Nigerians still lack electricity, underscoring a wide disparity in energy access across regions.
  • The slow rate of expansion highlights ongoing issues with investment, grid extension, and maintenance that continue to limit rural electrification efforts.

Nigeria’s renewable energy capacity held steady at 2.1–2.3 GW from 2015 to 2021, then surged from 2022 onward
  • Nigeria’s renewable energy capacity grew from 2.1 GW in 2015 to 3.7 GW in 2024.
  • This represents a 76% increase over the decade.
  • The compound annual growth rate (CAGR) was 5.7% between 2015 and 2024.
  • From 2015 to 2020, capacity was stagnant at around 2.2 GW.
  • The biggest growth year was 2022, with a sharp 34.9% increase.
  • Capacity stagnated in 2023 at 3.1 GW before climbing again in 2024.
  • Nigeria’s renewable growth remains modest compared to its population size and energy demand.

From 2015 to 2024, Morocco's renewable capacity grew from 2.4 GW to 4.0 GW, a 67% increase
  • Morocco’s renewable energy capacity grew from 2.4 GW in 2015 to 4.0 GW in 2024.
  • This represents a 67% increase over the decade.
  • The compound annual growth rate (CAGR) was 5.3% between 2015 and 2024.
  • Capacity was stagnant at 2.4 GW from 2015 to 2017 before growth resumed.
  • The biggest single-year increase happened in 2022, with a 13.7% jump.
  • Capacity additions slowed in 2023 (3.7 GW) and 2024 (4.0 GW).

From 2015 to 2024, South Africa's renewable energy capacity more than tripled, from 3.4 GW to 13.5 GW
  • South Africa’s renewable energy capacity grew from 3.4 GW in 2015 to 13.5 GW in 2024.
  • The country recorded a CAGR of 14.7% over the period.
  • The biggest annual growth was in 2016, when capacity surged by 49.2%.
  • Stagnation occurred in 2021 (0.8% growth) and 2023 (0.0%), reflecting project delays or policy issues.
  • The most recent increase was in 2024, when capacity rose to 13.5 GW, showing renewed momentum.
  • South Africa’s renewable energy capacity is more than three times Nigeria’s 3.7 GW in 2024.

POPULAR TOPICS
SIGN UP TO OUR NEWSLETTER
Get periodic updates about the African startup space, access to our reports, among others.
Subscribe Here
Subscription Form

A product of Techpoint Africa. All rights reserved