With a 51.24-point increase, Morocco showed the most significant AIDI growth among the top African economies

Key takeaways:

  • Morocco's AIDI score rose from 19.08 in 2003 to 70.32 in 2024, indicating substantial infrastructure progress over two decades.
  • Over the past 21 years, Egypt's infrastructure development, as measured by AIDI, has more than tripled.
  • Nigeria ranks 24th in infrastructure (AIDI) despite having the 4th largest GDP in Africa.
  • In 2024, Nigeria’s AIDI score was 25.70, significantly below peers like Morocco (91.43) and Egypt (82.54).
  • Algeria, with a GDP of $260.13B, achieved a strong AIDI score of 70.32, ranking 8th.
  • The AIDI gap highlights that economic size doesn’t guarantee infrastructure strength, underlining the need for intentional investment.

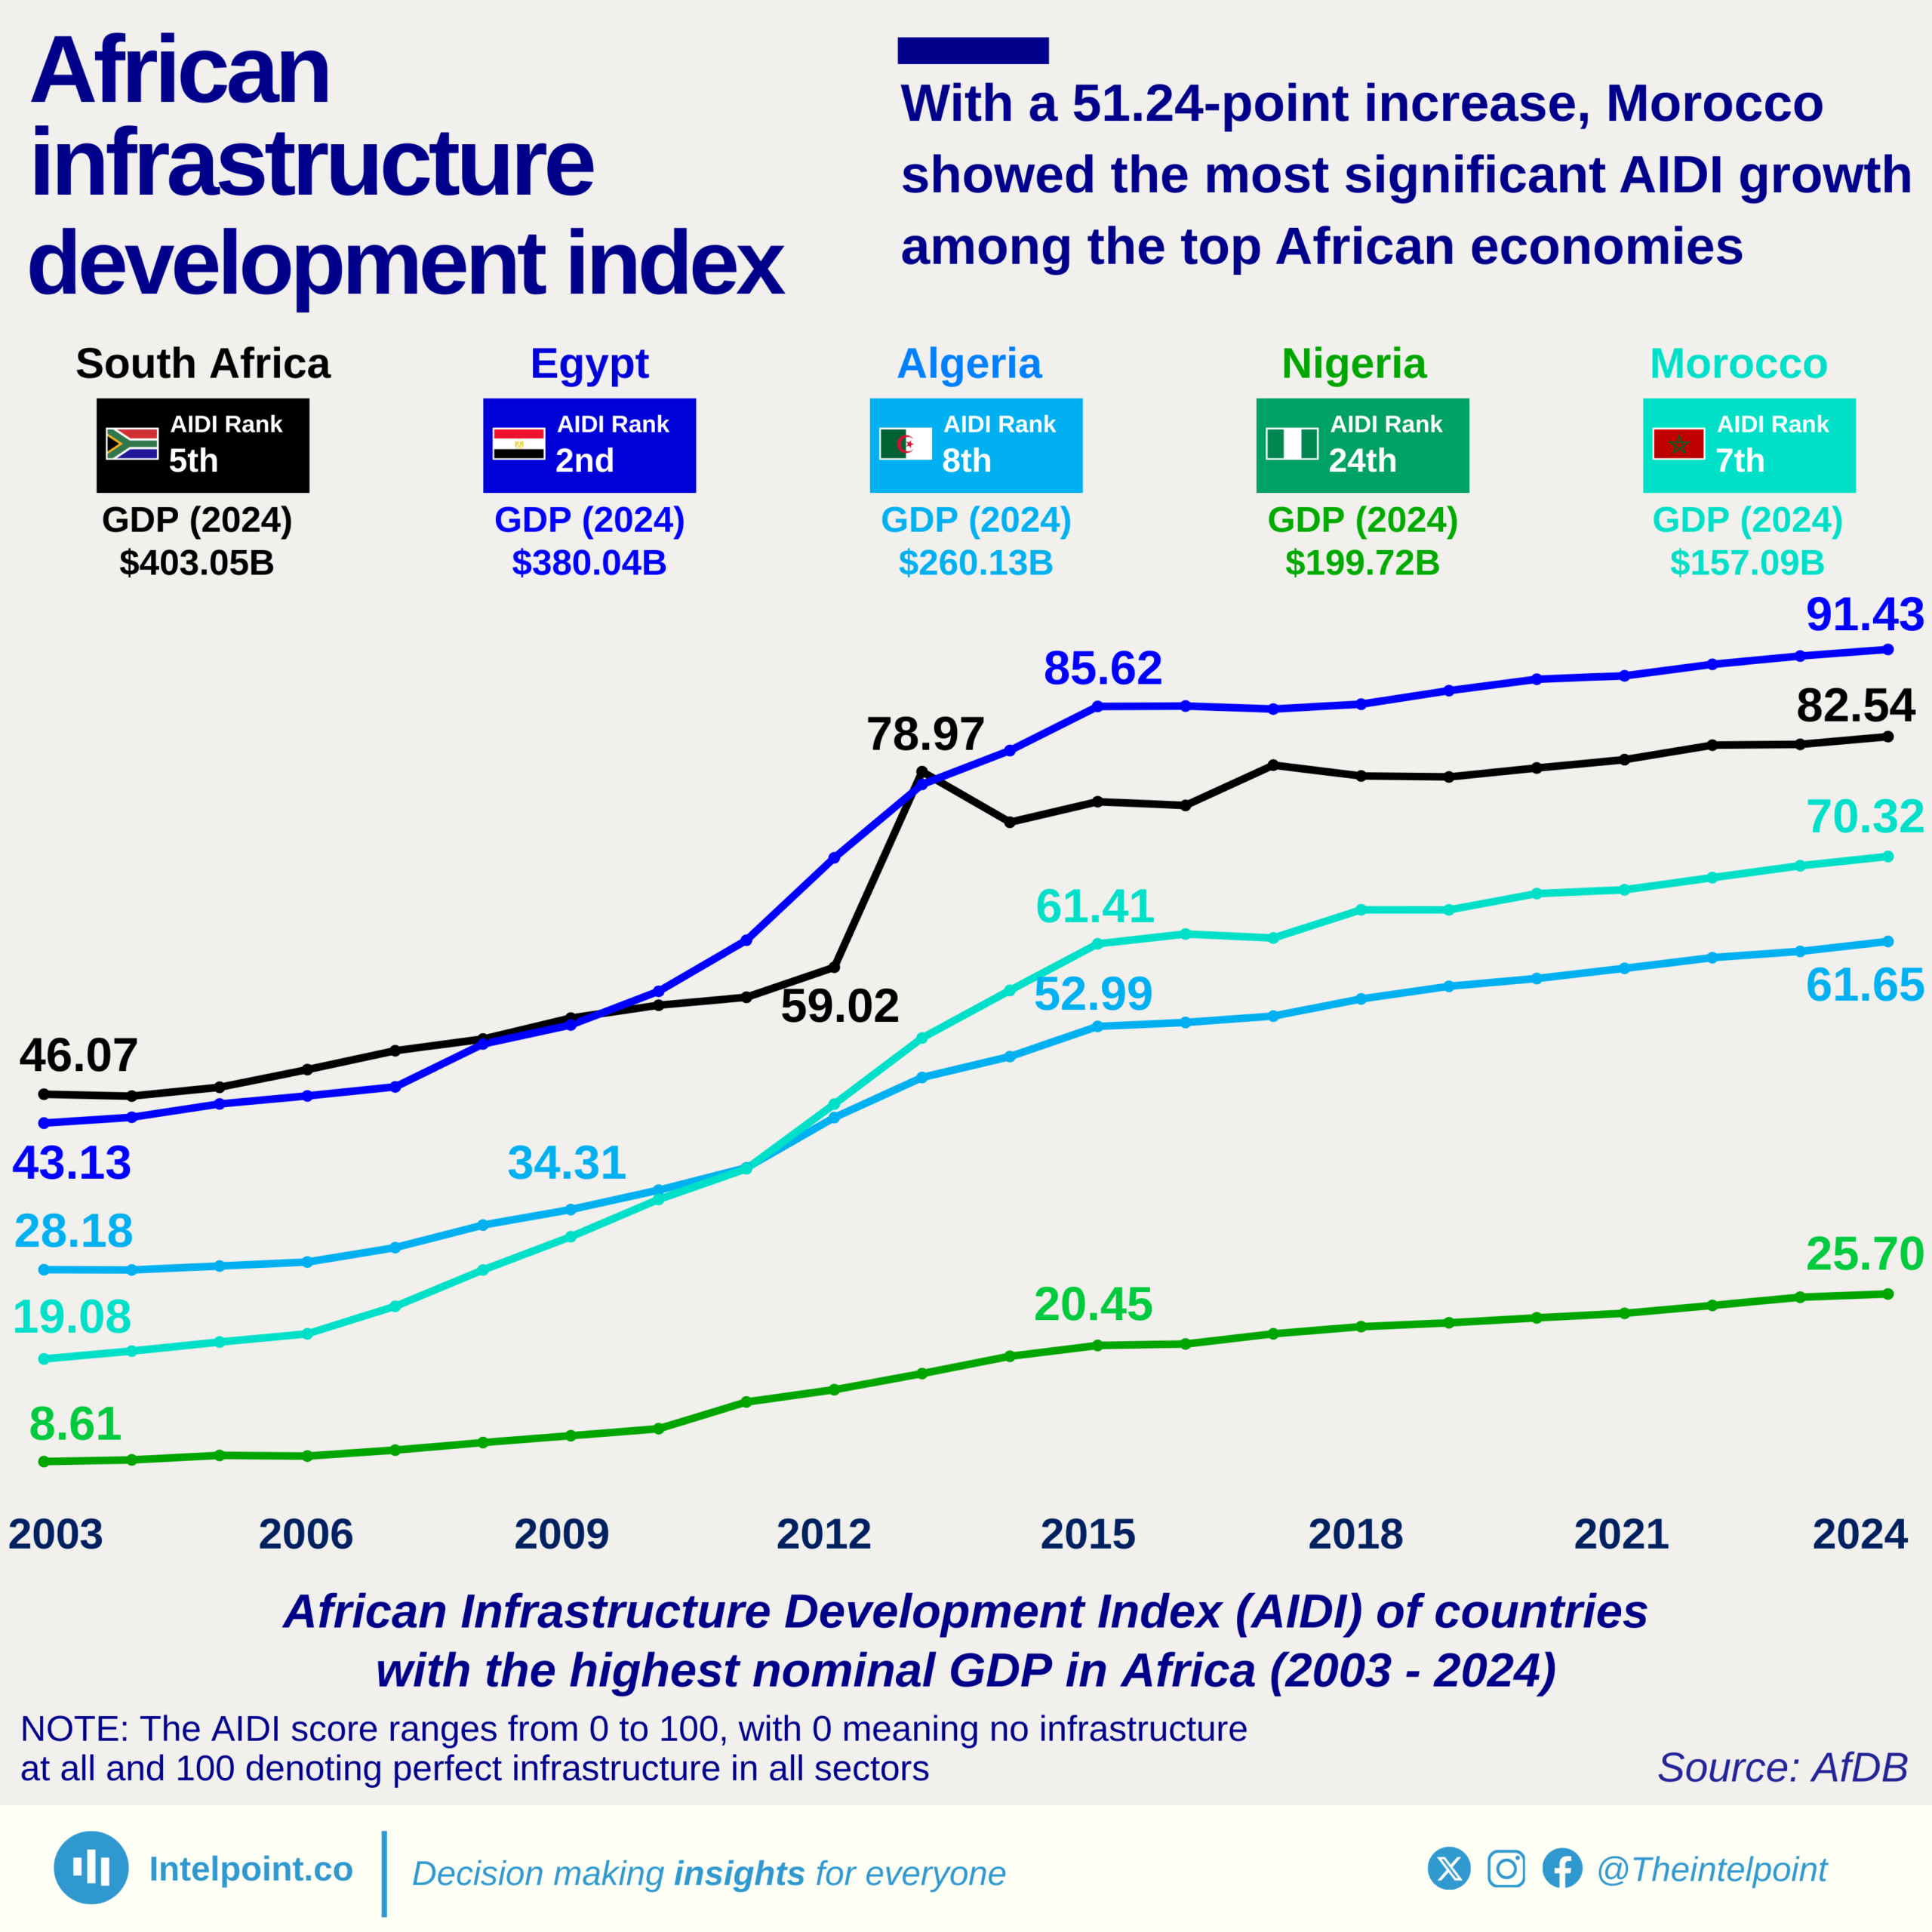
Between 2003 and 2024, Morocco's African Infrastructure Development Index (AIDI) score surged by 51.24 points – the highest growth among Africa's top economies. Nigeria, despite having the 4th highest GDP in Africa at $199.72B, ranked 24th on the AIDI in 2024, with a score of 25.70. This points to a critical gap between economic size and the state of infrastructure, revealing a broader issue: a high GDP does not necessarily translate into strong infrastructure development.
Morocco, in contrast, ranked 7th in AIDI with a much smaller GDP of $157.09B. Its 2024 AIDI score was 70.32, more than two times higher than Nigeria’s. Similarly, Algeria and Egypt, with comparable or slightly larger GDPs, scored 61.65 and 91.43, respectively, placing them well ahead in infrastructure performance.

Source:

AfDB

Period:

2003 - 2024
HTML code to embed chart
Want a bespoke report?
Reach out
Tags
Related Insights

After peaking at $3.88B in 2019, Ghana’s FDI fell to $1.31B in 2023, a 66% drop in four years
  • FDI inflows surged from just $0.01 billion in 1990 to a record $3.88 billion in 2019, marking a 388x increase over 30 years.
  • Between 2006 and 2019, Ghana consistently attracted over $1 billion annually, with nine of those years surpassing $3 billion.
  • The highest FDI year on record was 2019, likely reflecting peak investor confidence before the pandemic.
  • Since 2021, FDI has remained below $2 billion, with 2023 recording $1.31 billion and 2024 only slightly higher at $1.67 billion.
  • Ghana’s FDI trend reflects a pattern of post-2000 acceleration, plateauing around 2012–2015, then declining sharply post-2020.

On average, Nigeria’s NBS publishes Q1 GDP reports 53 days after the quarter ends. But in 2025, it's been 86 days—and still no release
  • Nigeria’s National Bureau of Statistics (NBS) usually releases Q1 GDP data 53 days after the quarter ends.
  • As of June 25, 2025, the Q1 2025 figures are 86 days overdue—that’s 33 days longer than average.
  • The delay coincides with a GDP rebasing exercise, updating the base year to 2019.
  • Q1 GDP reports have typically come out in May for the past eight years—until now.

Egypt accounted for nearly half of Africa’s $97 billion FDI inflow in 2024
  • Africa attracted $97 billion in FDI in 2024 — nearly double the 2023 level — marking a record year for the continent.
  • Egypt alone accounted for nearly 50% of total African inflows, driven by a $35 billion Ras El-Hekma megaproject and sweeping reforms.
  • Major gainers included Zambia (+1340%), Guinea (+105%), and Mauritania (+74%), showing momentum beyond usual hotspots.
  • Nigeria’s FDI dropped 42%, while South Africa (–29%) and Senegal (–58%) also saw steep declines.

Egypt’s $47 billion FDI haul puts it ahead of major economies in 2024
  • Global FDI rose to $1.51 trillion, still below its 2015 peak.
  • The top 10 countries accounted for 65% of total inflows.
  • Egypt ranked 8th globally with $46.6 billion, ahead of UAE and Mexico.
  • A $35 billion Ras El-Hekma deal drove much of Egypt’s surge.
  • Egypt’s FDI grew over 370%, the fastest among top recipients.

Over $3.2 billion was sent abroad from Nigeria from 2000 to 2023, with a $1 billion spike in 2015 standing out
  • Migrants living in Nigeria sent out over $3.2 billion in personal remittances between 2000 and 2023.
  • The year 2015 recorded a sharp and unusual outflow of $1.04 billion, the highest by far in the entire 24-year span.
  • After 2015, remittance outflows sharply declined, stabilising below $100 million from 2018 onward.
  • Prior to 2015, outflows were consistently under $110 million annually, indicating a major anomaly in that spike year.

Nigeria has received $430B in remittances since 2000, peaking at $24.3B in 2018
  • Nigeria received a total of approximately $430 billion in remittances between 2000 and 2023.
  • The highest amount recorded was in 2018, when remittances peaked at $24.31 billion.
  • In 2020, inflows dropped significantly to $17.21 billion due to the global COVID-19 crisis.
  • Between 2021 and 2023, remittances remained stable, averaging around $19.7 billion per year.

POPULAR TOPICS
SIGN UP TO OUR NEWSLETTER
Get periodic updates about the African startup space, access to our reports, among others.
Subscribe Here
Subscription Form

A product of Techpoint Africa. All rights reserved