The South-West remitted ₦341.18B in VAT but received only ₦106.85B, getting back just ₦0.31 for every ₦1 remitted.

Key Takeaways

  • Lagos carried the South-West VAT burden, remitting ₦305.52B (89.6% of the region's total) but receiving only ₦62.59B (20.5% return), making it the highest net contributor in Nigeria.
  • Osun had the most disproportionate gain, remitting a mere ₦590M but receiving ₦7.73B, an astronomical 1,211% return—the highest redistribution gain in the South-West.
  • The entire South-West remitted ₦341.18B but received only ₦106.85B, meaning it got back just ₦0.31 for every ₦1 contributed, highlighting a severe VAT allocation imbalance.
  • Ondo and Ogun remitted only ₦3.3B but received ₦16B combined, far exceeding their generated VAT, while Lagos alone subsidised most of the allocations across the country.

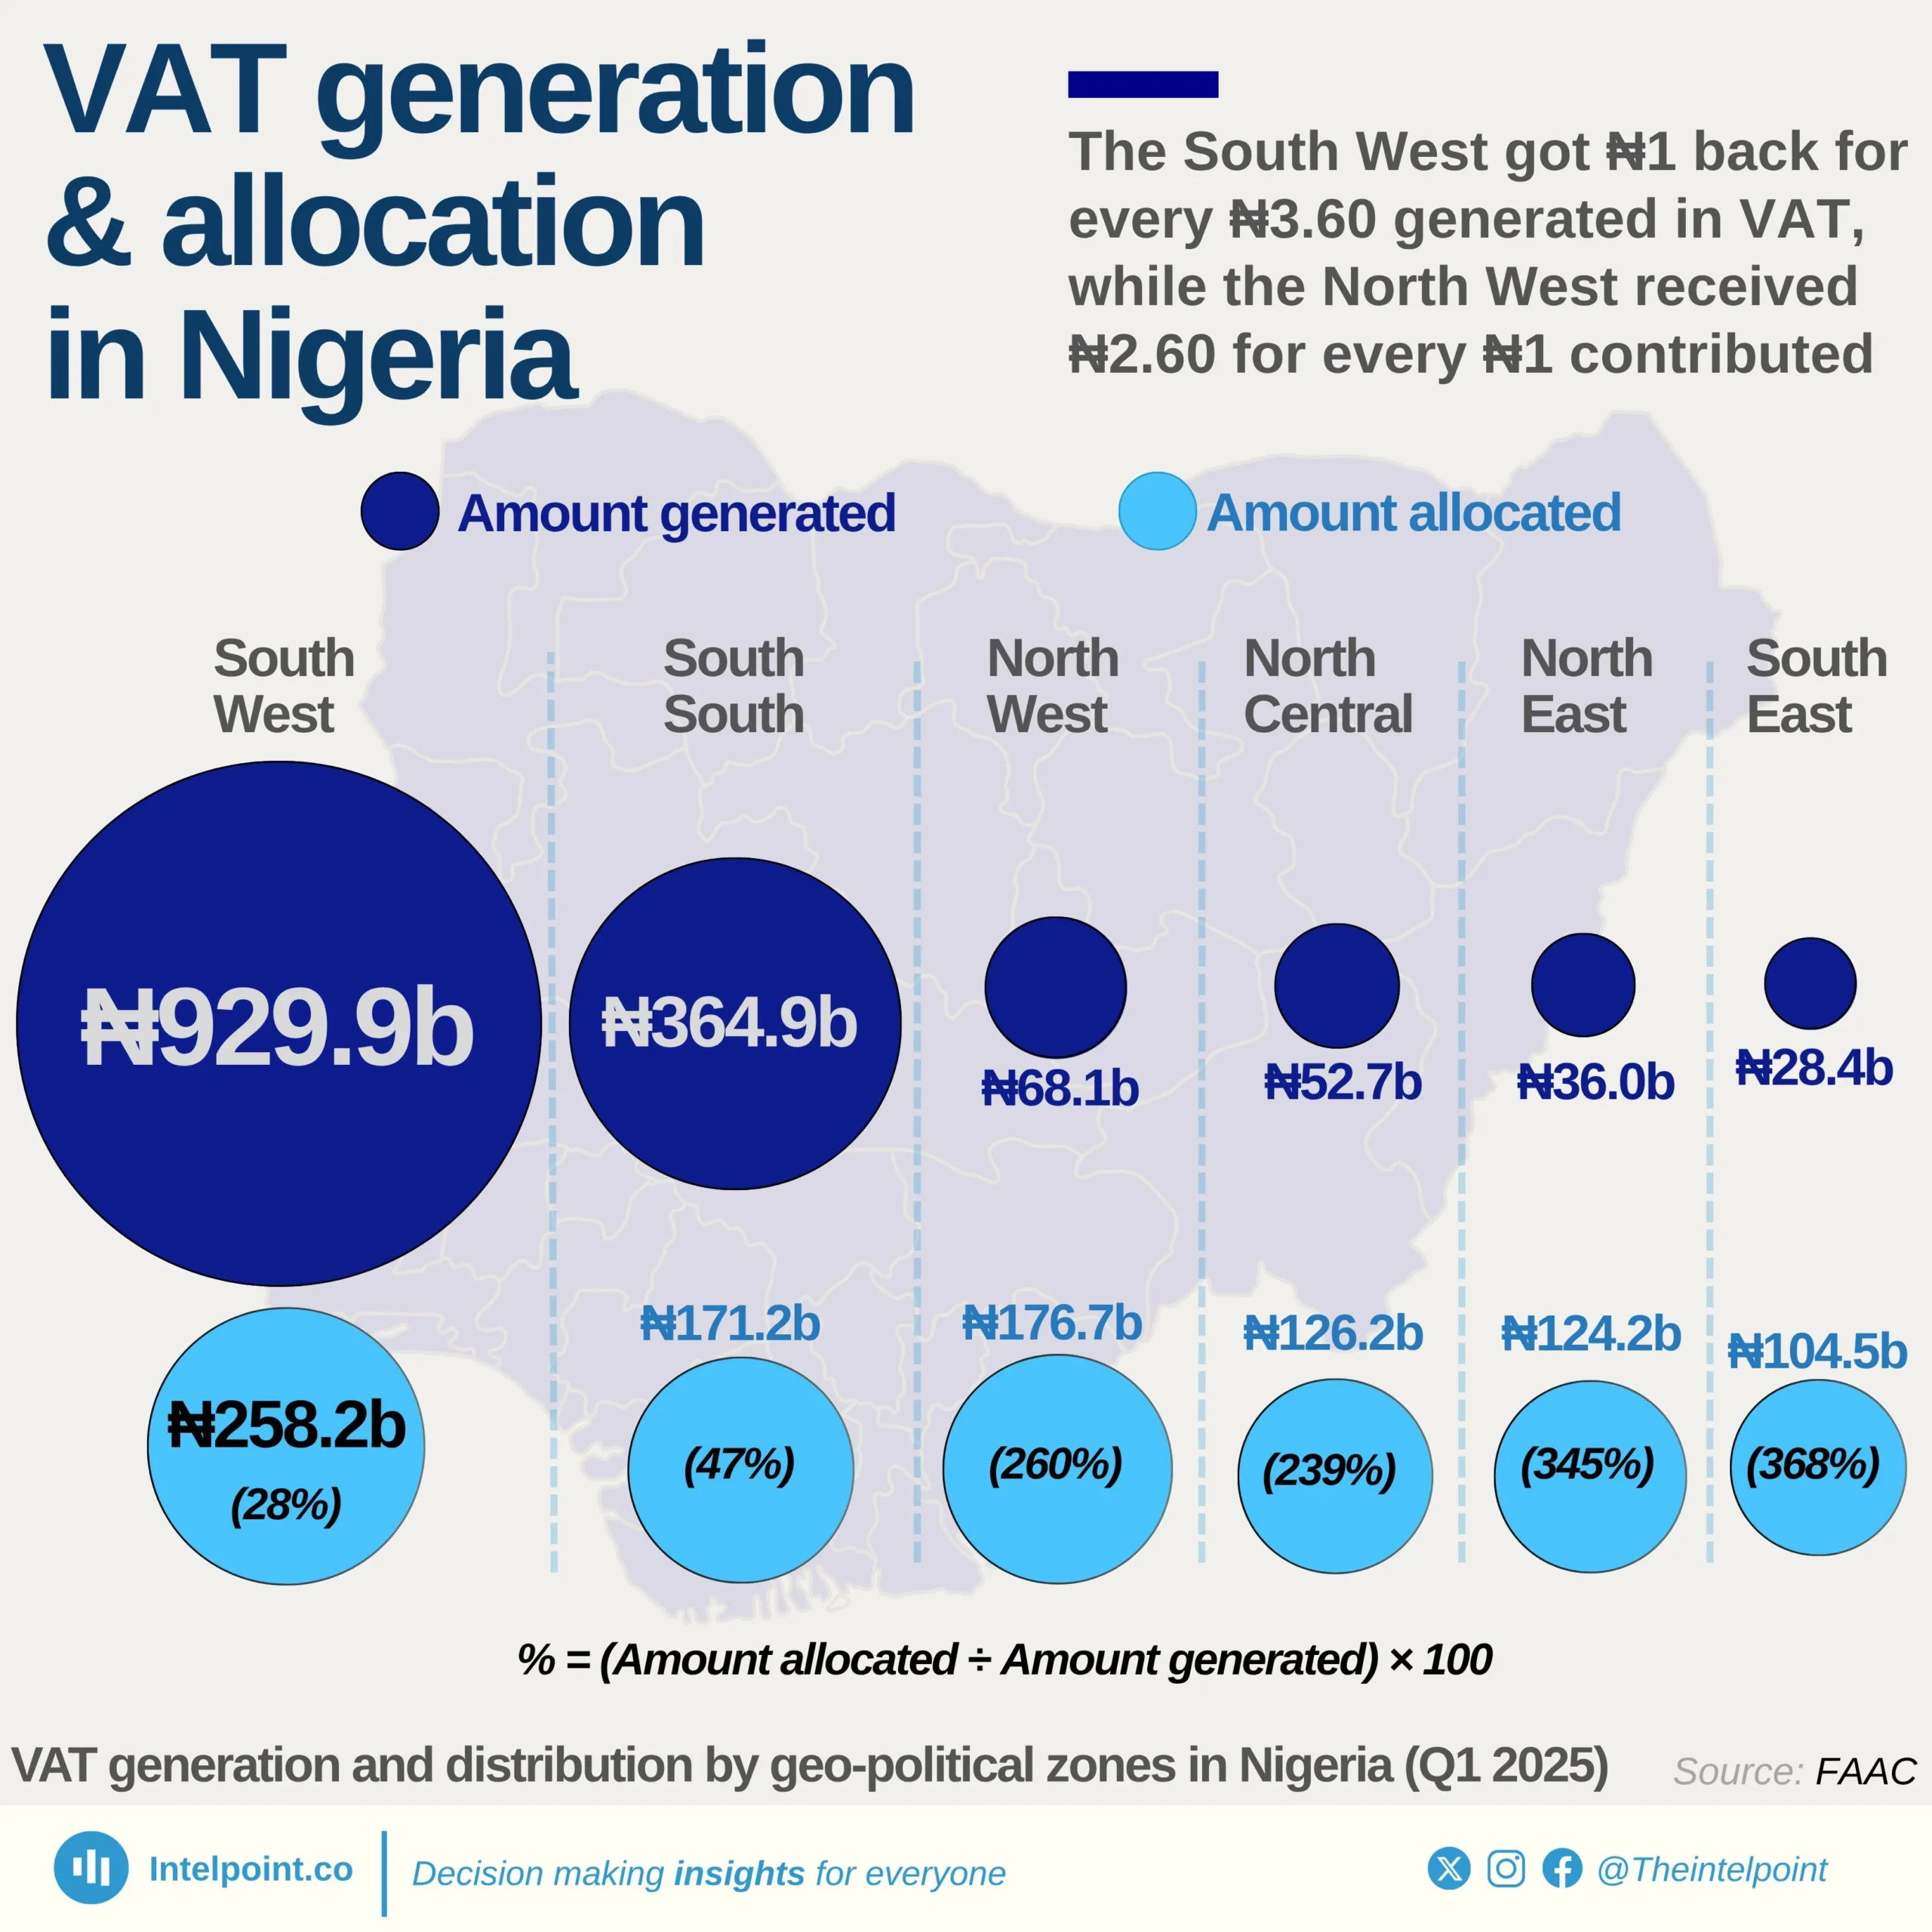
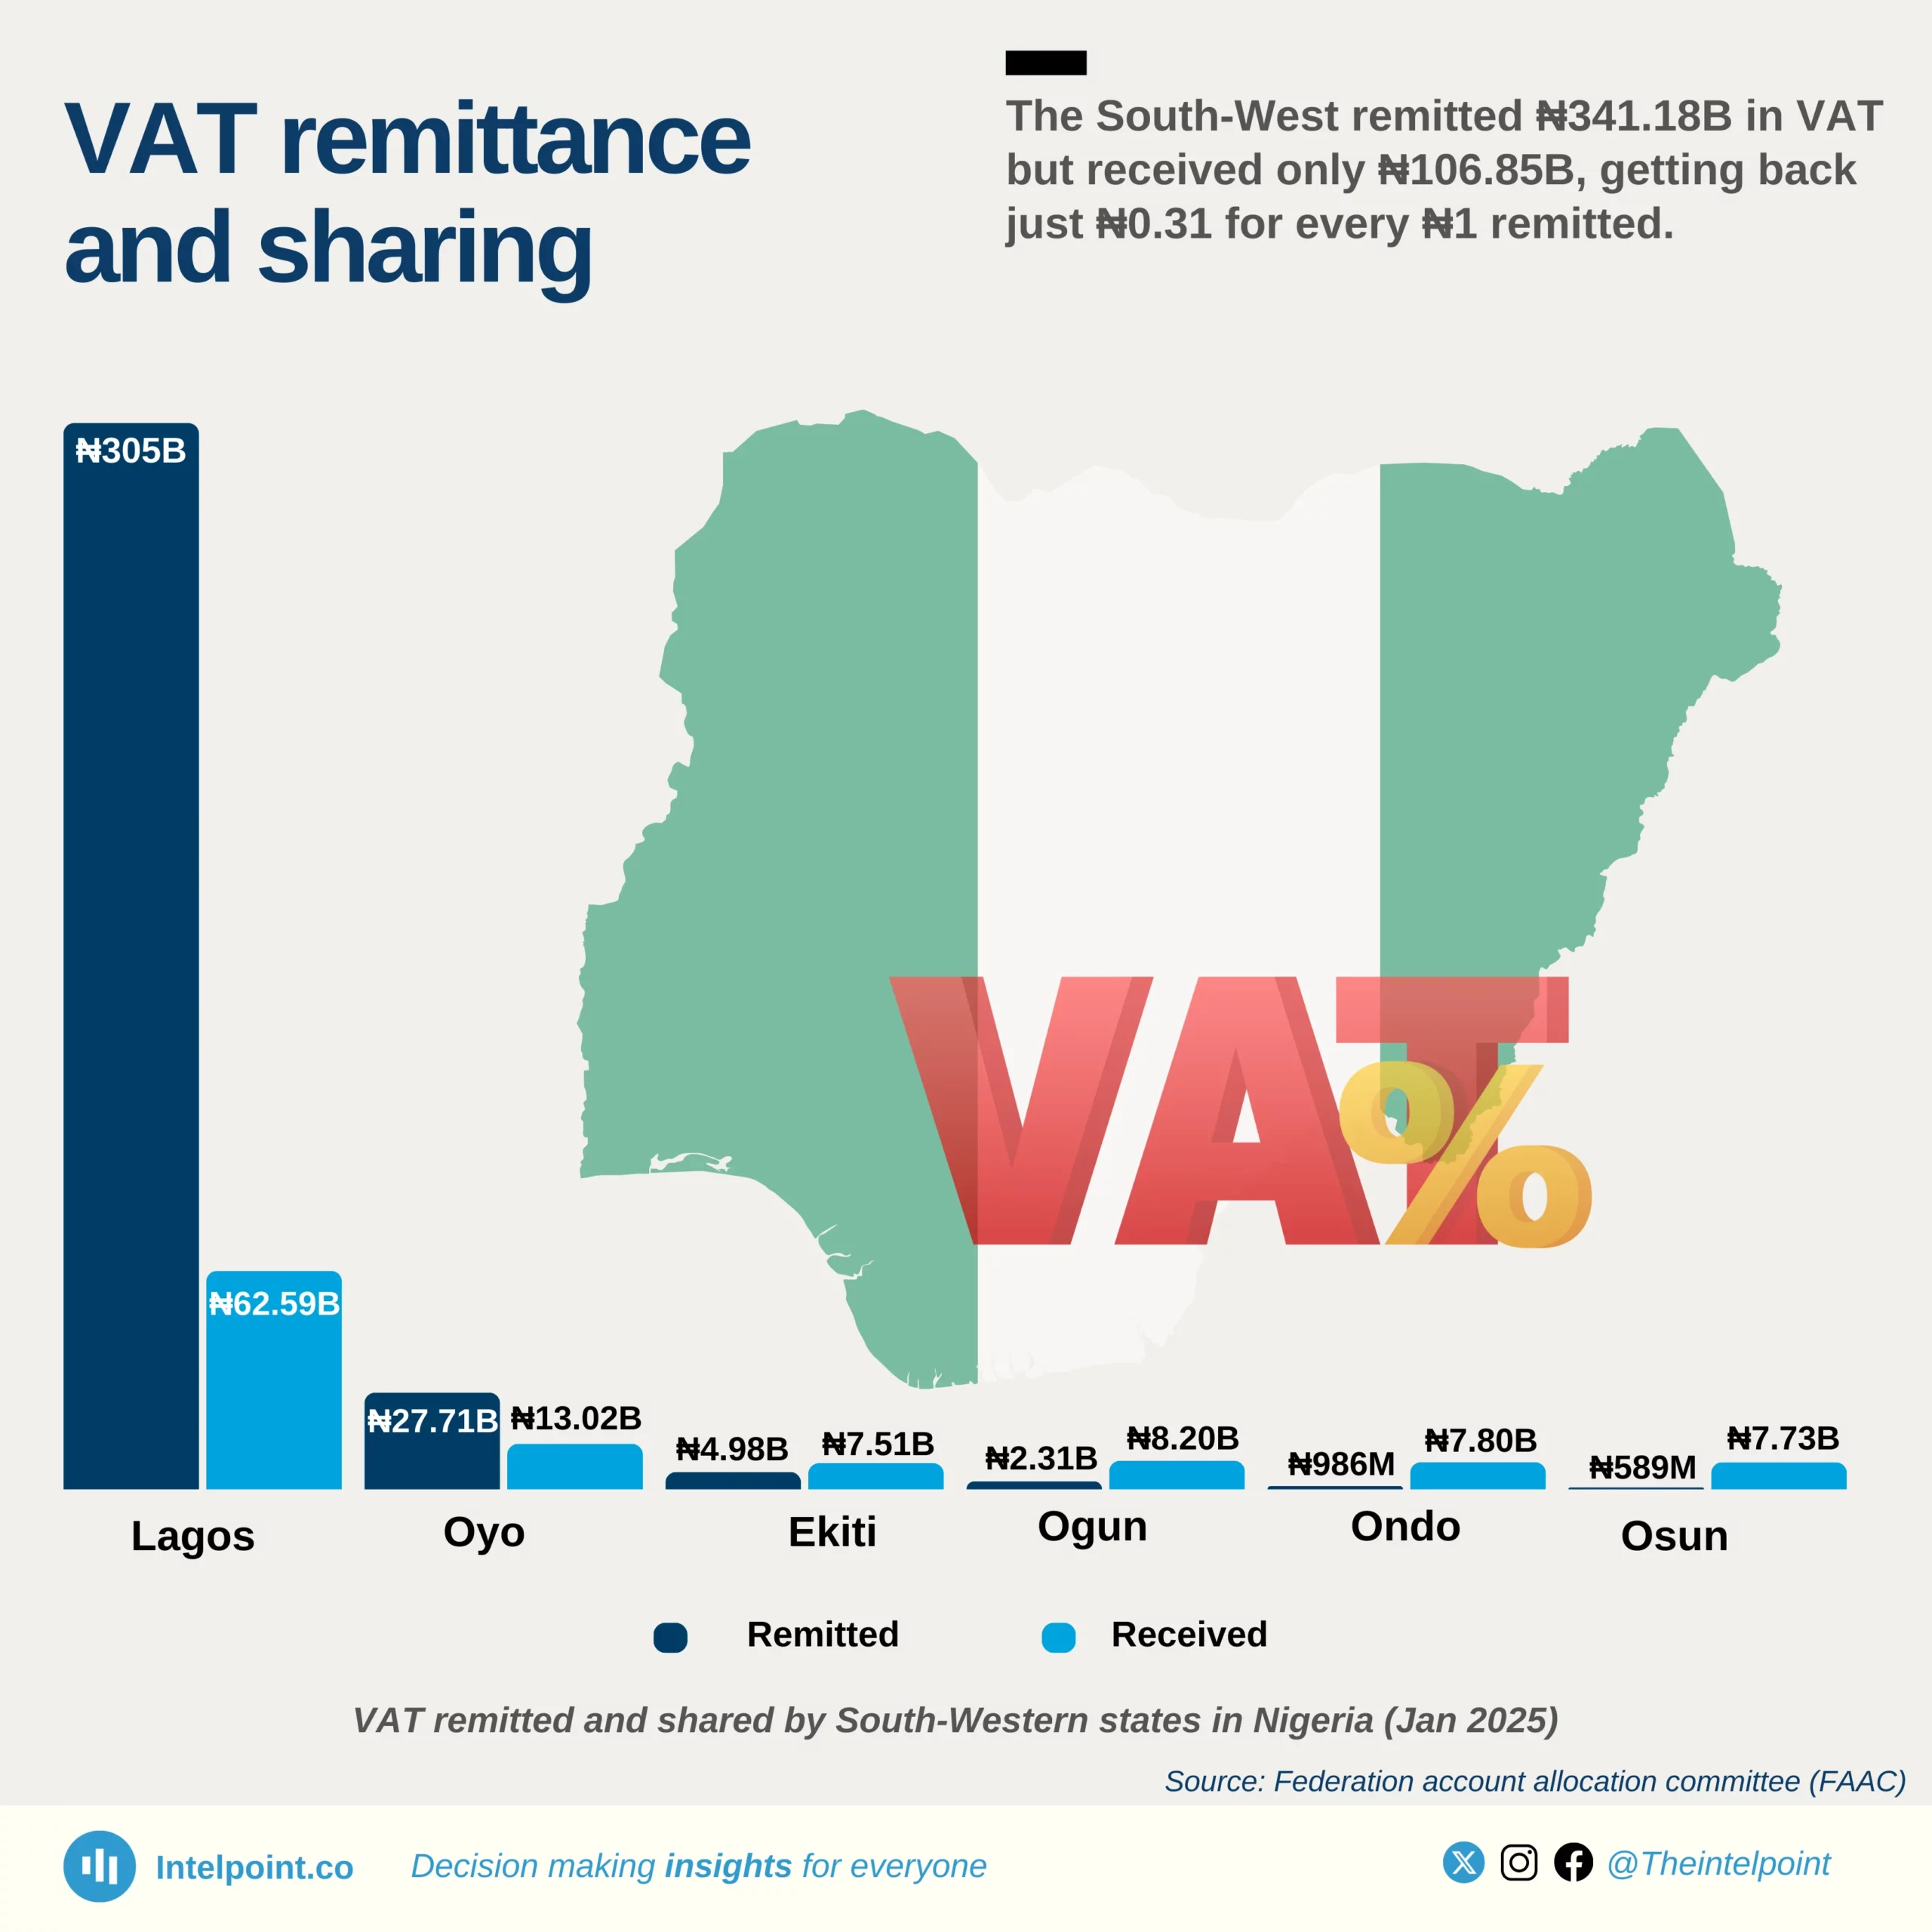
The South-West stands as Nigeria’s VAT powerhouse, generating a staggering ₦341.18 billion in VAT revenue. However, despite its massive economic contribution, the region received only ₦106.85 billion, translating to a 31% return on its VAT remittance.

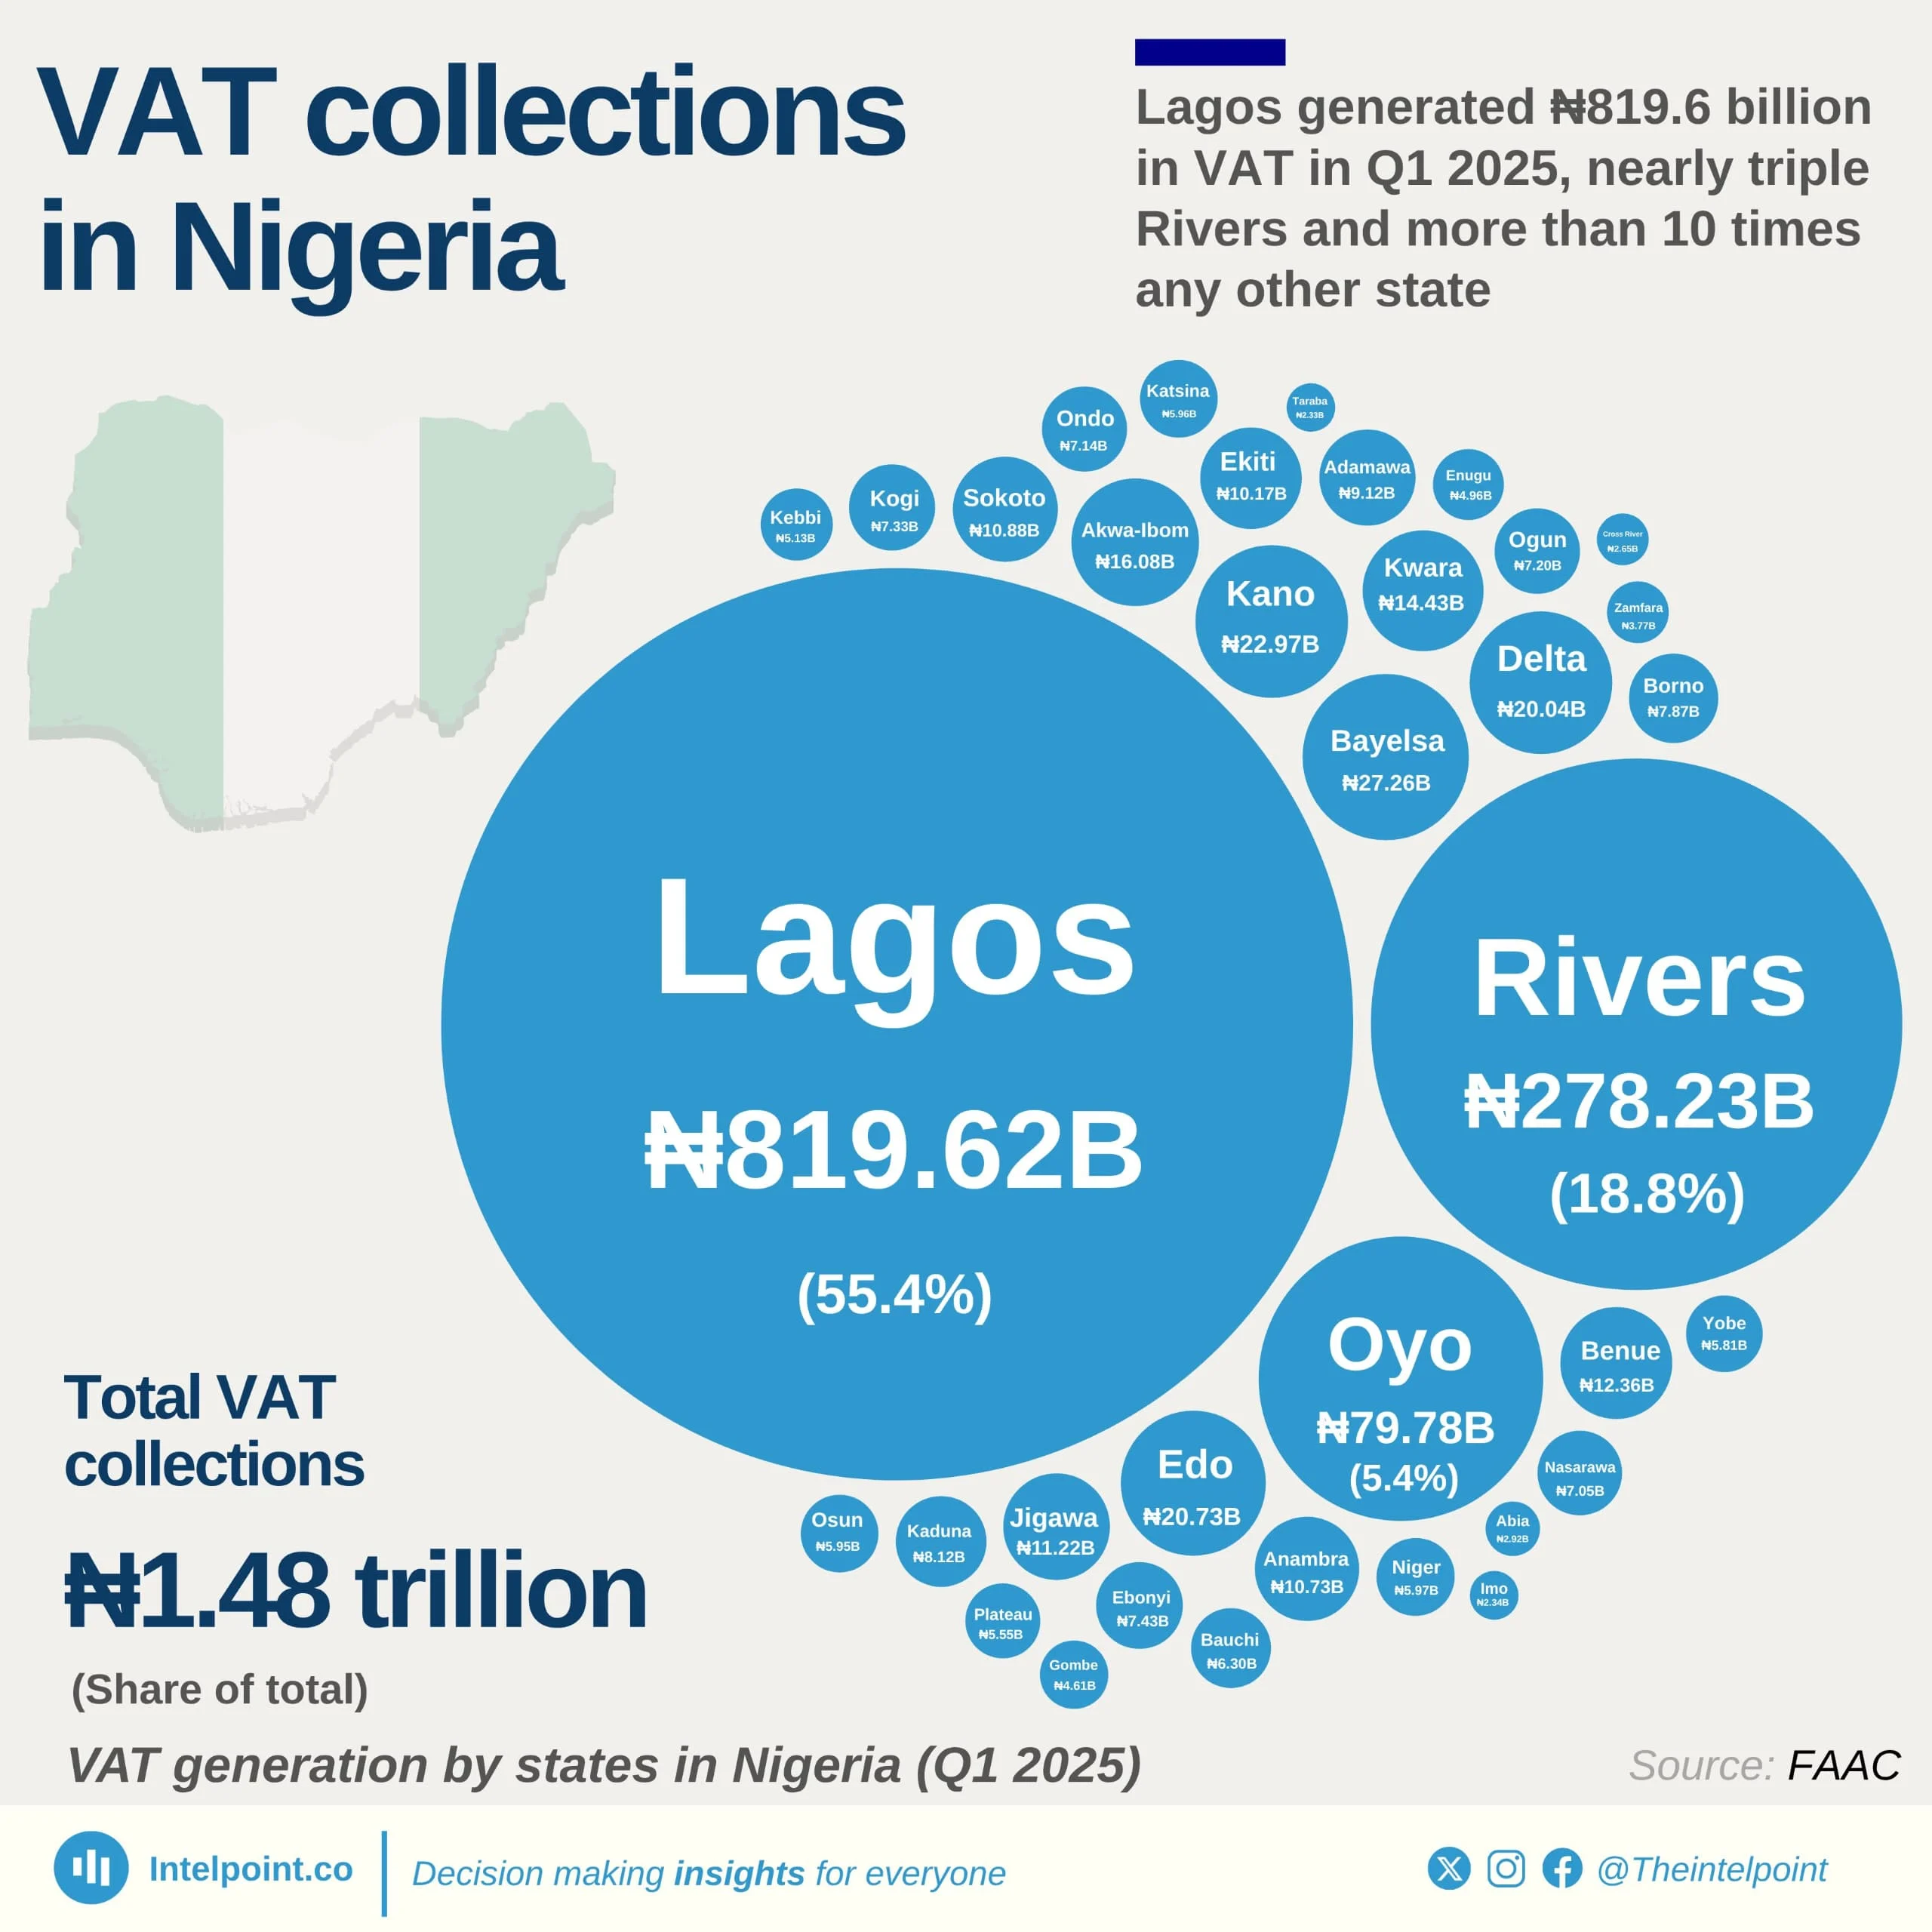
The weight of this burden is disproportionately borne by Lagos, which alone remitted ₦305.52 billion, nearly 90% of the entire region’s VAT. Yet, its allocation stood at just ₦62.59 billion (20.5% of its input), making it the single largest net contributor in the country.

Meanwhile, the sharing formula worked wonders for Osun, which remitted just ₦590 million but astonishingly received ₦7.73 billion, a mind-blowing 1,211% gain. Similarly, Ondo (₦990M contribution) and Ogun (₦2.31B contribution) collectively received ₦16B, far exceeding their inputs.

This extreme fiscal sharing raises serious questions about Nigeria’s VAT allocation formula, as revenue generated by high-performing states is disproportionately funneled into lower-contributing states. The South-West, despite its economic strength, remains one of the biggest victims of VAT imbalance, funding allocations across the federation at a shocking scale.

Source:

Federal account allocation committee (FAAC)

Period:

January 2025
HTML code to embed chart
Want a bespoke report?
Reach out
Tags
Related Insights

After its peak ($8.9b) in 2011, Nigeria's FDI declined almost every year to its lowest ($780m) in 2018, a 91% decline
  • FDI inflows peaked in 2011 at $8.91 billion, the highest in the 35-year period.
  • Between 2005 and 2012, Nigeria saw a sustained boom in FDI, with seven consecutive years above $4 billion.
  • In 2018, Nigeria recorded its lowest FDI inflow in decades at just $0.78 billion.
  • By 2024, FDI stood at $1.08 billion, down 88% from its 2011 peak, reflecting declining investor interest or changing investment climates.

The South West got ₦1 back for every ₦3.60 in VAT, while the North West received ₦2.60 for every ₦1 contributed
  • The South West generated ₦929.86B, over half of Nigeria’s total VAT, but received only ₦258.19B, amounting to ₦1 back for every ₦3.60 contributed.
  • The North West contributed just ₦68.05B but received ₦176.73B, meaning it got back ₦2.60 for every ₦1 generated.
  • The South South, the second-highest contributor at ₦364.99B, got back ₦171.18B, just ₦1 for every ₦2.13 generated.
  • The three southern zones together contributed ₦1.32 trillion in VAT, nearly 90% of the national total, but received less than half of it back.
  • Zones with the lowest generation (North East and South East) received 3 to 4 times their contributions.

Lagos generated ₦819.6 billion in VAT in Q1 2025, nearly triple Rivers and more than 10 times any other state
  • Lagos led the nation with ₦819.62B VAT, over 45% of the total generated by all 36 states combined.
  • Rivers followed distantly with ₦278.23B, around 34% of Lagos’s VAT haul.
  • Only five states (Lagos, Rivers, Oyo, Bayelsa, Kano) generated over ₦21B in Q1 2025.
  • 22 states generated below ₦10B, with 13 of them earning less than ₦6B in VAT.
  • Northern states like Katsina (₦5.96B), Yobe (₦5.81B), and Kebbi (₦5.13B) trail significantly in VAT contributions.
  • Abia, Cross River, Imo, and Taraba sit at the bottom, each with under ₦3B in VAT returns.

2025 sees unprecedented surge as 17,000 candidates score above 300 in JAMB; highest in 13 years
  • No candidate scored above 300 until 2015, with just 40 high scorers that year out of over 1.46 million candidates.
  • 2025 marked the highest ever with 17,025 candidates scoring above 300, nearly double the count in 2024 and more than triple 2023.
  • From 2022 to 2025, above-300 scorers consistently remained over 5,000 each year, showing a steady rise in top scores.
  • Despite the growth in numbers of JAMB candidates, high scorers still make up less than 1% annually.

Aradel, Oando, and Seplat accounted for over 93% of ₦730.7bn profit posted by Nigeria’s listed oil & gas firms in 2024
Key Takeaways:
  • Aradel Holdings led with ₦247.79 billion in PAT, marking a 361% year-on-year growth.
  • Oando and Seplat Energy followed with ₦220.12 billion and ₦214.25 billion in PAT, respectively.
  • Eterna Plc recorded a significant turnaround with 114% year-on-year growth, recovering from a loss in 2023.
  • The sector experienced widespread profitability gains, reflecting stronger market dynamics and operational improvements.
  • Profit after tax growth across the sector ranged from 15% to 361%.
  • Nigeria's oil & gas sector delivered a combined profit totalled ₦730 billion in 2024.

UPDC Plc records highest profit growth among Nigeria’s listed construction and real estate companies in 2024
Key Takeaways:
  • The sector’s total PAT rose by 28% from ₦31.68 billion in 2023 to ₦40.49 billion in 2024.
  • Chapel Hill Denham Nigeria Infrastructure Debt Fund remained the top earner with ₦19.59 billion, despite a modest 4% year-on-year decline.
  • Julius Berger and UPDC REIT also posted strong profits, contributing significantly to the overall performance.
  • UPDC Plc recorded the strongest profit growth, surging by nearly 278% from ₦221.5 million in 2023 to ₦836.9 million in 2024.
  • Ronchess Global Resources Plc significantly narrowed its losses by over 64%, though it remained in negative territory.

POPULAR TOPICS
SIGN UP TO OUR NEWSLETTER
Get periodic updates about the African startup space, access to our reports, among others.
Subscribe Here
Subscription Form

A product of Techpoint Africa. All rights reserved