The ECOWAS share of Nigerian exports to African countries nearly doubled, from 34.2% to 62.1%

  • ECOWAS’ share of Nigerian exports rose from 34.2% in H1 2019 to 62.1% in H1 2025.
  • The most significant share came in H1 2022, when ECOWAS accounted for 75.8% of exports.
  • Exports to other African countries dropped significantly in 2022, to just 24.2%.
  • Nigeria’s total exports to Africa grew from ₦0.9T in H1 2022 to ₦4.8T in H1 2025.
  • ECOWAS consistently maintained a majority share from H1 2022 onwards, with a share above 60%.

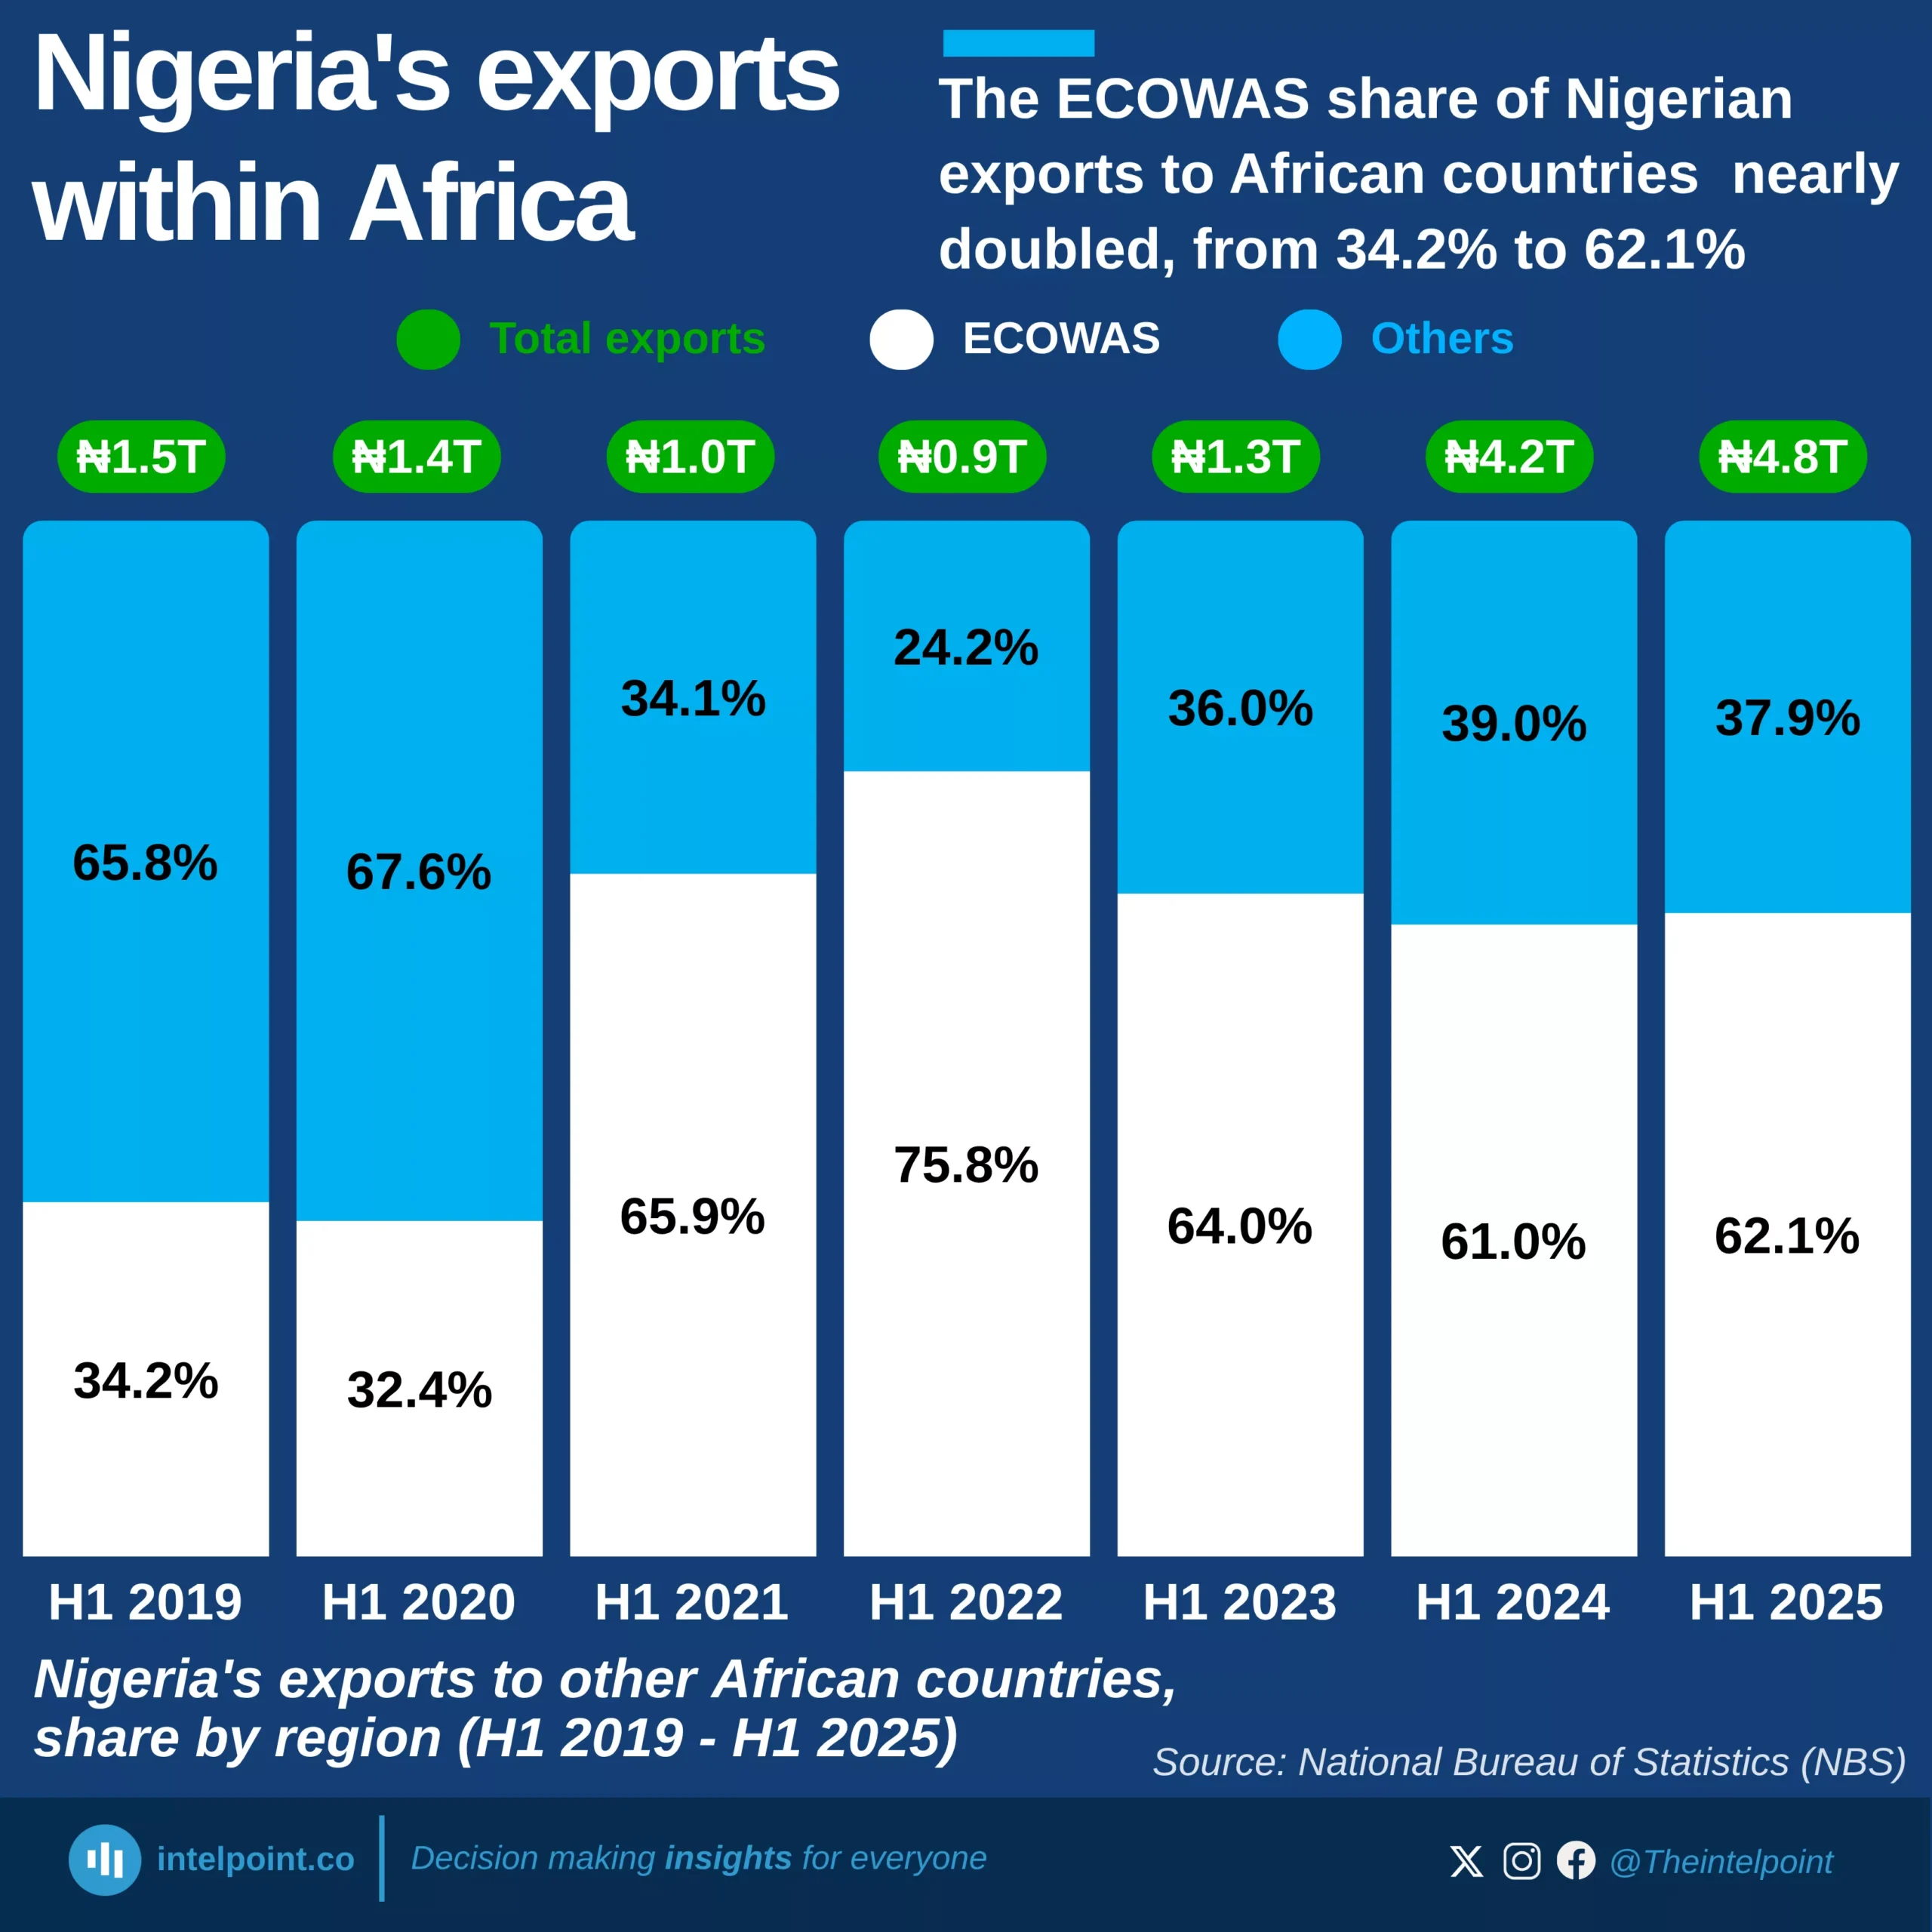
Nigeria’s exports to other African countries have changed, with ECOWAS now accounting for a much larger share of these exports than in previous years. Between H1 2019 and H1 2025, the ECOWAS share nearly doubled from 34.2% to 62.1%, underscoring the growing importance of regional trade within West Africa. This change highlights a deeper integration of Nigeria’s economy with its neighbours', as exports to ECOWAS have become the primary driver of its intra-African trade story.

Source:

National Bureau of Statistics

Period:

H1 2019 - H1 2025
HTML code to embed chart
Want a bespoke report?
Reach out
Tags
Related Insights

Agricultural products led Kenya’s 2024 export economy, with coffee, tea, and spices generating $1.7 bn
  • Agriculture dominated Kenya’s exports, with coffee, tea, and spices alone contributing $1.7 billion, the largest single export category.
  • Mineral fuels were a surprisingly strong second, delivering $1.1 billion, and showing Kenya’s growing role in regional fuel distribution.
  • Horticultural exports (flowers, live plants, and trees) contributed $790 million, reinforcing Kenya’s global strength in floriculture.
  • All other export categories fall below $300 million individually, reflecting a long list of small but diverse export segments such as textiles, vegetables, and pharmaceuticals.

Mining led South Africa’s 2024 exports with 18.7%, as gems and precious metals generated over $20 bn
  • Gems and precious metals were the largest single export category, contributing $20.6 billion.
  • Ores and industrial minerals followed closely with $17.2 billion, showing the country’s reliance on mining.
  • Vehicles and machinery were significant non-mineral exports, with a combined $18.3 billion.
  • Agricultural and light industry products like fruits, nuts, and beverages contributed modestly, strengthening mining and manufacturing’s position as the core export drivers.

Cocoa accounted for 4.6% of Nigeria’s 2024 exports, making it the country’s second-largest export after oil
  • Mineral fuels (including crude oil) accounted for $49.3 billion, or 86.8% of total exports in 2024.
  • Non-oil exports remained marginal, with the second-largest item, cocoa, contributing only 4.6%.
  • Fertilisers, ores, slag, ash, and oilseeds collectively made up less than 5%, indicating limited diversification.
  • All other export categories each contributed 1% or less, underscoring Nigeria’s narrow export base.

Nigeria's energy goods imports have stayed low and stable for 7 years, while exports increased from ₦37B to ₦263B
  • Nigeria’s energy goods exports rose from ₦37.3B in 2017 to ₦262.9B in 2024, before falling to ₦154.2B in H1 2025.
  • Imports remained consistently low, ranging from ₦24.2M to ₦353.1M throughout the period.
  • Export growth outpaced imports, showing a widening trade surplus in energy goods.
  • The 2024 spike in exports represents the highest export value within the nine-year window.
  • Energy imports stayed below ₦400M yearly, indicating low dependency on foreign energy goods.

For most of the period (2013-H1 2025), China's share of Nigeria's imports from Asia hovers around 50%-55%, showing dominance
  • China has dominated Nigeria’s imports from Asia, maintaining a 50–55% share for most of the period.
  • China’s share reached its highest level at 58.6% in H1 2025.
  • India's import share remained volatile, ranging between 11% and 25%.
  • Total imports from Asia surged from ₦2.6 trillion in 2013 to ₦16.4 trillion in H1 2025.

Nigeria's agricultural imports' share has been dropping, from 83.9% (2017) to a low of 42.9% (H1 2025)
  • Agricultural imports fell from 83.9% in 2017 to 42.9% in H1 2025, indicating a significant decline in import dependency.
  • Agricultural exports grew from 16.1% in 2017 to 54.0% in 2024, surpassing imports for the first time since 2017.
  • Total agricultural trade increased from ₦1.1 trillion in 2017 to ₦8.2 trillion in 2024.
  • Between 2022 and 2024, the import share dropped significantly from 75.7% to 46.0%.

POPULAR TOPICS
SIGN UP TO OUR NEWSLETTER
Get periodic updates about the African startup space, access to our reports, among others.
Subscribe Here
Subscription Form

A product of Techpoint Africa. All rights reserved