The dynamic trend of refugee admission in the United States (2012 to 2024)

Key takeaways:

  • From 2012 to 2024, the refugee population in the United States increased by approximately 66%, growing from 262,006 to 435,333.
  • The overall trend indicates steady growth in the number of refugees in America, despite a brief period of stabilisation during 2020-2021.
  • The years from 2022 to 2024 demonstrate a significant rise, with annual totals increasing by more than 72,000 refugees during this time frame.
  • The figure for 2024, at 435,333 refugees, represents the highest number of refugees recorded from 2012 to 2024.

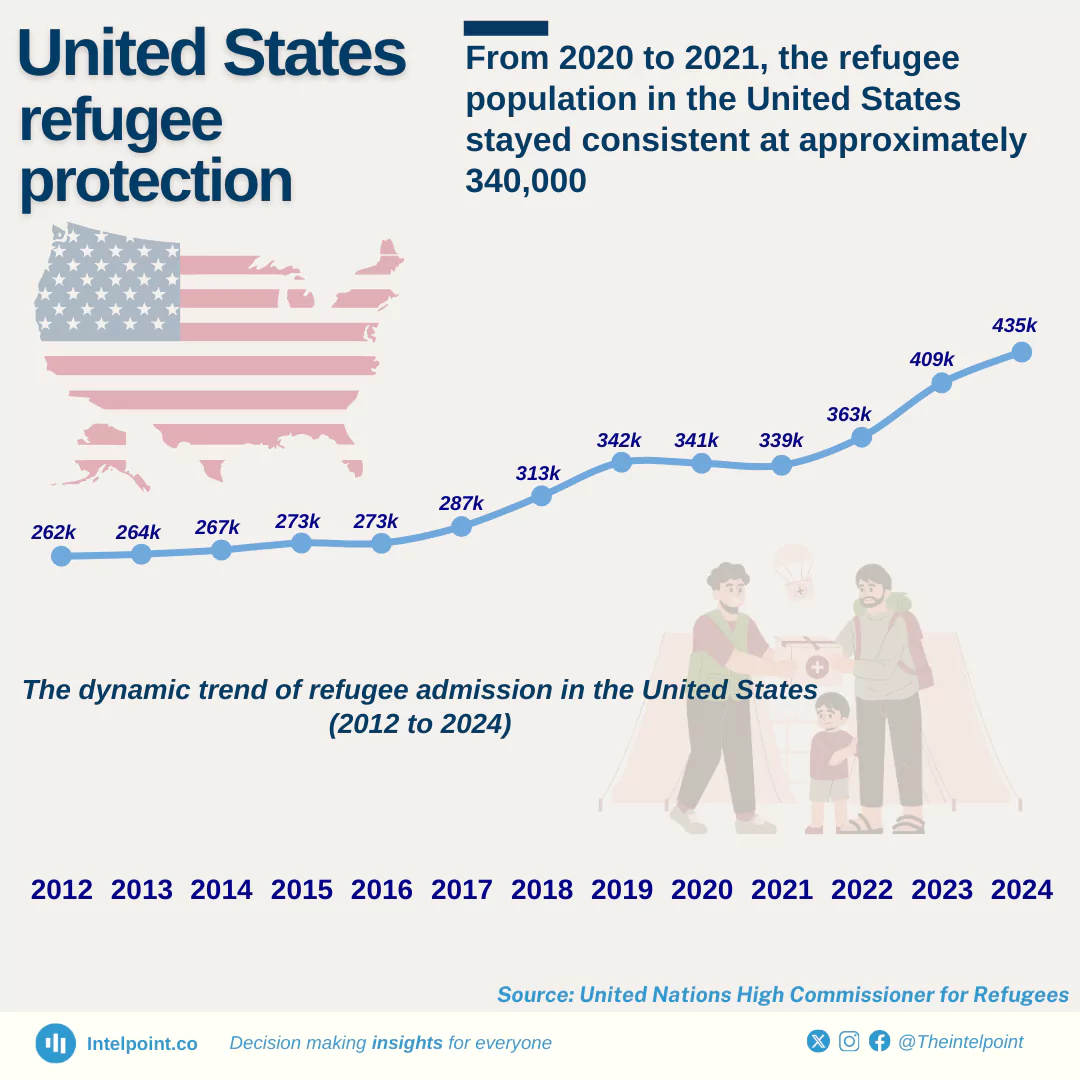
In 2012, the United States granted refuge to 262,006 individuals under the mandate of the United Nations High Commissioner for Refugees (UNHCR). The early years showed modest increases, with the number growing to 267,214 by 2014. By 2017, the refugee count rose to 287,135, reflecting a 9.9% increase from 2012.


A significant shift occurred between 2017 and 2019 when the refugee population under UNHCR's mandate increased substantially to 341,715. The period of the COVID-19 pandemic (2020-2021) recorded a slight decline in the number of refugees, with numbers stabilising around 340,000. However, this decline was temporary as 2022 and 2023 recorded an increase of about 70,000 combined. The refugee population reached 435,333 by the end of 2024, the highest number recorded in the United States from 2012 to 2024.

Source:

United Nations High Commissioner for Refugees

Period:

2012-2024
HTML code to embed chart
Want a bespoke report?
Reach out
Tags
Related Insights

42% of Nigeria’s applications have been rejected over the past 15 years amidst surging demand for Schengen visas
  • Nigerians submitted 1.1 million Schengen visa applications between 2009 and 2024.
  • The highest rejection rates occurred in 2017 (53%) and 2019 (51%).
  • A total of 491,844 applications were rejected, a cumulative denial rate of 42.1%.
  • Despite post-pandemic recovery, 2024 recorded the highest applications (111k), with a 45% rejection rate.
  • The year 2010 stands out as the period with the least number of Schengen visa applications submitted by the Nigerian consulate.

Comoros topped Schengen visa rejection rates in 2024 with 62.90%, despite Algeria leading globally by total denials of 185,101
  • Comoros leads with a striking 62.8% rejection rate, the highest not just among African consulates, but also the global consulate countries

  • Guinea-Bissau, Senegal, and Nigeria follow with rejection shares between 45% and 47%.

  • Despite having one of the highest total visa rejections globally, Algeria does not appear in this chart, as its rejection share is comparatively lower.

  • Countries with smaller applicant pools tend to have higher rejection rates, shedding light on access disparities and approval scrutiny in consulate processes.


In 2024, Algeria had the most Schengen visa rejections of any country. Right behind it were India and Turkey
  • Algeria recorded the highest number of Schengen visa denials in 2024, with 185,101 applications not issued, representing 35.0% of its total requests.
  • Six countries out of the top 15 global consulate countries with the highest visa denials were from Africa -Morocco, Nigeria, Egypt, Senegal, Tunisia, and Algeria.
  • Nigeria, Senegal, and Pakistan showed alarmingly high rejection rates, each with over 45% of visa applications refused.
  • Collectively, over 1.7 million Schengen visa applications were not issued worldwide in 2024.
  • European consulates located in African and Asian countries made up a significant share of the rejections.

Eritrea's net migration rate in 2024 is over 40 times lower (in absolute terms) than Nigeria's net migration rate
  • Eritrea has the highest net migration loss in Africa at -8.7 per 1,000 people.
  • Nigeria's net migration rate of -0.2 is significantly lower than any country in the top 10 list.
  • Sao Tome and Principe and Eswatini follow Eritrea with rates of -6.5 and -6.0, respectively.
  • Lesotho also experiences substantial out-migration, with a net rate of -4.5 per 1,000.
  • Three countries—Rwanda, Uganda, and CAR—have the same net migration rate of -3.1.

South Sudan's net migration rate of 19.1 per 1,000 significantly led all other African territories on the 2024 top 10 list
  • South Sudan ranks 2nd globally and 1st in Africa in net migration, with 19.1 migrants per 1,000 population.
  • Equatorial Guinea is the only other African country in the global top 10, with a rate of 12.1 per 1,000.
  • Djibouti (4.2), Gabon (3.5), and Botswana (2.7) round out the top 5 within Africa but trail far behind the top two.
  • Nigeria shows negative migration (-0.2), indicating more people are leaving than coming in.

Côte d'Ivoire has remained among the top three countries in African migrant stock since 1960
  • Africa's migrant stock continues to rise, with several countries exceeding one million migrants in 2015.
  • Burkina Faso and the Democratic Republic of Congo round out the top ten, with over half a million migrants each.
  • Despite being Africa's youngest country, South Sudan ranked sixth, showing the country's rapid migration growth.
  • South Africa has led since 2010, despite facing fluctuations in the migrant stock.
  • East Africa sees significant migration, with Kenya and Ethiopia both exceeding one million migrants.

POPULAR TOPICS
SIGN UP TO OUR NEWSLETTER
Get periodic updates about the African startup space, access to our reports, among others.
Subscribe Here
Subscription Form

A product of Techpoint Africa. All rights reserved