South Africa dominates Africa's battery energy storage pipeline, with over three times the capacity of Egypt, the next largest market

  • South Africa dominates with 30 battery storage systems, the largest by far.
  • Egypt is the second-largest market with 7 projects, while Morocco has 4.
  • Nigeria and Senegal have five projects each (operational + pipeline).
  • Several countries, including Ghana, Togo, Angola, Botswana, DR Congo, and Mauritius, each have just one or two projects, indicating an uneven spread across the continent.
  • South Africa also leads in systems under construction (7).
  • Operational projects are still limited continent-wide, with most systems either under construction or in the planning pipeline.

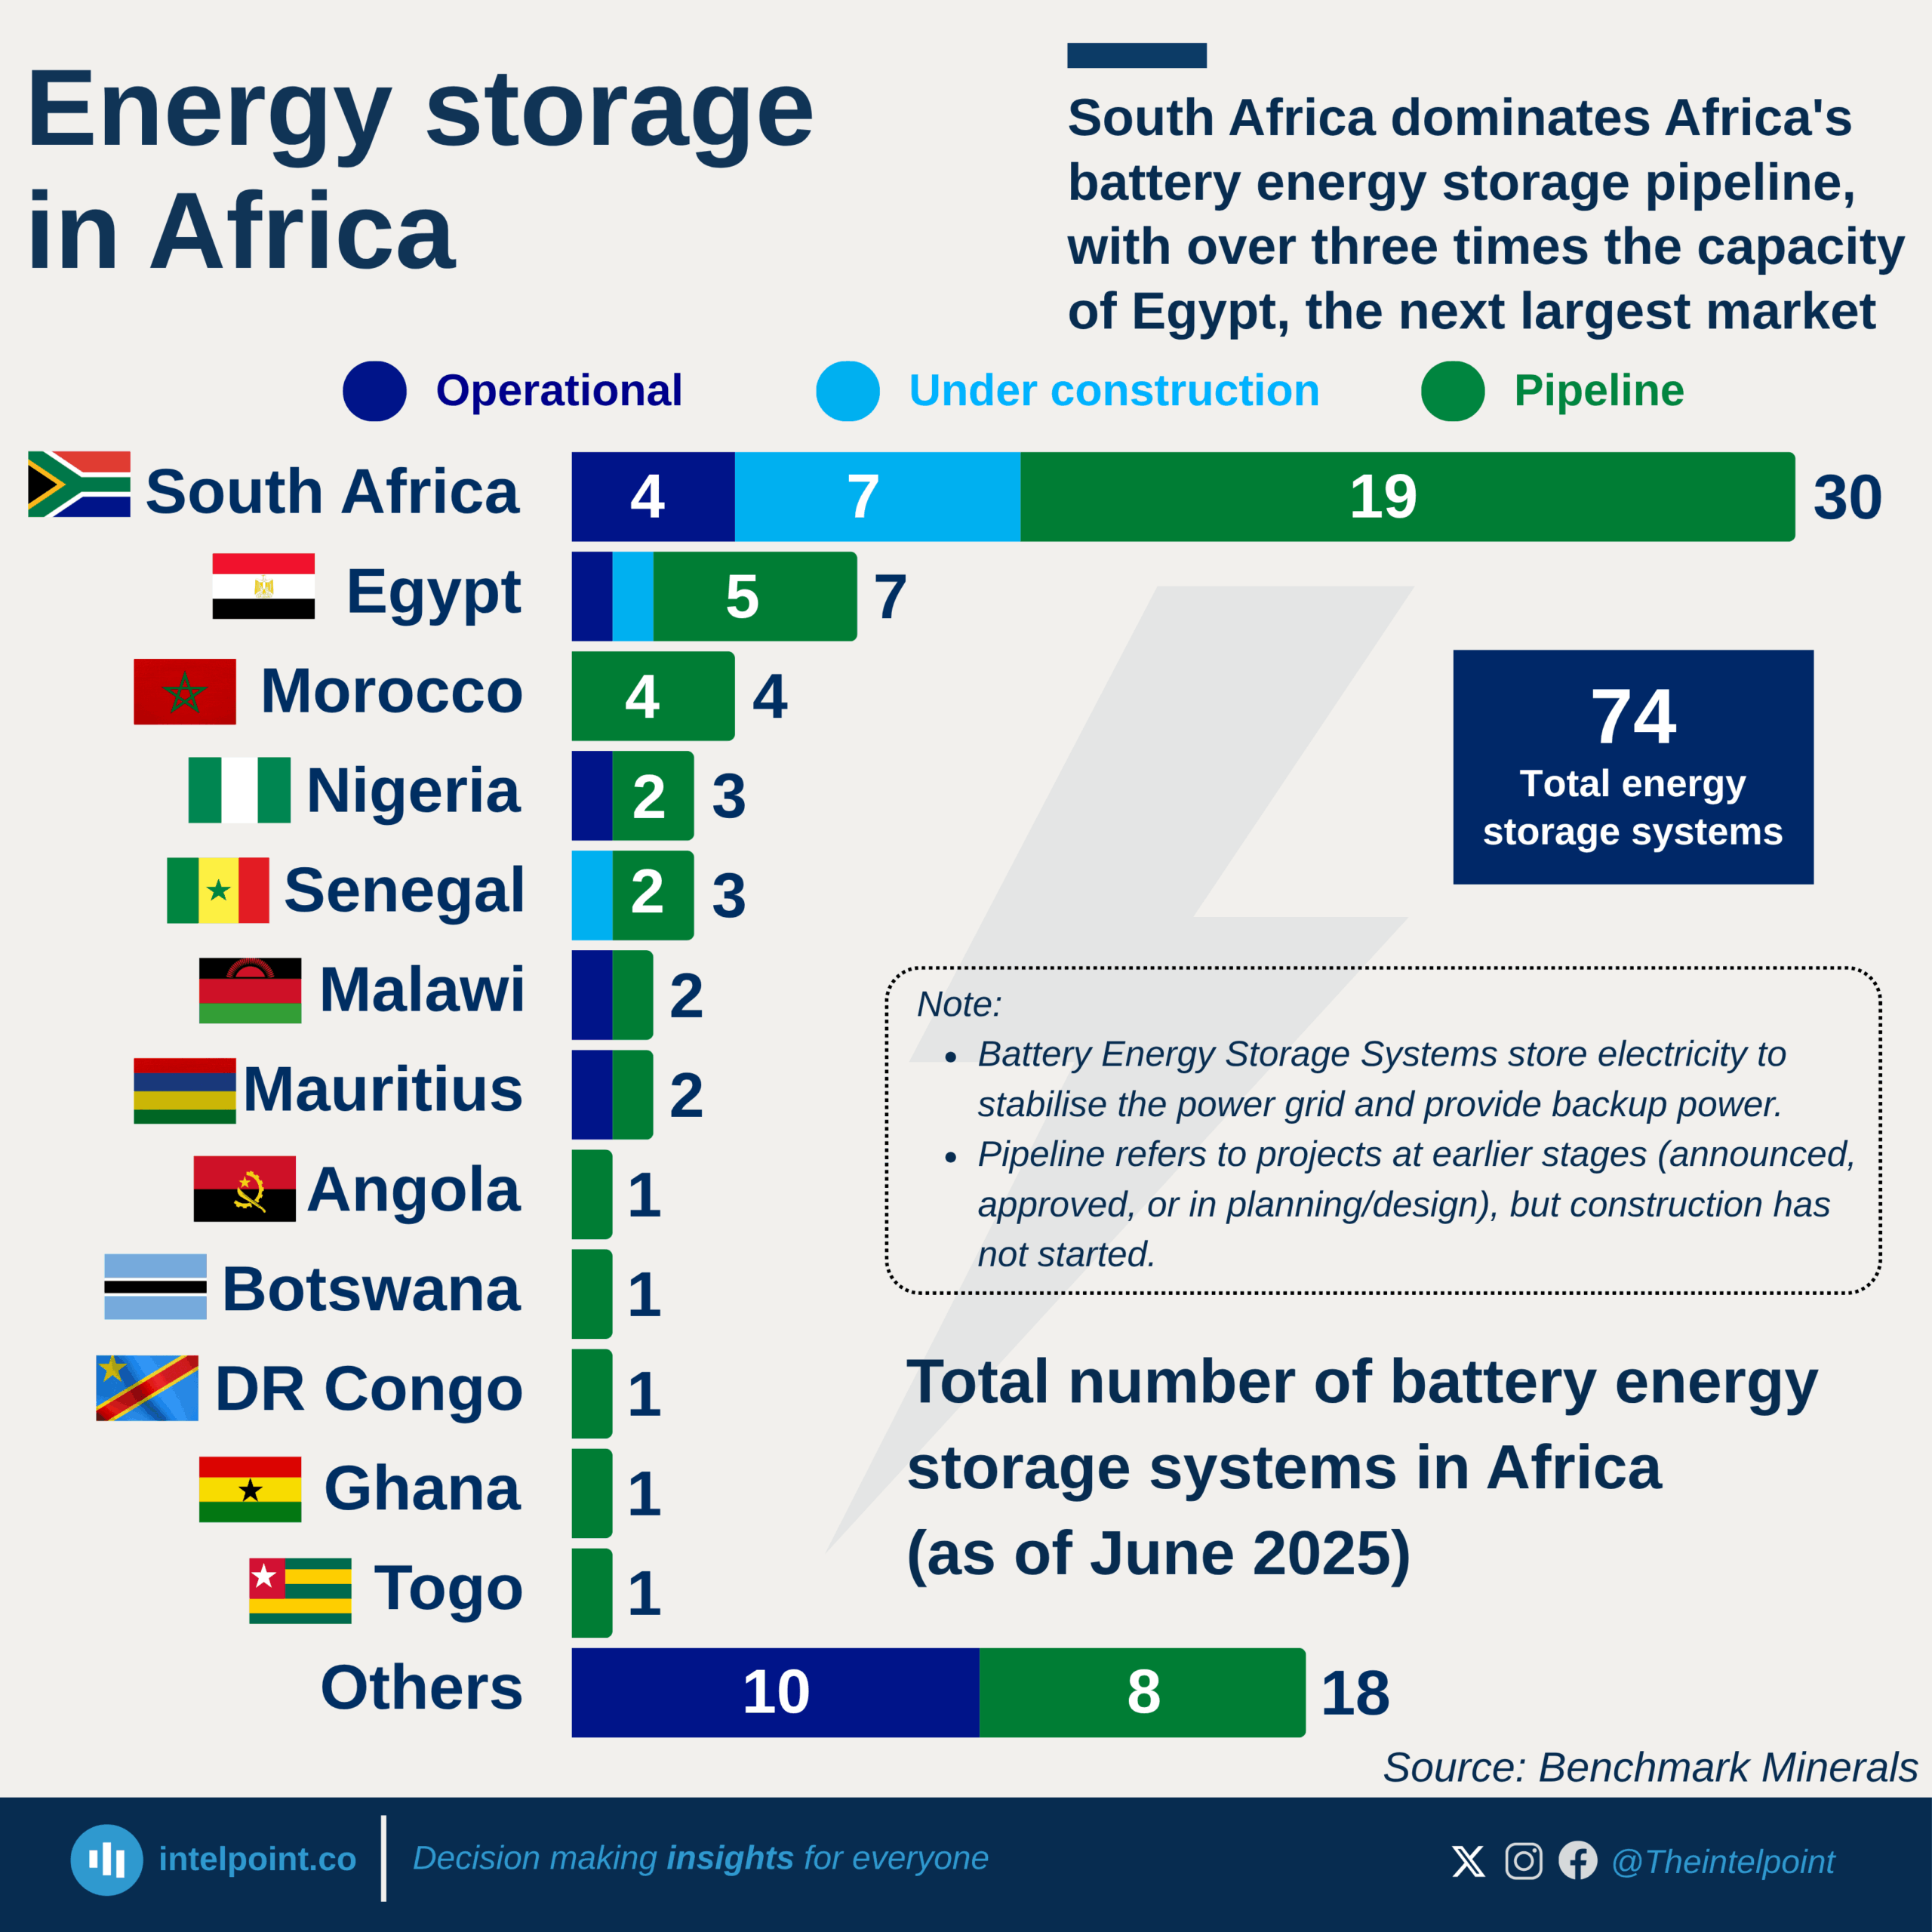
Africa’s battery energy storage sector is beginning to take shape, with South Africa emerging as the clear leader. The country has 30 storage systems, more than three times the size of Egypt’s pipeline and far ahead of any other African market. This dominance underscores South Africa’s aggressive push to stabilise its power grid, reduce dependence on coal, and integrate renewable energy sources at scale. In contrast, while other countries are making strides, their projects are fewer in number and smaller in capacity.

Source:

Benchmark Minerals

Period:

June 2025
HTML code to embed chart
Want a bespoke report?
Reach out
Tags
Related Insights

Nigeria’s urban electrification has stalled below 90% for over three decades
  • Urban electricity access has remained between 80% and 89% since 1990, never crossing to 90%.
  • The inability to achieve universal access suggests that infrastructure expansion has struggled to keep pace with rapid urbanisation and population growth.
  • Periodic dips in access, such as in 2010 and 2015, point to challenges in maintaining consistent electricity supply rather than just extending connections.
  • Insufficient generation, outdated grids, and policy inefficiencies have constrained Nigeria’s ability to deliver reliable and universal electricity access even in its urban centres.

Only one in three rural Nigerians have access to electricity after three decades of progress
  • Rural electricity access increased from just 4% in 1990 to about 33% in 2023, showing gradual progress over three decades.
  • The data reveals irregular jumps in certain years—such as 2003, 2011, and 2016—likely tied to temporary electrification programmes or revised data estimates. D
  • espite improvements, nearly two-thirds of rural Nigerians still lack electricity, underscoring a wide disparity in energy access across regions.
  • The slow rate of expansion highlights ongoing issues with investment, grid extension, and maintenance that continue to limit rural electrification efforts.

Nigeria’s renewable energy capacity held steady at 2.1–2.3 GW from 2015 to 2021, then surged from 2022 onward
  • Nigeria’s renewable energy capacity grew from 2.1 GW in 2015 to 3.7 GW in 2024.
  • This represents a 76% increase over the decade.
  • The compound annual growth rate (CAGR) was 5.7% between 2015 and 2024.
  • From 2015 to 2020, capacity was stagnant at around 2.2 GW.
  • The biggest growth year was 2022, with a sharp 34.9% increase.
  • Capacity stagnated in 2023 at 3.1 GW before climbing again in 2024.
  • Nigeria’s renewable growth remains modest compared to its population size and energy demand.

From 2015 to 2024, Morocco's renewable capacity grew from 2.4 GW to 4.0 GW, a 67% increase
  • Morocco’s renewable energy capacity grew from 2.4 GW in 2015 to 4.0 GW in 2024.
  • This represents a 67% increase over the decade.
  • The compound annual growth rate (CAGR) was 5.3% between 2015 and 2024.
  • Capacity was stagnant at 2.4 GW from 2015 to 2017 before growth resumed.
  • The biggest single-year increase happened in 2022, with a 13.7% jump.
  • Capacity additions slowed in 2023 (3.7 GW) and 2024 (4.0 GW).

From 2015 to 2024, South Africa's renewable energy capacity more than tripled, from 3.4 GW to 13.5 GW
  • South Africa’s renewable energy capacity grew from 3.4 GW in 2015 to 13.5 GW in 2024.
  • The country recorded a CAGR of 14.7% over the period.
  • The biggest annual growth was in 2016, when capacity surged by 49.2%.
  • Stagnation occurred in 2021 (0.8% growth) and 2023 (0.0%), reflecting project delays or policy issues.
  • The most recent increase was in 2024, when capacity rose to 13.5 GW, showing renewed momentum.
  • South Africa’s renewable energy capacity is more than three times Nigeria’s 3.7 GW in 2024.

From 2015 to 2024, Kenya's renewable capacity almost doubled, increasing from 1.6 GW to 3.1 GW
  • Kenya’s renewable energy capacity grew from 1.6 GW in 2015 to 3.1 GW in 2024.
  • This represents a near doubling of capacity in less than a decade.
  • The compound annual growth rate (CAGR) was 6.9% between 2015 and 2024.
  • The largest single-year jump came in 2016 with a 23.2% increase.
  • Kenya faced a setback in 2021 when capacity dipped by -8.6%.
  • A strong rebound occurred in 2022 (+15.5%), reaffirming momentum.

POPULAR TOPICS
SIGN UP TO OUR NEWSLETTER
Get periodic updates about the African startup space, access to our reports, among others.
Subscribe Here
Subscription Form

A product of Techpoint Africa. All rights reserved