Somalia's official exchange rate (SOS per US$) has generally trended upwards from 2015 to 2024, reaching 28,118.33 SOS per US$

Key takeaways:

  • Somalia’s currency has depreciated by 26.4% between 2015 and 2024.
  • The sharpest yearly depreciation was in 2019, at 4.64%.
  • From 2020 to 2021, the SOS saw its smallest year-on-year shift at 1.08%.
  • Despite fluctuations, every year from 2015 to 2024 recorded a net increase in SOS per US$.
  • 2017 recorded near-stable currency performance with just a 0.16% change from the previous year.

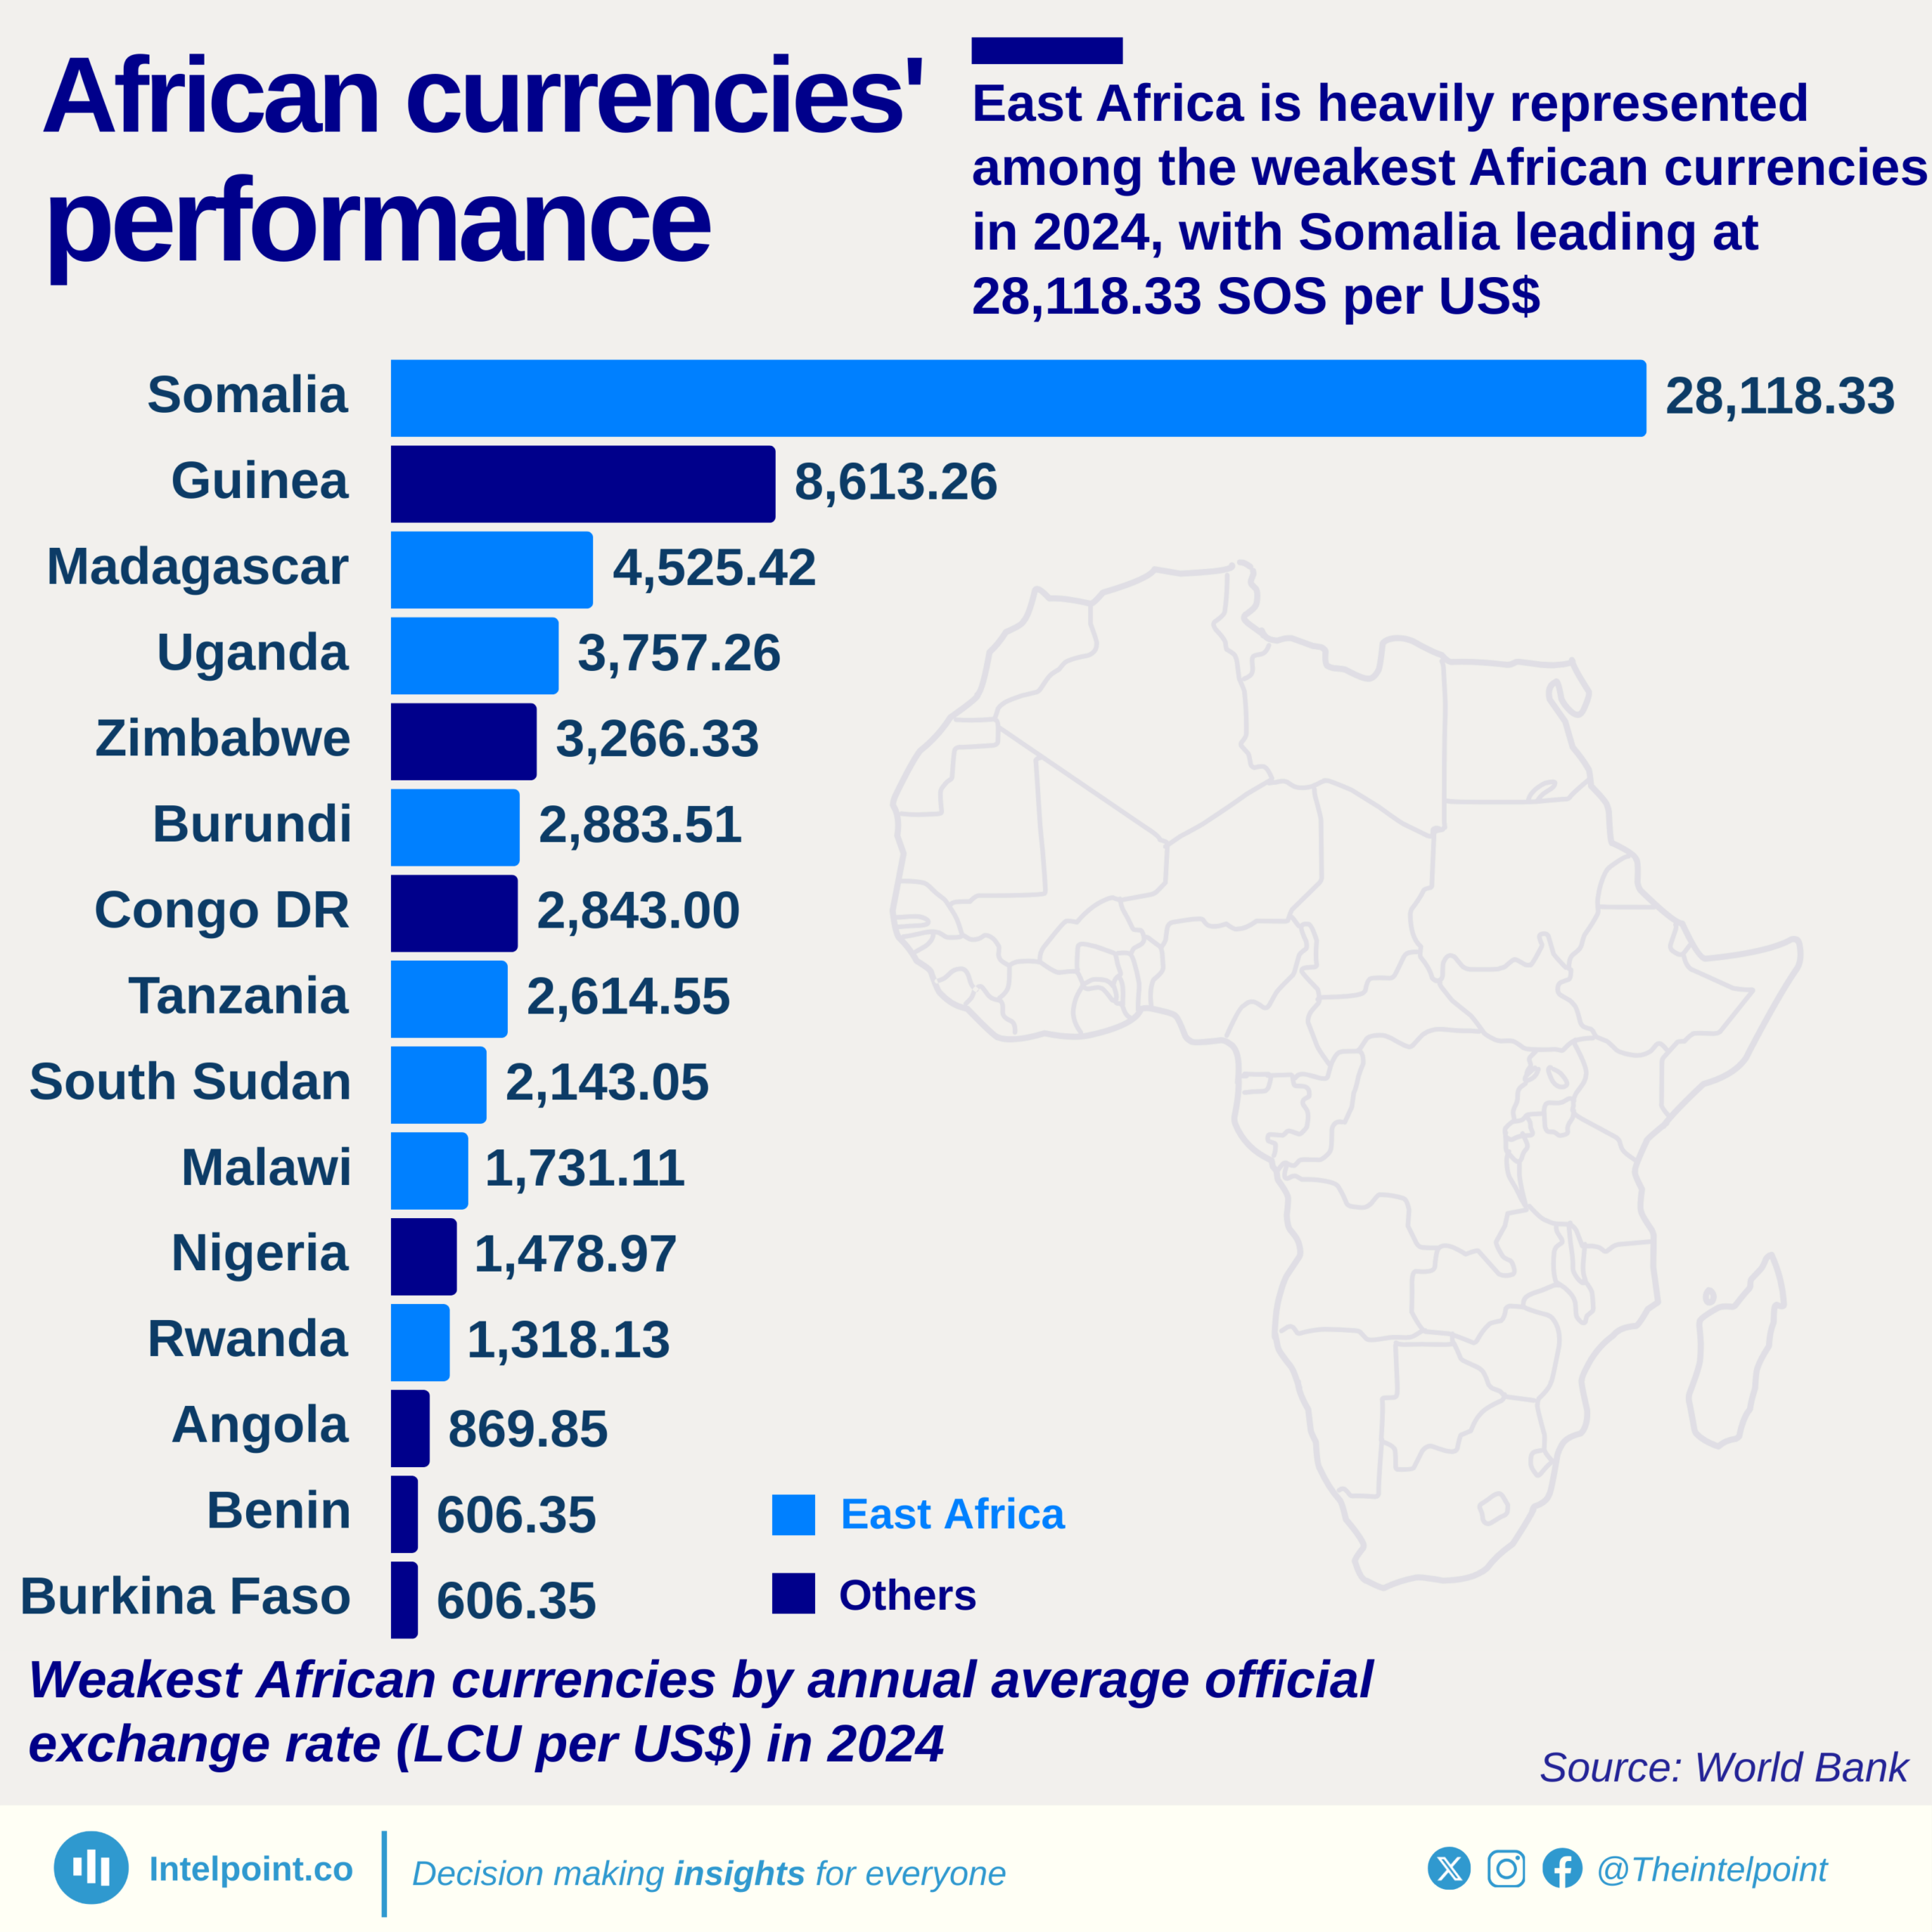
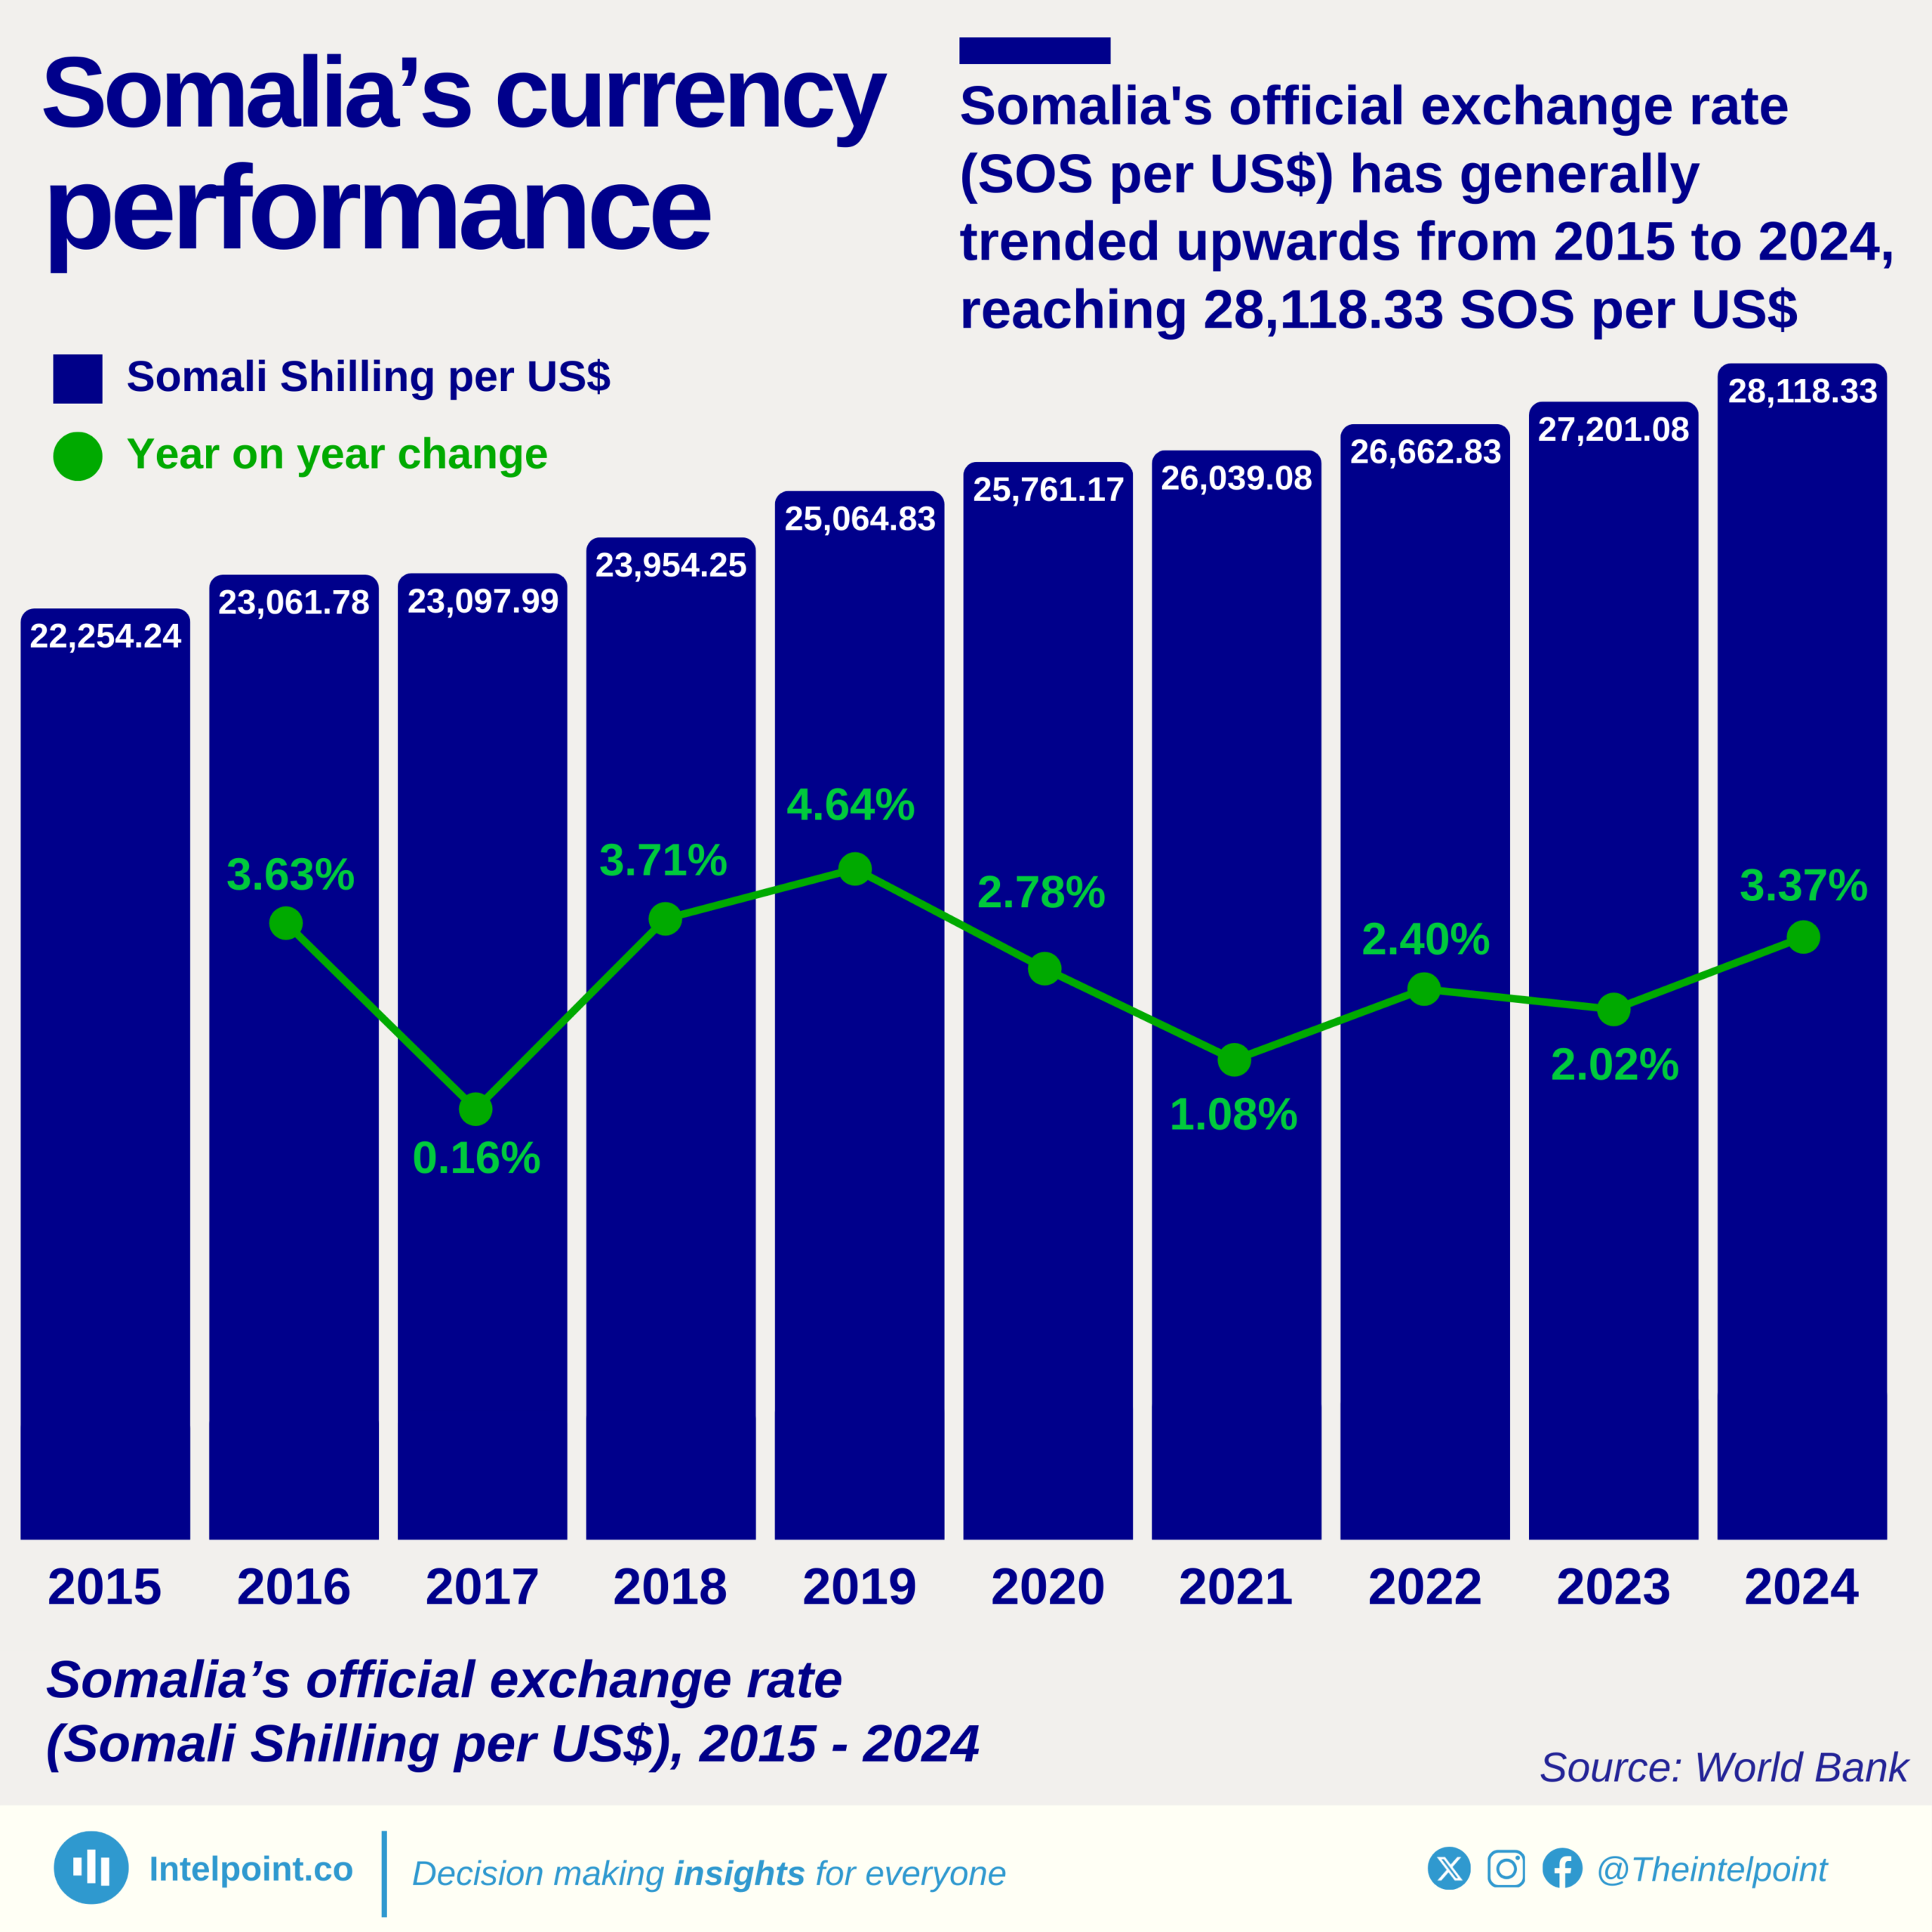
The Somalian currency has proven to be one of the weakest in Africa since 2015. The country's official exchange rate has shown a consistent upward trend over the past decade, with the Somali Shilling depreciating from 22,254.24 SOS per US$ in 2015 to 28,118.33 SOS per US$ in 2024.  While the annual rate of change has fluctuated, the general direction is clear: a weakening domestic currency. The year-on-year depreciation averaged around 2.7% over the period, with 2019 marking the steepest annual jump of 4.64%. This gradual decline in the currency's value reflects deeper economic and monetary realities in the country.

Source:

World Bank

Period:

2015 - 2024
HTML code to embed chart
Want a bespoke report?
Reach out
Tags
Related Insights

Nigeria's naira depreciated by 129% in 2024, hitting an average of 1,479 NGN per US$
  • The Nigerian naira depreciated by a record-breaking 129.23% in 2024, the highest drop in the last decade.
  • From 2015 to 2022, the naira's depreciation was relatively controlled, rarely exceeding 20% year-on-year.
  • The exchange rate remained nearly flat from 2017 to 2019, showing signs of stability.
  • In 2023, the naira lost over half its value (51.46%), marking the beginning of the current volatility wave.
  • The exchange rate crossed the ₦1,000/$ threshold in 2024 for the first time in history.

North Africa dominates the strongest African currencies in 2024, with Tunisia taking the lead at TND 3.11/USD
  • Tunisia held the top spot with the strongest African currency, trading at 3.11 TND per USD in 2024.
  • Libya followed as the second-strongest, with an exchange rate of 4.83 LYD per USD.
  • Morocco maintained a strong regional position, with its dirham trading at 9.94 MAD per USD.
  • Botswana’s pula was relatively stable, exchanging at 13.56 per USD, highlighting Southern Africa’s economic steadiness.
  • Ghana and Seychelles had closely matched exchange rates, trading at 14.48 and 14.53 to the dollar, respectively.
  • South Africa, Lesotho, Namibia, and Eswatini all shared almost identical exchange rates of around 18.32–18.33 per USD, showing tight regional monetary coordination.

After a period of fluctuation, Tunisia's currency has demonstrated a stabilised exchange rate since 2022 at around 3.11 TND per US$
  • The Tunisian dinar stood at TND 2.15 per US$ in 2016 and has since depreciated to TND 3.11 per US$ in 2024.
  • Between 2016 and 2019, the dinar saw a strong depreciation.
  • 2020 marked a turning point with a 4.16% appreciation, the first notable currency strengthening in the period observed.
  • From 2022 onward, the exchange rate has stabilised closely around TND 3.10 to TND 3.11 per US$, with minimal yearly changes of 0.08% and 0.04%.
  • The largest year-on-year depreciation occurred in 2017 with a 12.63% change.
  • Despite the earlier years of high volatility, Tunisia’s currency performance in the last three years suggests better monetary management and external stability.

Southern Africa's debt-to-GDP ratio is expected to rise by 5.8 percentage points, contrasting with declines in other regions
  • Unlike other regions, Southern Africa’s debt-to-GDP ratio is expected to increase by 5.8 percentage points, reaching 77.4% by 2028.
  • Northern Africa is set to achieve the largest debt-to-GDP decline of 14.7 percentage points, from 84.2% to 69.5%, indicating significant fiscal adjustments.
  • Central Africa is expected to see a 12 percentage point drop, reducing its debt-to-GDP ratio from 45.8% to 33.8%.
  • West Africa’s debt-to-GDP ratio is projected to fall by 4.3 percentage points, while Eastern Africa is expected to drop by 5.2 percentage points, both showing signs of improved debt management.
  • Even with the projected declines, some regions like Northern Africa (69.5%) and Southern Africa (77.4%) will still have high debt burdens compared to others like Central Africa (33.8%).
  • The declining debt-to-GDP ratios in most regions suggest either economic expansion or strategic debt control, but Southern Africa’s increase indicates potential fiscal stress.

Fifteen months into President Tinubu’s tenure, the rate of one dollar to naira has gone up by 245%
When Olusegun Obasanjo took office in 1999, the exchange rate was ₦97 to $1; it was ₦128 under Yar'Adua in 2007. During Jonathan's tenure in 2010 it was ₦151 while it was ₦199 when Buhari was in office. Despite efforts to let market forces decide the rate, the naira continues to weaken. Will the current administration turn things around soon?

POPULAR TOPICS
SIGN UP TO OUR NEWSLETTER
Get periodic updates about the African startup space, access to our reports, among others.
Subscribe Here
Subscription Form

A product of Techpoint Africa. All rights reserved