Oilseed Meal & Cake top the list of Nigeria’s agricultural exports to the United States, occupying 26% of the total exports in 2024

Key Takeaways:

  • Oilseed meal and cake constituted the United States' largest agricultural import from Nigeria, valued at $29.9 million.
  • Total US agricultural imports from Nigeria in 2024 amounted to $114.7 million.
  • Cocoa beans represented 19% ($21.8 million) of Nigeria's agricultural exports to the US.
  • Oilseed, cocoa, and tea collectively accounted for 59% of the total agricultural exports from Nigeria to the United States.

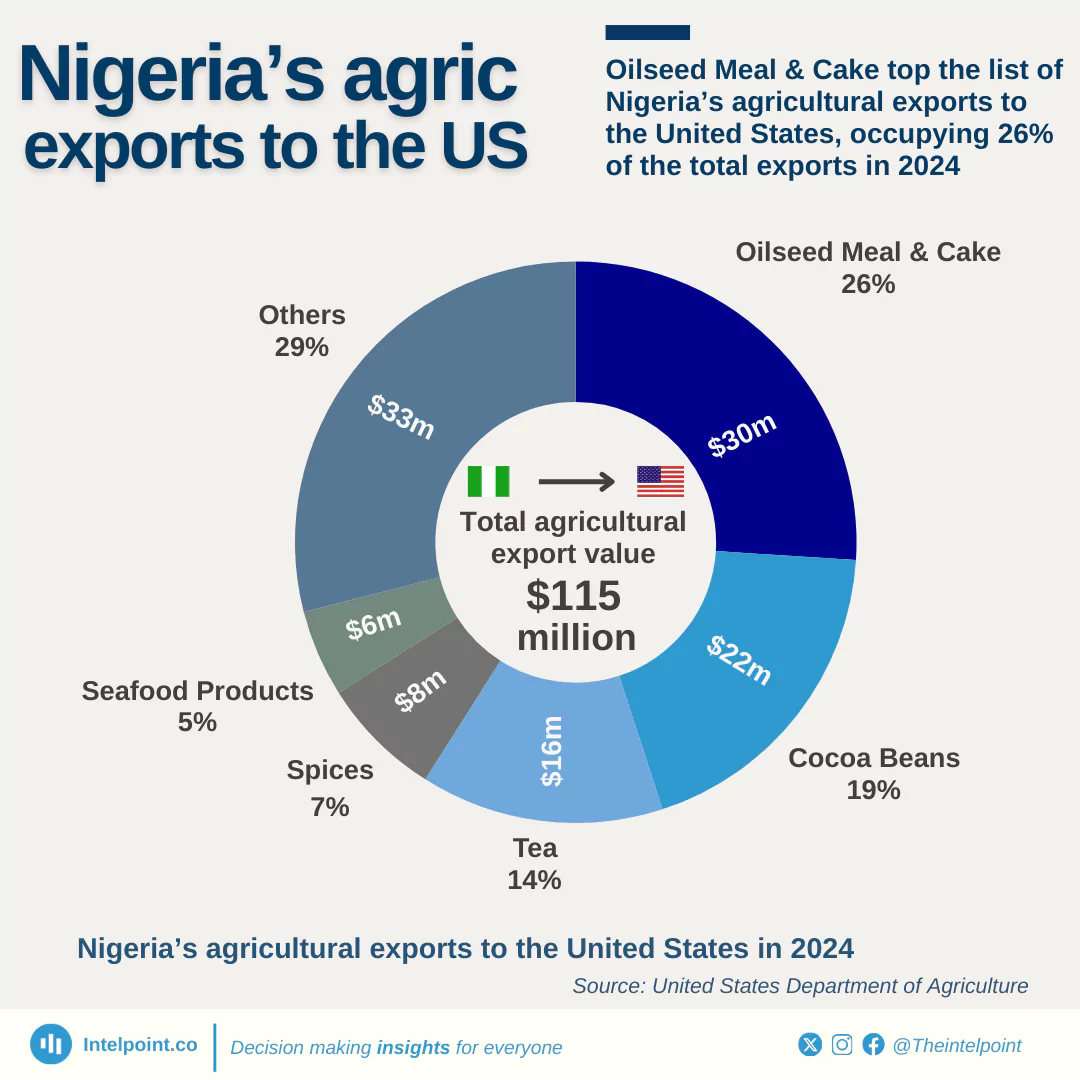
In 2024, agricultural imports to the United States from Nigeria totaled $114.7 million.  Oilseed meal and cake was the largest import, accounting for 26% of the total value, followed by cocoa beans (19%) and tea (14%).

Spices ($7.9 million) and seafood items ($6.3 million) together accounted for 12% of Nigerian agricultural exports to the United States.

Source:

United States Department of Agriculture

Period:

2024
HTML code to embed chart
Want a bespoke report?
Reach out
Tags
Related Insights

Wheat accounted for 46.43% of the United States’ agricultural exports to Nigeria in 2024
Key Takeaways:
  • The United States exported $318.7 million worth of agricultural products to Nigeria in 2024.
  • Wheat accounted for nearly half of the US' agricultural exports to Nigeria, valued at $148 million.
  • The trade balance substantially favours the United States, with exports to Nigeria ($318.7 million) nearly double imports ($114.7 million).
  • The top three products account for 74.49% of all agricultural exports to Nigeria.

The importation of goods made up over 60% of Kenya's bank credit facilities in the first half of 2024
  • Over 60% of Kenya’s bank loans for foreign trade were used to fund imports, limiting resources for exports.
  • In all six months, exports received less than 40% of the credit allocation, highlighting a significant gap.
  • Import credit peaked at 66.23% in June
  • The import-export credit ratio remained relatively stable, suggesting an ongoing structural trend in trade financing.
  • To balance trade, policies could focus on enhancing export production, incentives for exporters, and easing export credit access.

The USA’s $1.1 trillion deficit is four times larger than India’s trade deficit
  • The United States leads with a massive $1.1 trillion in trade deficit, over four times larger than India's $245.5 billion deficit
  • India and the United Kingdom follow, each exceeding $230 billion in trade deficits, reflecting high import reliance
  • The USA’s trade imbalance alone surpasses the combined deficits of the other nine countries on this list
  • Six of the top ten countries with the largest deficits are European economies

Egypt and Morocco lead Africa’s trade deficit with a combined $50.8 billion
  • Egypt and Morocco dominate Africa’s trade deficit, with a combined shortfall of $50.8 billion dollars, which surpasses the total deficit of the other eight countries on the list
  • North African economies — Egypt, Morocco and Tunisia — account for more than half of the total trade deficit across the top 10
  • East African economies also feature prominently, with Ethiopia, Kenya, and Tanzania making up a significant share of the deficit
  • Smaller economies like Rwanda and Uganda post notable deficits, though on a much smaller scale than their North and East African counterparts

The three countries with the largest trade surpluses in Africa are oil producers
  • Angola's $23.8 billion surplus is nearly double Algeria’s
  • The top three countries are major oil exporters
  • Oil, minerals, and natural resources drive most surpluses
  • No North African country besides Algeria makes the top 10

Over ₦825 trillion web payment transactions were made in the first six months of 2024
  • Web payment amassed a total transaction value of ₦825.5 trillion, showcasing its dominance in both frequency and financial significance.
  • With a Constant Annual Growth Rate of 150.4% (in volume) and 208.9% (in value), Web Pay has been leading the Nigerian Payment System in both transaction volume and value since 2020.
  • Mobile payments contribute 15.8% of transaction volume and 10.9% of transaction value, indicating growing adoption among tech-savvy users.
  • NEFT transactions represent 21.5% of the total transaction value, reflecting their importance for transferring large sums.
  • The dominance of web payments reflects Nigeria's ongoing transition to a cashless economy and widespread digital adoption.

POPULAR TOPICS
SIGN UP TO OUR NEWSLETTER
Get periodic updates about the African startup space, access to our reports, among others.
Subscribe Here
Subscription Form

A product of Techpoint Africa. All rights reserved