Nigeria maintained its trade surplus streak in Q1 2025, with ₦5.17 trillion

  • Total trade rose from ₦12.7 trillion (Q2 2023) to over ₦36 trillion (Q1 2025).
  • Exports grew from ₦6.4 trillion (Q2 2023) to ₦20.6 trillion (Q1 2025).
  • Sustained trade surpluses started from Q2 2023, peaking at ₦5.2 trillion in Q1 2025.
  • Imports also rose from ₦6.3 trillion (Q2 2023) to ₦15.4 trillion (Q1 2025), but slower than exports.
  • Pre-2023 was deficit-heavy: Most quarters from 2020–2022 recorded trade deficits or very small surpluses.
  • Q1 2021 had the worst deficit: -₦1.89 trillion, driven by high imports and weak exports.
  • Naira devaluation is the turning point: Starting around Q2 2023, it inflated export values in naira terms.
  • Export growth may not reflect volume; gains are likely due to FX effects, not necessarily more goods shipped.

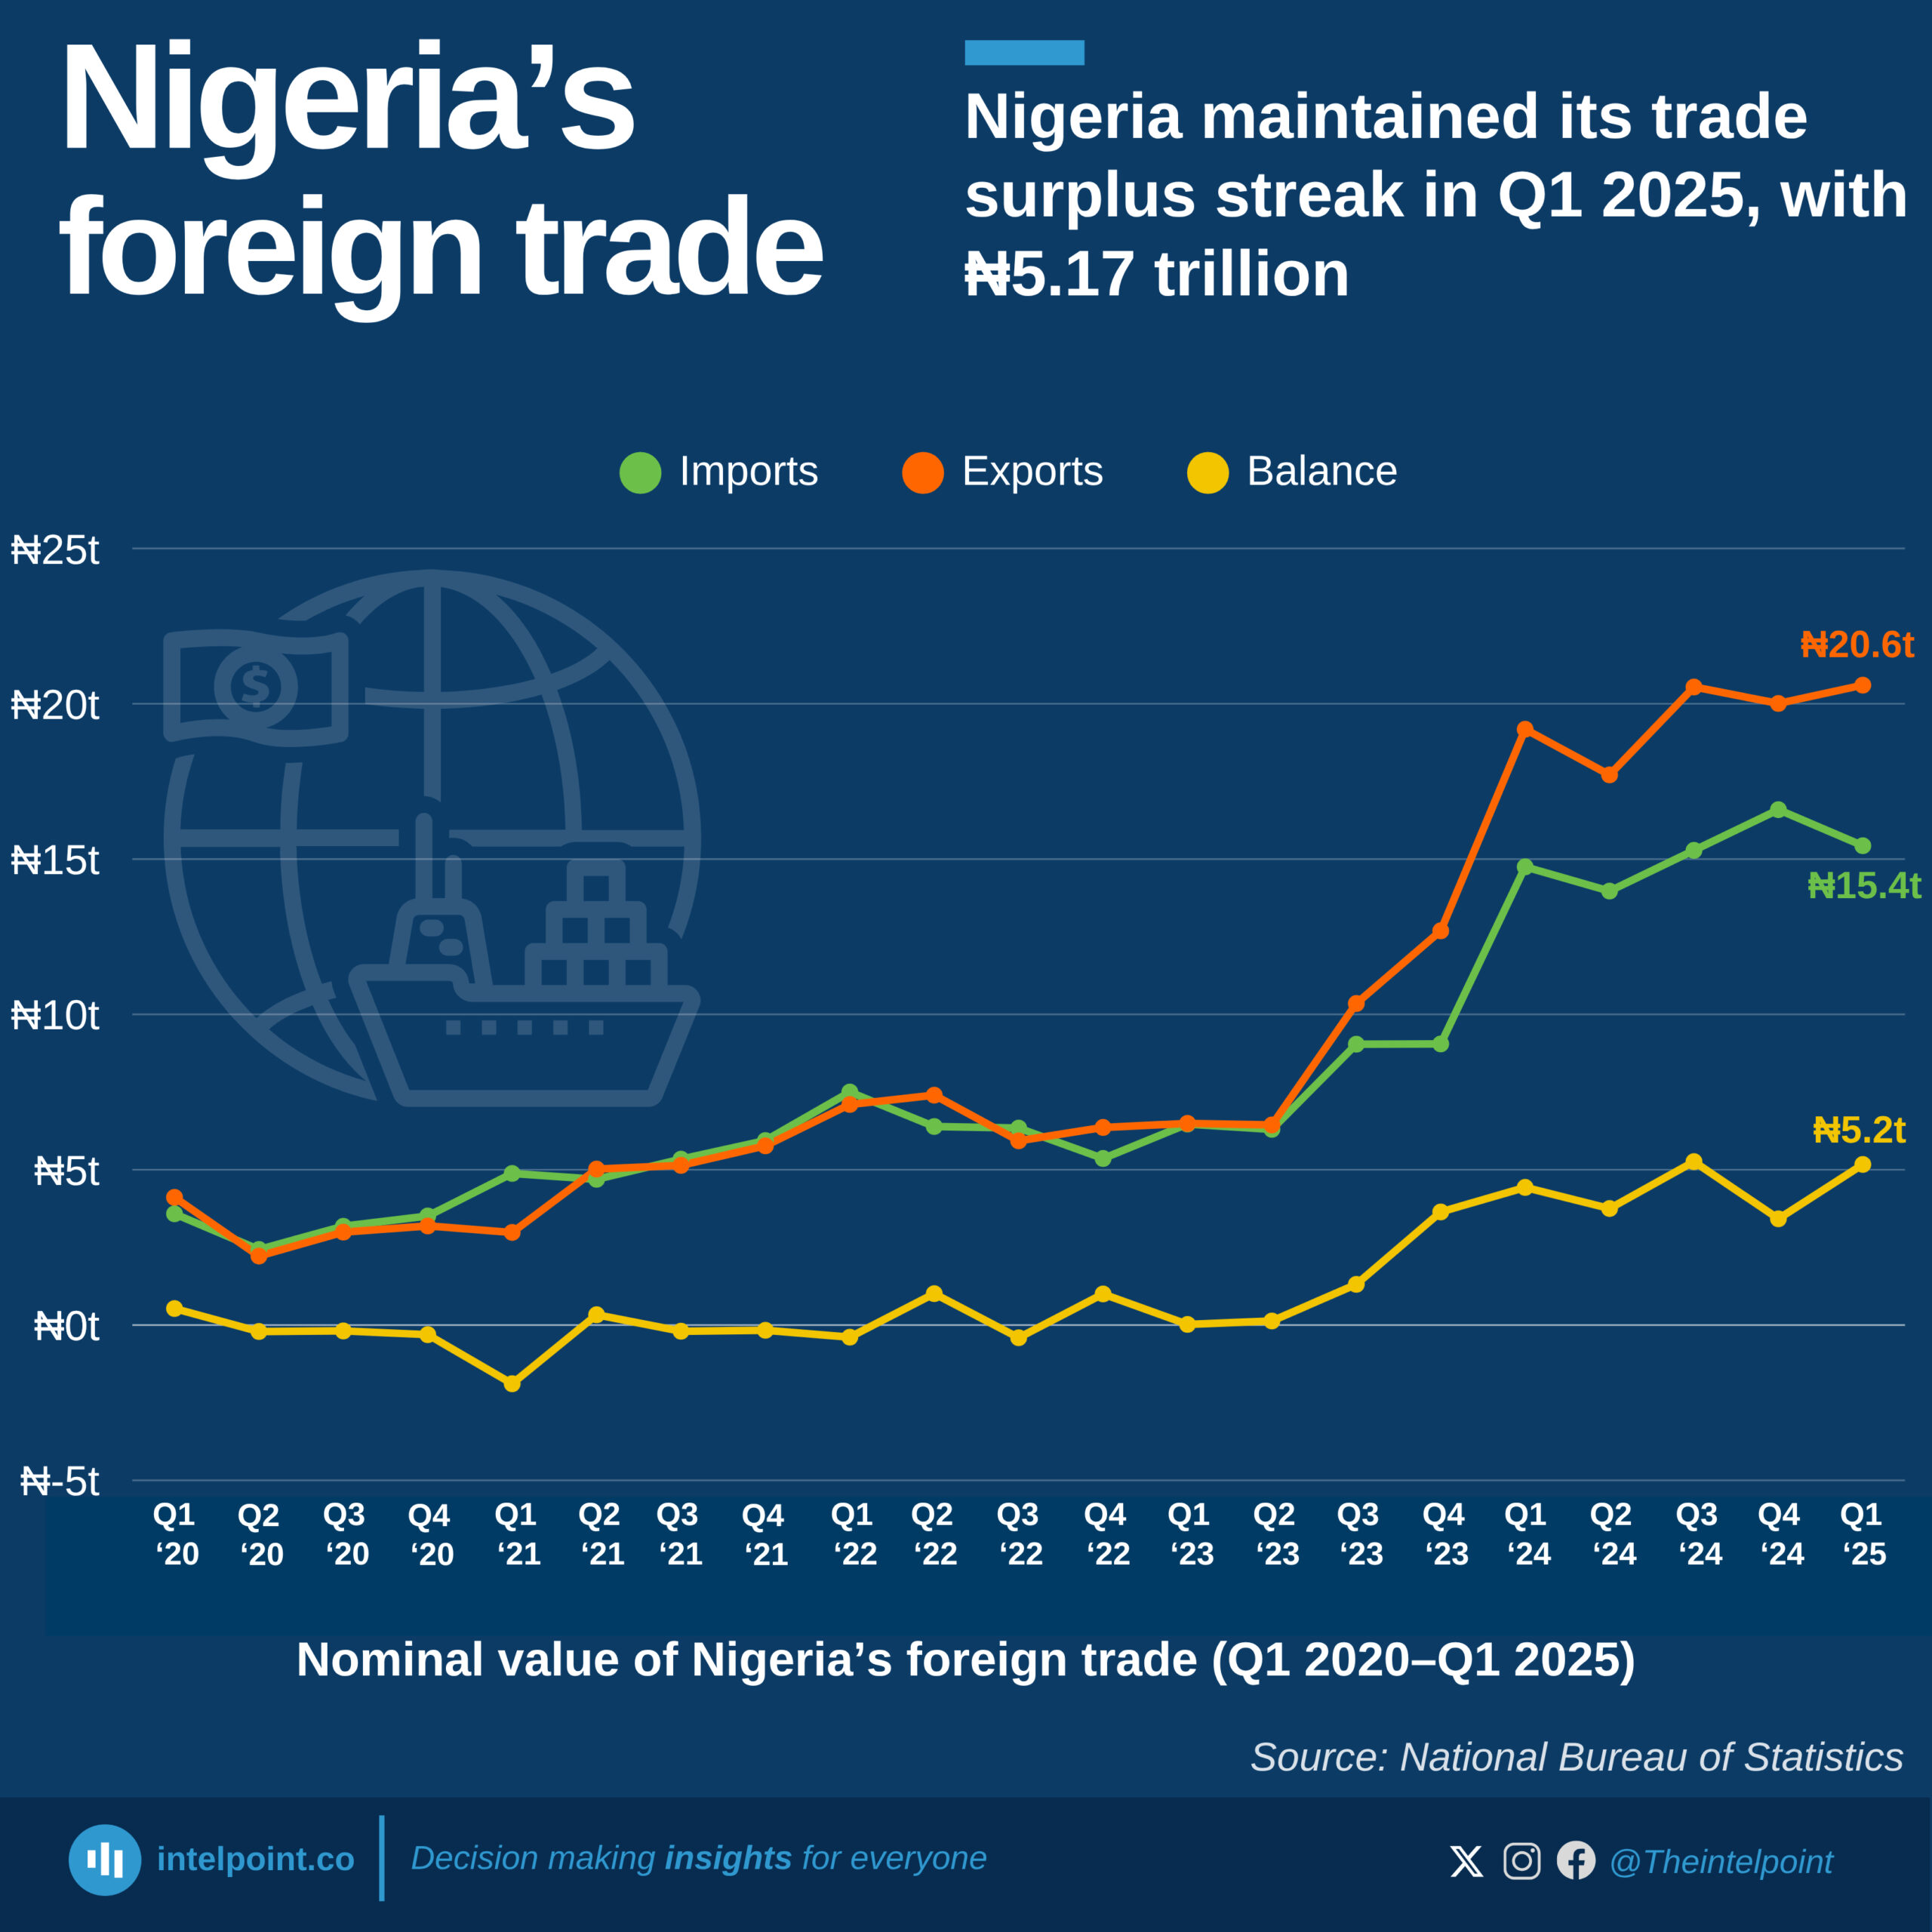
In Q1 2025, Nigeria continued its strong trade momentum with a total nominal trade volume of ₦36 trillion. Exports rose slightly to a new peak of ₦20.6 trillion, while imports declined quarter-on-quarter to ₦15.4 trillion. The result was a solid ₦5.17 trillion surplus, the second-highest on record. This marks the sixth consecutive quarter of surplus since Nigeria flipped to a positive trade balance in mid-2023.

However, with inflation still elevated, the real value of trade may be growing more slowly than these nominal figures suggest.

Source:

Period:

HTML code to embed chart
Want a bespoke report?
Reach out
Tags
Related Insights

Out of 30 African countries ranked, South Africa topped logistics performance in 2023 with a score of 3.7 out of 5
  • South Africa ranked highest in Africa; it’s easy to move goods in and out.
  • It beat others on customs speed, delivery time, and tracking.
  • Nigeria, Ghana, and DR Congo scored low. Goods faced more delays and hassles.
  • Countries with high scores attract more trade and business.
  • A low score means slower shipments, higher costs, and weaker logistics.

Netherlands, US, and Germany dominated cocoa imports from 1961 to 2023
  • Netherlands imported the most cocoa beans — 25.48 million tonnes (1961–2023)
  • US (21.1M) and Germany (16.8M) followed in total volume
  • These three countries dominated the top 5 nearly every year
  • Malaysia, UK, France, and Belgium also ranked high over time
  • USSR stayed in the top 10 despite dissolving in 1991
  • Global cocoa imports grew from 1M tonnes in 1961 to nearly 4M in 2023

Half of the top 12 global Google shopping searches in 2024 were for phone brands
  • iPhone was the most searched shopping query globally in 2024.
  • Half of the top 12 search queries were phone-related, showing phones dominated online shopping interest.
  • iPhone (100) and Samsung (88) were highly searched, signalling active consumer comparison between phone models.
  • Nike (84) and Adidas (46) maintained strong brand appeal in fashion and retail.
  • Amazon (52) ranked high despite being a platform, not a specific product.
  • Apple (30) appeared lower in rank than specific Apple products, suggesting searchers prioritised items over brand pages.
  • Laptops (21) remained a significant product category globally, despite mobile dominance.

China's exports to Nigeria more than doubled between the 2016 drop and the 2022 peak, growing by 130%
Key Takeaways:    
  • China’s exports to Nigeria increased from less than $100 million in 1992 to $20.2 billion in 2023, an overall growth of 22,074%.
  • The highest export value was recorded in 2022 at $22.3 billion.
  • China's exports to Nigeria dropped sharply in 2016 to $9.7 billion from $15.39 billion in 2014.
  • After a sharp 29% decline between 2015 and 2016, exports entered a period of sustained growth beginning in 2017.
  • The 2020–2022 period saw remarkable growth, with exports rising by 33% despite global pandemic challenges.
  • In 2023, exports declined by 9.5%, yet remained significantly above pre-pandemic levels.

China's imports from Nigeria were highest at $3.03 billion in 2021, with mineral fuels, oils, and distillation products accounting for the majority of the import value
Key Takeaways:
  • From 2014 to 2023, China’s imports from Nigeria fluctuated significantly, ranging between $907 million and over $3 billion.
  • A sharp 53% drop was recorded between 2014 and 2015, followed by a further decline to a decade-low in 2016.
  • China reached its highest import value in 2021, when it imported over $3 billion from Nigeria.
  • Imports fell by 47% in 2022 but recovered by 48% in 2023, reaching $2.37 billion.
  • The volatility in trade reflects the influence of global commodity prices, especially oil, and evolving bilateral trade dynamics.
  • Mineral fuels, oils, and distillation products accounted for more than 50% of China's imports from Nigeria during the period of study.

Top 10 goods made up 63% of China’s exports to Nigeria in 2023
Key Takeaways:
  • Electrical and electronic equipment was China’s top export to Nigeria, valued at $2.88 billion.
  • The top five export categories (electrical equipment, machinery, vehicles, plastics, and iron/steel products) together accounted for over $8.78 billion, representing around 44% of total exports.
  • Industrial goods such as machinery and steel, along with manufactured consumer goods, dominate China’s export portfolio.
  • Products like apparel, synthetic materials, and household items featured strongly among the top export categories.
  • In total, China exported goods worth $20.18 billion to Nigeria in 2023.

POPULAR TOPICS
SIGN UP TO OUR NEWSLETTER
Get periodic updates about the African startup space, access to our reports, among others.
Subscribe Here
Subscription Form

A product of Techpoint Africa. All rights reserved