Nigeria has received $430B in remittances since 2000, peaking at $24.3B in 2018

Key takeaways

  • Nigeria received a total of approximately $430 billion in remittances between 2000 and 2023.
  • The highest amount recorded was in 2018, when remittances peaked at $24.31 billion.
  • In 2020, inflows dropped significantly to $17.21 billion due to the global COVID-19 crisis.
  • Between 2021 and 2023, remittances remained stable, averaging around $19.7 billion per year.

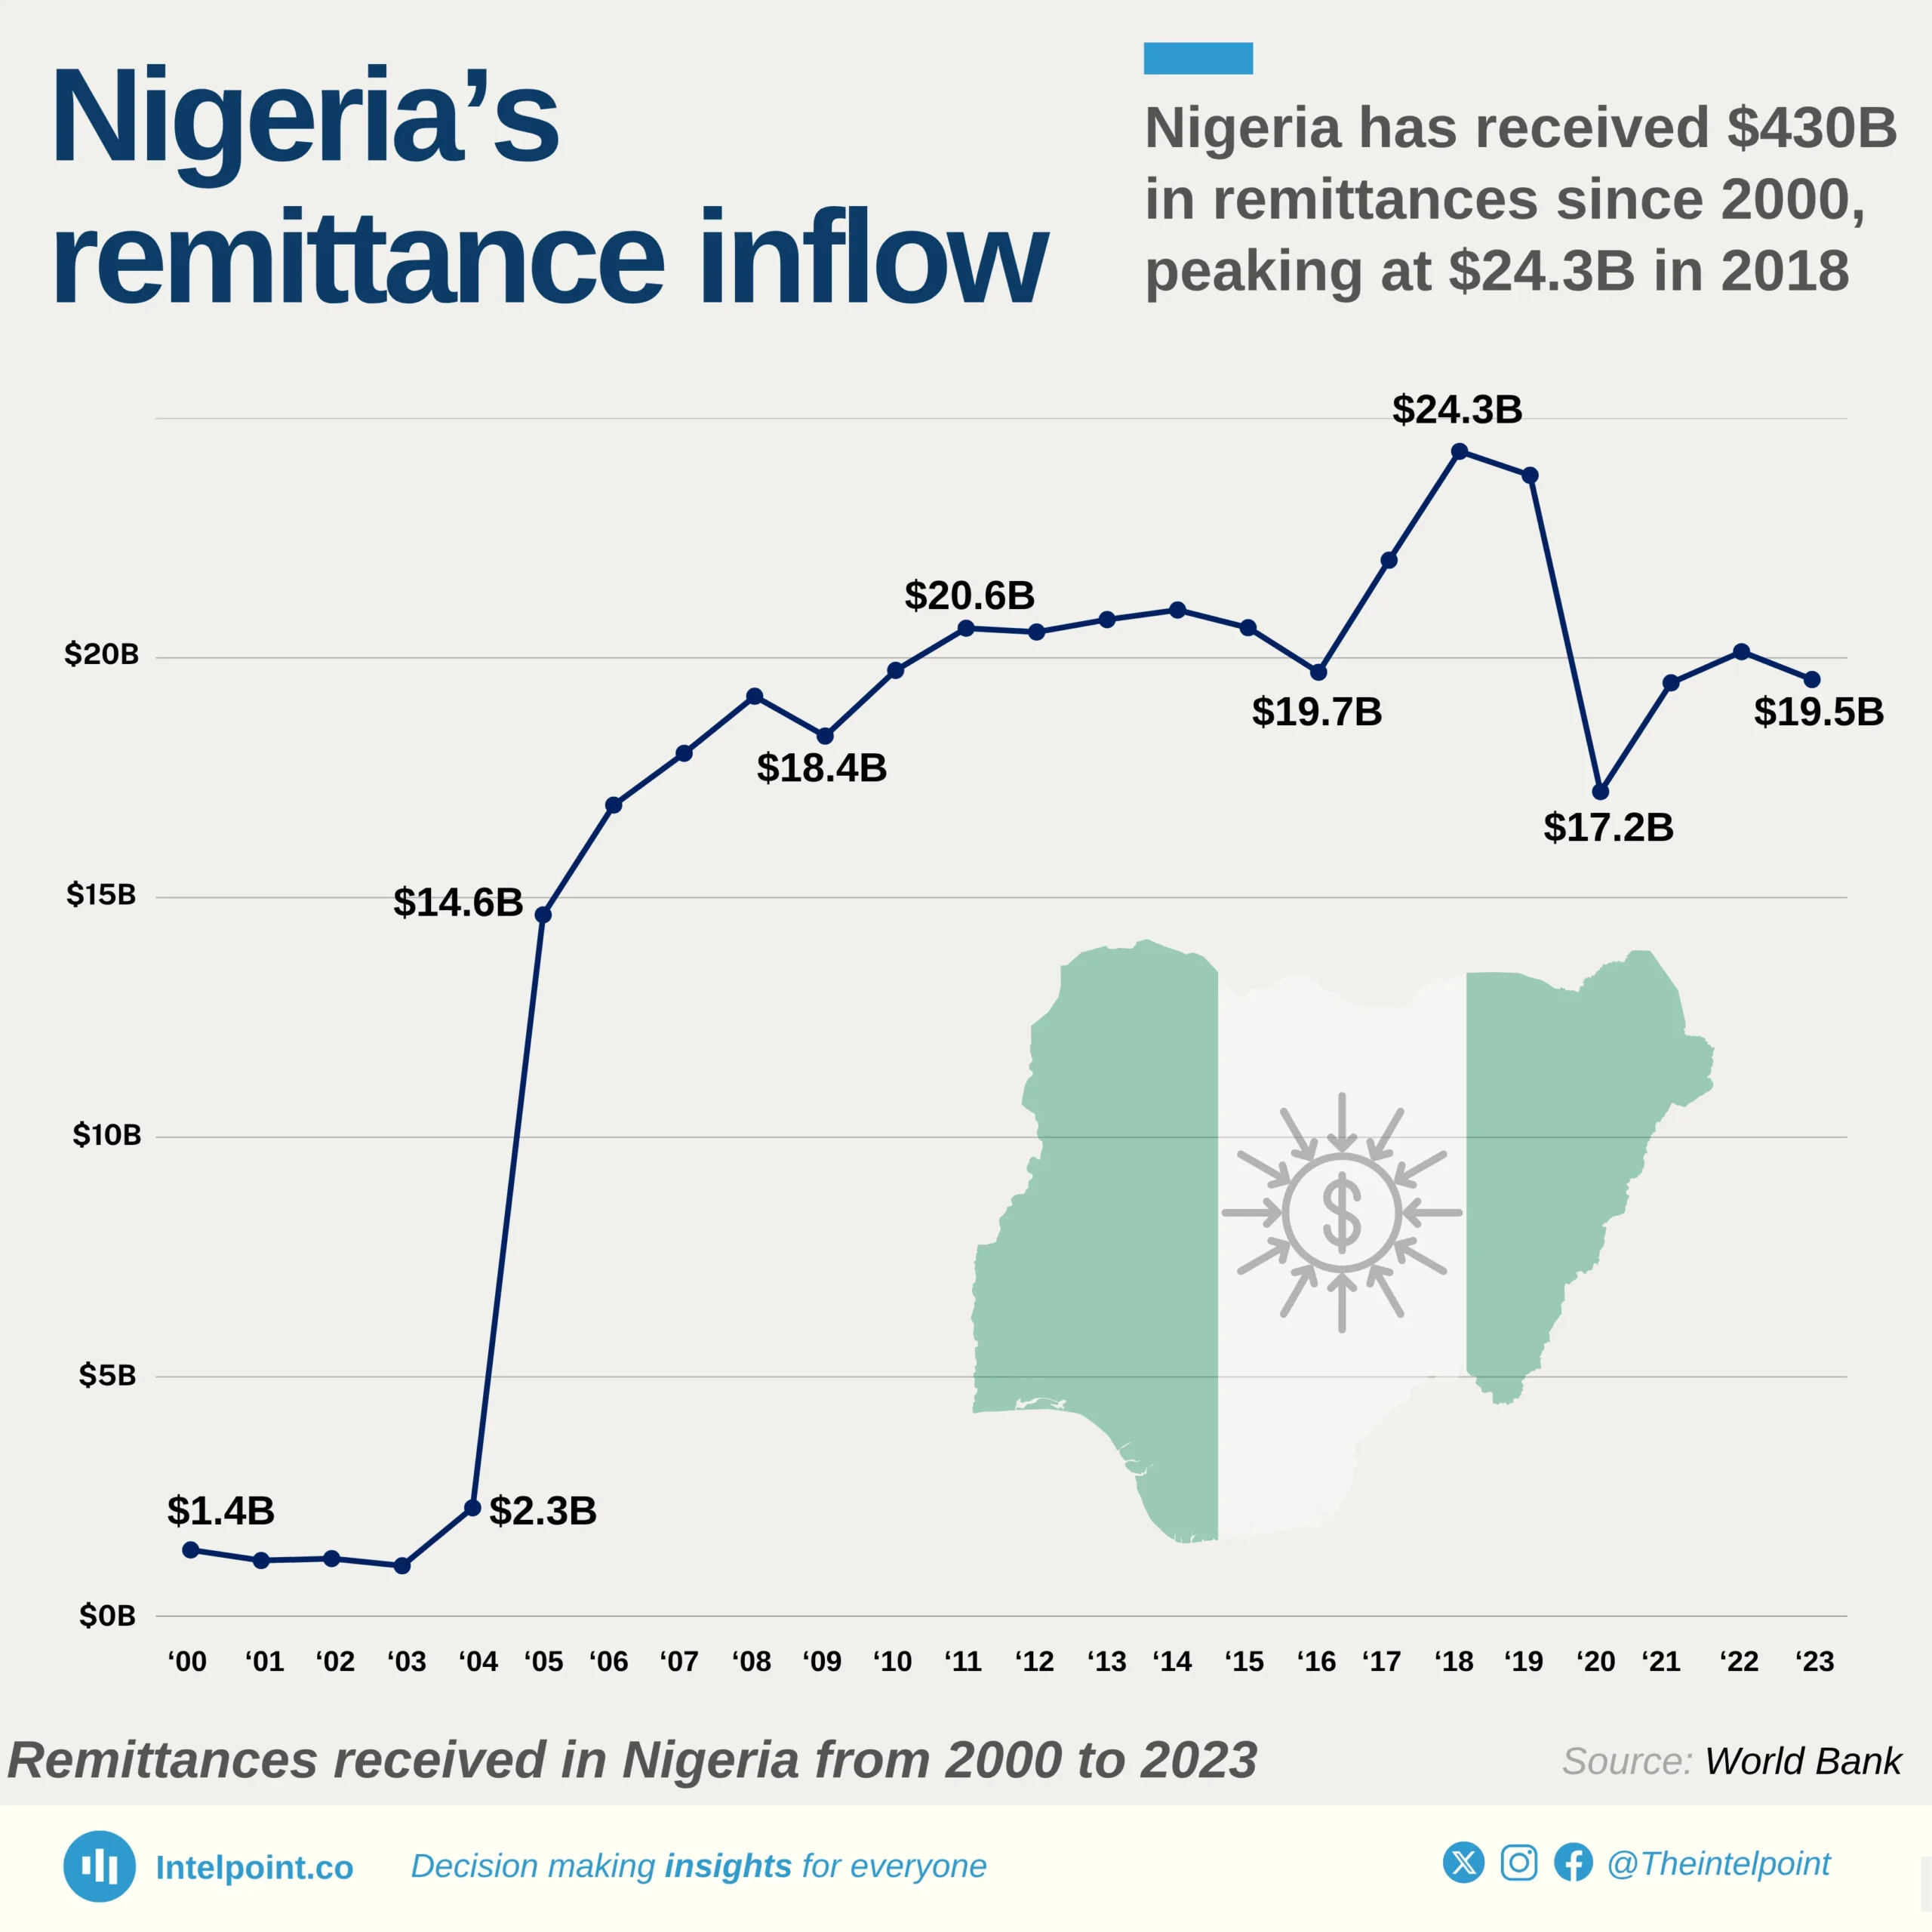
Over the past two decades, remittance inflows have become a critical pillar of Nigeria’s economy, growing from just $1.39 billion in 2000 to over $19 billion annually in recent years. This 23-year journey reflects not only Nigeria’s deep diaspora engagement but also the economic dependence of many households on foreign transfers.

The year 2018 marked a milestone, with remittances hitting an all-time high of $24.31 billion, underscoring the strength of global Nigerian networks. However, this was followed by a significant dip in 2020, when inflows dropped by 27.7% due to the COVID-19 pandemic’s global disruption. Despite this, Nigeria’s remittance figures have bounced back and held steady above $19 billion in the last three years, demonstrating the diaspora's continued economic support in the face of global uncertainties.

Source:

World Bank

Period:

2000 to 2023
HTML code to embed chart
Want a bespoke report?
Reach out
Tags
Related Insights

Number of road accidents by geopolitical zone in Nigeria (Cumulative, Q3 2020-Q3 2024)
  • The North Central zone accounts for the highest share of road accidents in Nigeria, contributing 34.55% of the national total.
  • Within the North Central zone, Abuja (FCT) recorded the most accidents, with a cumulative total of 8,133 cases.
  • The South West zone ranks second, responsible for 25.78% of all accidents nationwide, with Ogun State leading the zone at 6,418 accidents.
  • The South East zone has the lowest share, contributing just 5.38% of total accidents from Q2 2020 to Q2 2024.
  • Enugu State, the highest contributor within the South East, accounts for only 1.59% of the national total.

Nigeria’s foreign trade
  • Total Trade Volume in Q1 2025 stood at ₦36.02 trillion, with exports totalling ₦20.6 trillion and imports at ₦15.4 trillion, resulting in a surplus of ₦5.17 trillion.
  • Crude oil dominates Nigeria’s export trade, accounting for the largest share of export revenue. -
  • Other petroleum oil products are also a major export item, reflecting the significance of both raw and refined oil-based commodities in Nigeria’s trade portfolio. -
  • On the import side, manufactured goods dominate, showing Nigeria’s continued reliance on foreign machinery, technology, and consumer goods.
  • While Nigeria exports mostly raw and oil-based products, it imports refined, processed, or industrial goods, indicating a structural trade gap and limited local industrial capacity. -
  • Agricultural and raw material goods feature on both sides of trade, but their value is significantly less than petroleum-related trade.

Nigeria's foreign trade
  • India is Nigeria’s largest export destination Nigeria exported ₦2.84 trillion worth of goods to India in Q1 2025, driven largely by crude oil.
  • China dominates imports into Nigeria China supplied ₦4.66 trillion worth of goods, far outpacing all other countries. Likely dominated by electronics, machinery, and manufactured goods.
  • The United States appears on both sides. Nigeria exports ₦1.54 trillion to the US and imports ₦1.42 trillion, showing a relatively balanced trade relationship.
  • European countries are major export Partners Netherlands (₦2.30T), France (₦1.44T), and Spain (₦1.44T) are prominent export destinations, indicating strong demand for Nigerian crude oil and other commodities in Europe.
  • UAE barely makes the import list. The UAE closes out the top import list at ₦0.61 trillion, showing relatively lower trade volume compared to others, but still significant enough to be in the top 5.

Cars lead in road traffic crashes, while luxury bus accidents surge by 466.7% over four years
  • Cars were involved in the highest number of road accidents, recording 665 cases over the four-year period.
  • Luxury buses and bicycles recorded the highest quarter-on-quarter (QoQ) growth in accident involvement.
  • Tankers, cars, and motorcycles saw the sharpest QoQ declines, with accident rates falling by 47.2%, 30.6%, and 24.7% respectively.

42% of Nigeria’s applications have been rejected over the past 15 years amidst surging demand for Schengen visas
  • Nigerians submitted 1.1 million Schengen visa applications between 2009 and 2024.
  • The highest rejection rates occurred in 2017 (53%) and 2019 (51%).
  • A total of 491,844 applications were rejected, a cumulative denial rate of 42.1%.
  • Despite post-pandemic recovery, 2024 recorded the highest applications (111k), with a 45% rejection rate.
  • The year 2010 stands out as the period with the least number of Schengen visa applications submitted by the Nigerian consulate.

Nearly 30% of road accidents recorded in Nigeria between Q3 2020 and Q3 2024 occurred in FCT, Ogun, and Nasarawa
  • FCT, Ogun, and Nasarawa consistently rank as the top three states with the highest number of road accidents.

  • The FCT recorded its peak accident figures in 2022, particularly in Q2 (842 cases) and Q4 (864 cases).

  • In Q2 and Q3 of 2024, Ogun State surpassed the FCT in the number of reported accidents.

  • Across these three states, there has been a notable decline in accident numbers, with an average decrease of approximately 37.6% between Q2 and Q3 2024.


POPULAR TOPICS
SIGN UP TO OUR NEWSLETTER
Get periodic updates about the African startup space, access to our reports, among others.
Subscribe Here
Subscription Form

A product of Techpoint Africa. All rights reserved