Lagos State's year-end outstanding foreign debt peaked in 2017, before gradually easing to $1.17 billion as of 2024

  • From just $190 million in 2006, Lagos State's year-end external debt rose significantly to over $1.1 billion by 2024, a more than 500% increase over 19 years.
  • The highest year-end debt was recorded in 2017 at $1.47 billion, with a gradual decline afterwards, except for a brief rise again in 2022–2023.
  • By 2024, Lagos State's external debt dipped slightly to $1.17 billion, suggesting some debt service or currency gain effects.
  • If Lagos State paid off or borrowed funds in a given year, only the remaining unpaid amount by year-end is shown in the data.

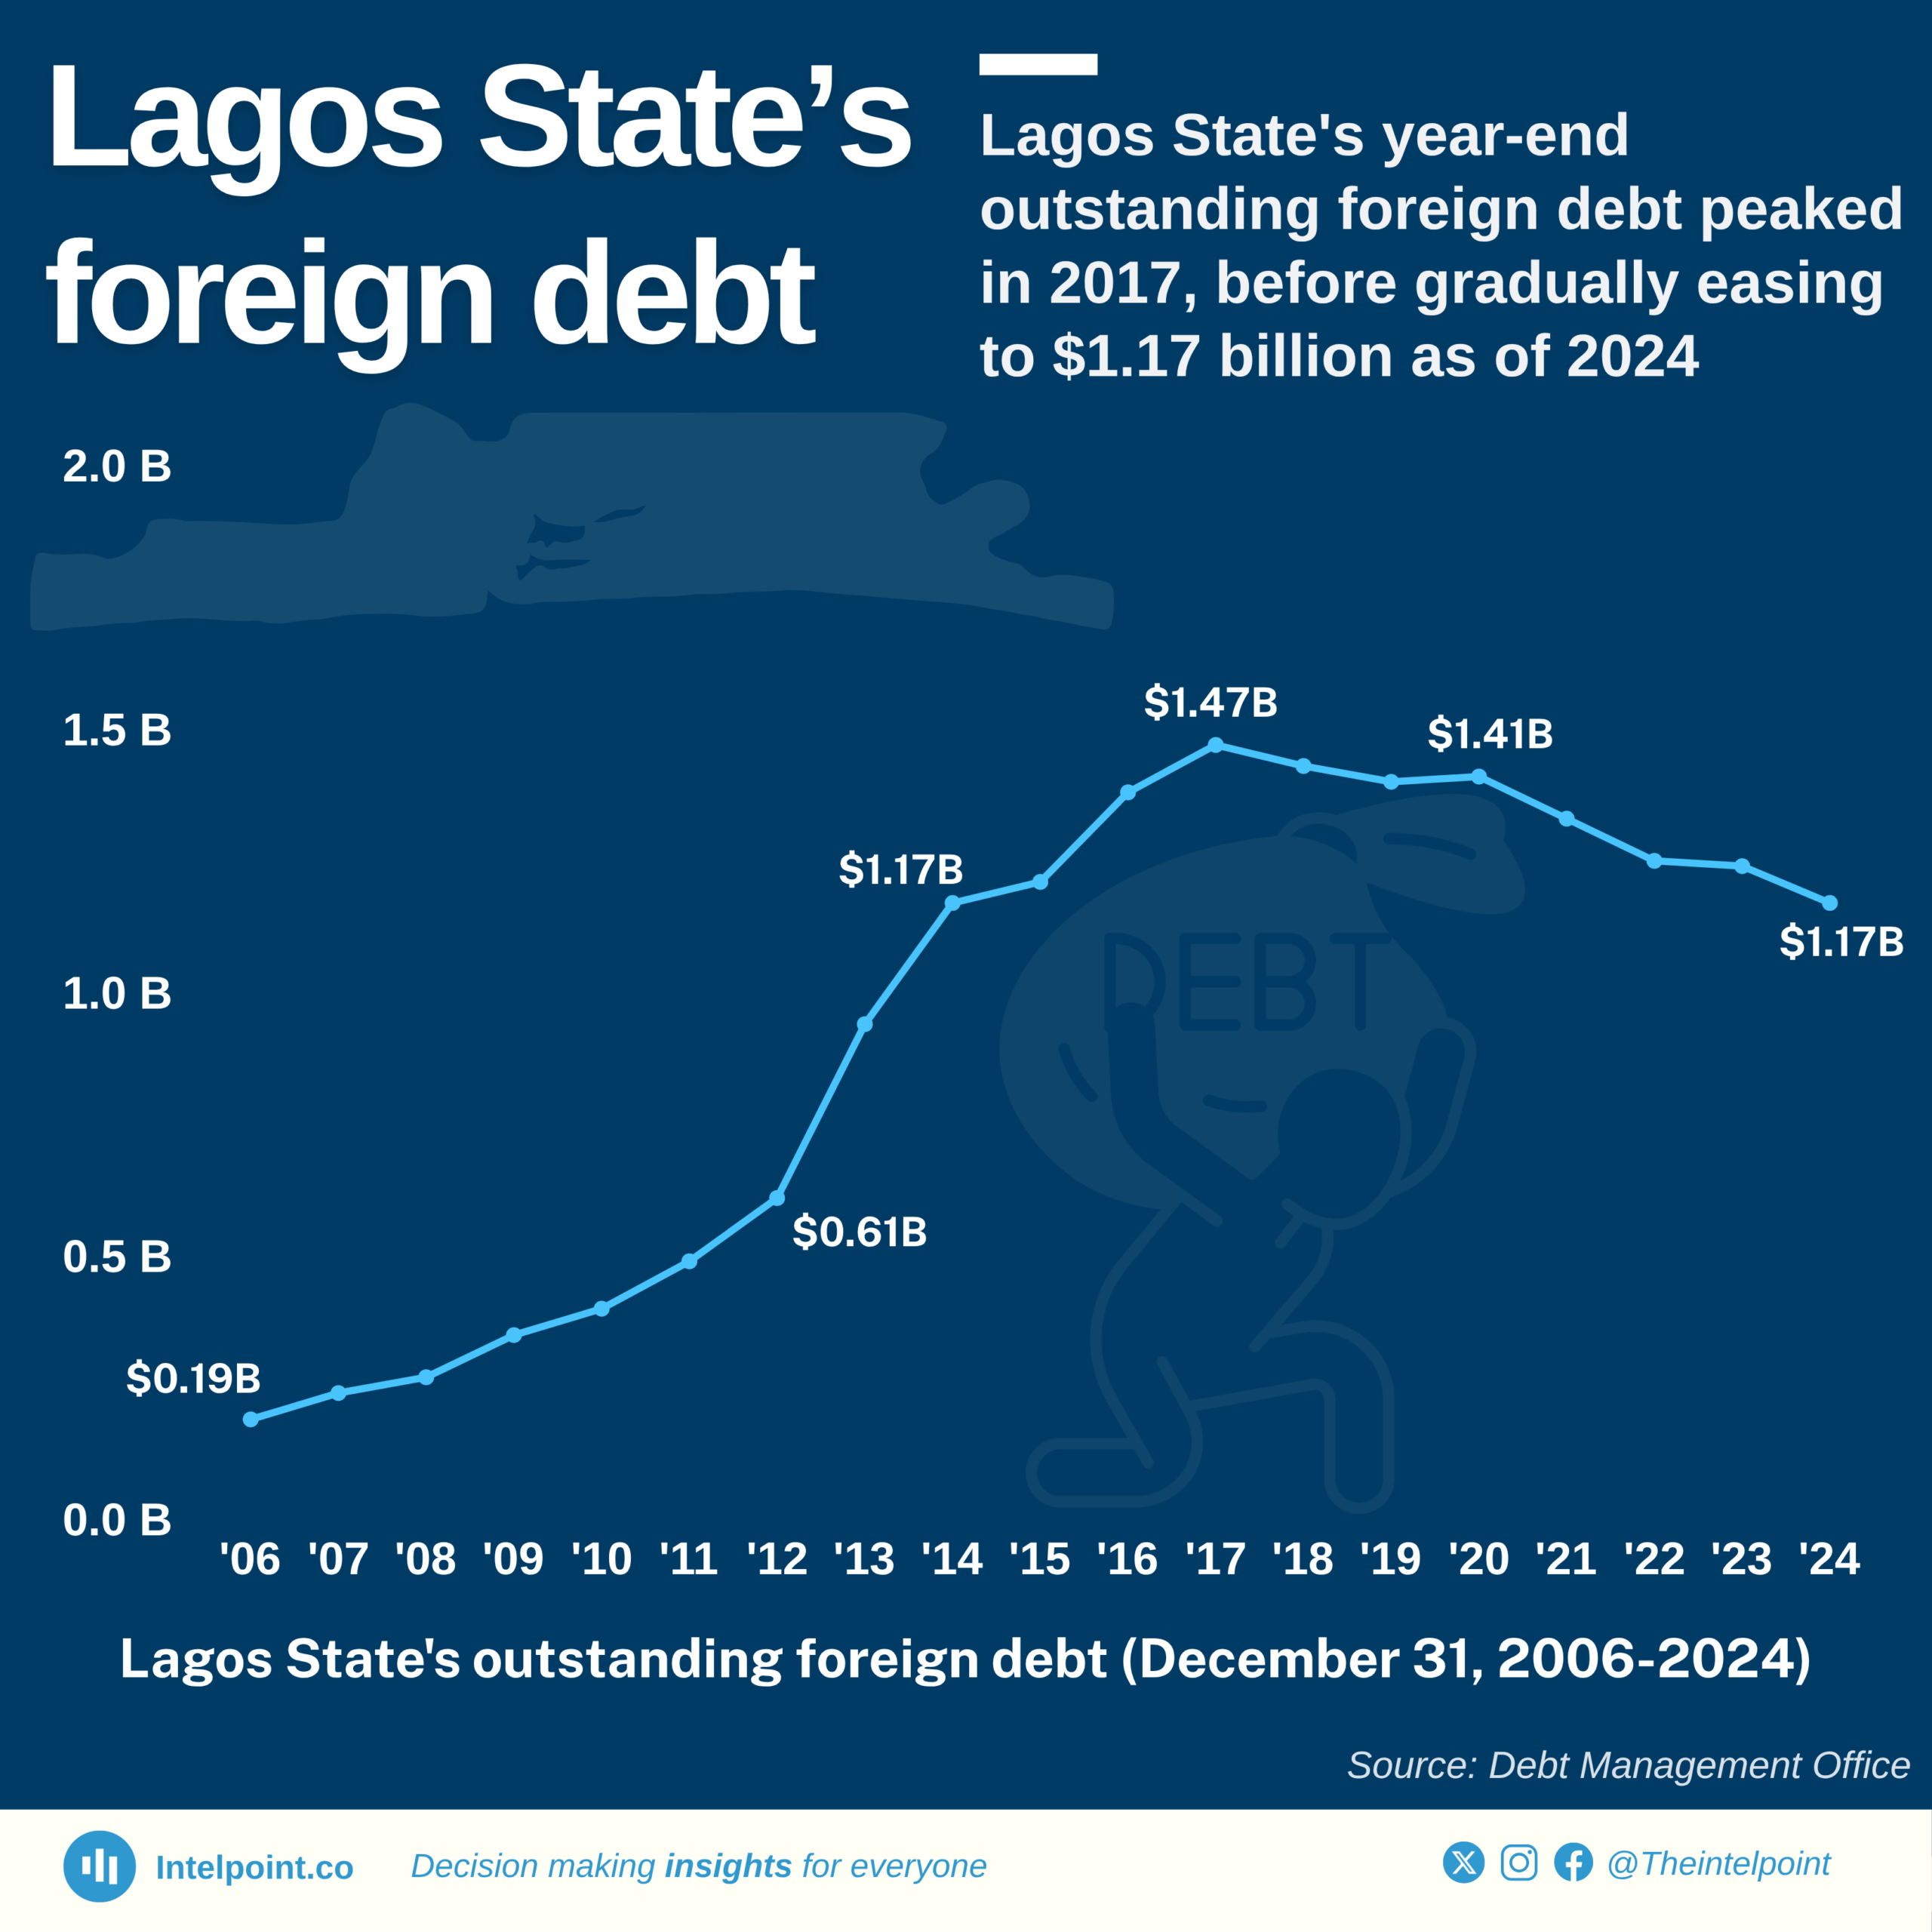
This chart tracks Lagos State’s external debt from 2006 to 2024, showing the outstanding balances as of December 31 each year.

This approach reveals what Lagos State still owed to external creditors (such as World Bank, China Exim Bank, or foreign bondholders) at the end of every year.

Over the 19 years, Lagos’ foreign debt grew over fivefold, rising from $190 million in 2006 to $1.17 billion in 2024. The peak came in 2017 with $1.47 billion in outstanding obligations, likely reflecting aggressive borrowing under ambitious capital development drives.

While some years show slight reductions (2018–2024), the general trend confirms Lagos State's deepening reliance on external financing to support infrastructure and service delivery in the face of population growth and urban pressure.

Understanding that these figures are point-in-time balances and not cumulative totals is crucial. They reflect the net amount still owed after all new loans and repayments throughout the year.

The 2024 figure ($1.17B) indicates some fiscal restraint or debt repayment efforts, but the state still remains heavily exposed to external liabilities and vulnerable to currency depreciation since external debts are dollar-denominated.

Source:

National Bureau of Statistics

Period:

2006-2024
HTML code to embed chart
Want a bespoke report?
Reach out
Tags
Related Insights

South Sudan tops Africa's food inflation list with 106%; two other East African nations in top 5
  • South Sudan and Zimbabwe have crossed 100% food inflation.
  • Three of the top five countries with the highest food inflation in Africa are in East Africa, showing a regional pattern of vulnerability.
  • Nigeria ranks 7th in Africa for food inflation at 21.3%, underlining persistent cost-of-living pressures despite being a major economy.
  • Liberia and Zambia round out the top 10 with double-digit food inflation.
  • Djibouti, Somalia, and Senegal are experiencing food price deflation, setting them apart from most African countries.

Apapa Port accounted for 71.6% of Nigeria’s total trade value in Q1 2025 and 86.12% of total exports
  • Apapa Port accounted for 71.6% of Nigeria’s total trade value in Q1 2025 and 82.12% of total exports
  • Apapa Port handled ₦25.79 trillion worth of goods in Q1 2025, representing 71.6% of total trade. It remains the country’s primary trade hub, far surpassing all other ports combined.
  •  Apapa alone facilitated ₦17.74 trillion or 86.1% of Nigeria’s total exports, showing a high dependency on a single location for outbound goods.
  • Tin Can Island is the only meaningful secondary hub With ₦3.44 trillion (9.5%) in total trade, ranking a distant second. It’s the only other port contributing more than ₦1 trillion each to imports and exports.
  • Lekki has limited export impact, despite handling ₦1.70 trillion in imports. Lekki contributed only ₦0.30 trillion (1.5%) in exports, indicating underutilization for outbound trade.
  • Murtala Muhammed International Airport processed just ₦647.91 billion (1.8%) of total trade, reinforcing that Nigeria’s international trade remains heavily maritime-focused.

Life insurance leads Nigeria’s insurance market with ₦276.8 billion in premiums
  • Life insurance dominates the market with ₦276.8 billion in gross premiums, more than any other sector.
  • Oil and Gas insurance follows as the second-largest segment, generating ₦188.7 billion in Q1.
  • Fire and Motor insurance sectors contributed ₦91.9 billion and ₦77.7 billion respectively, reflecting strong demand.
  • Aviation insurance recorded the least income at ₦16.6 billion, likely due to the limited scope of operations.
  • The top three segments (Life, Oil & Gas, and Fire) jointly account for over 75% of the total GPI in the quarter.

BUA Cement and Lafarge recorded over 100% profit growth in the first half of 2025
  • Dangote Cement reported the highest H1 2025 profit at ₦436.6 billion, up 50% from ₦291.7 billion in H1 2024.
  • BUA Cement’s profit more than doubled to ₦149.1 billion, a 164% rise from ₦56.5 billion in the same period last year.
  • BUA Cement had the fastest profit growth rate among the three major players, despite starting from a lower base.
  • Combined, the three firms posted over ₦720 billion in half-year profit, with Dangote alone accounting for over 60% of the total.
  • The sharp profit rises may reflect improved pricing, cost management, or benefits from forex gains after naira devaluation.

Nigeria’s nominal GDP has grown by over 80%, but real GDP has grown by only 6%
  • Real GDP grew from ₦205.1 trillion in 2019 to ₦217.8 trillion in 2024, a modest 6% rise.
  • Nominal GDP jumped from ₦205.1 trillion to ₦372.8 trillion over the same period, an 82% increase.
  • The gap between nominal and real GDP widened sharply after 2021, reaching ₦155 trillion in 2024.
  • Nominal GDP has grown year-on-year, with the steepest jump between 2023 (₦314.0 trillion) and 2024 (₦372.8 trillion).
  • Inflationary pressures have driven nominal gains, masking subdued real economic expansion.

Gold (jewellery, bar & coin) demand in Egypt (2010–2024)
  • Jewellery demand made up 81.35% of Egypt’s total gold demand between 2010 and 2024.
  • The highest jewellery demand was recorded in 2010 at 53 tonnes, and no year since has reached that level.
  • Jewellery demand declined by 50.75% between 2010 and 2024.
  • Bar and coin demand saw a sharp 700% increase between 2021 and 2022.
  • In 2023, bar and coin demand hit a record high of 30.3 tonnes and, for the first time, exceeded jewellery demand.
  • Overall, bar and coin demand rose by 943.48% between 2010 and 2024.

POPULAR TOPICS
SIGN UP TO OUR NEWSLETTER
Get periodic updates about the African startup space, access to our reports, among others.
Subscribe Here
Subscription Form

A product of Techpoint Africa. All rights reserved