In 2024, Asia and Europe together accounted for 63% of the world's copper export value

  • Asia leads global copper exports with 31.6% of total export value.
  • Europe follows closely at 31.4%, making the two regions nearly equal in contribution.
  • Combined, Asia and Europe control 63% of the global copper export market.
  • Africa ranks third globally, contributing 15.3% to copper exports.
  • Oceania plays the smallest role, with just 2% of the total export value.

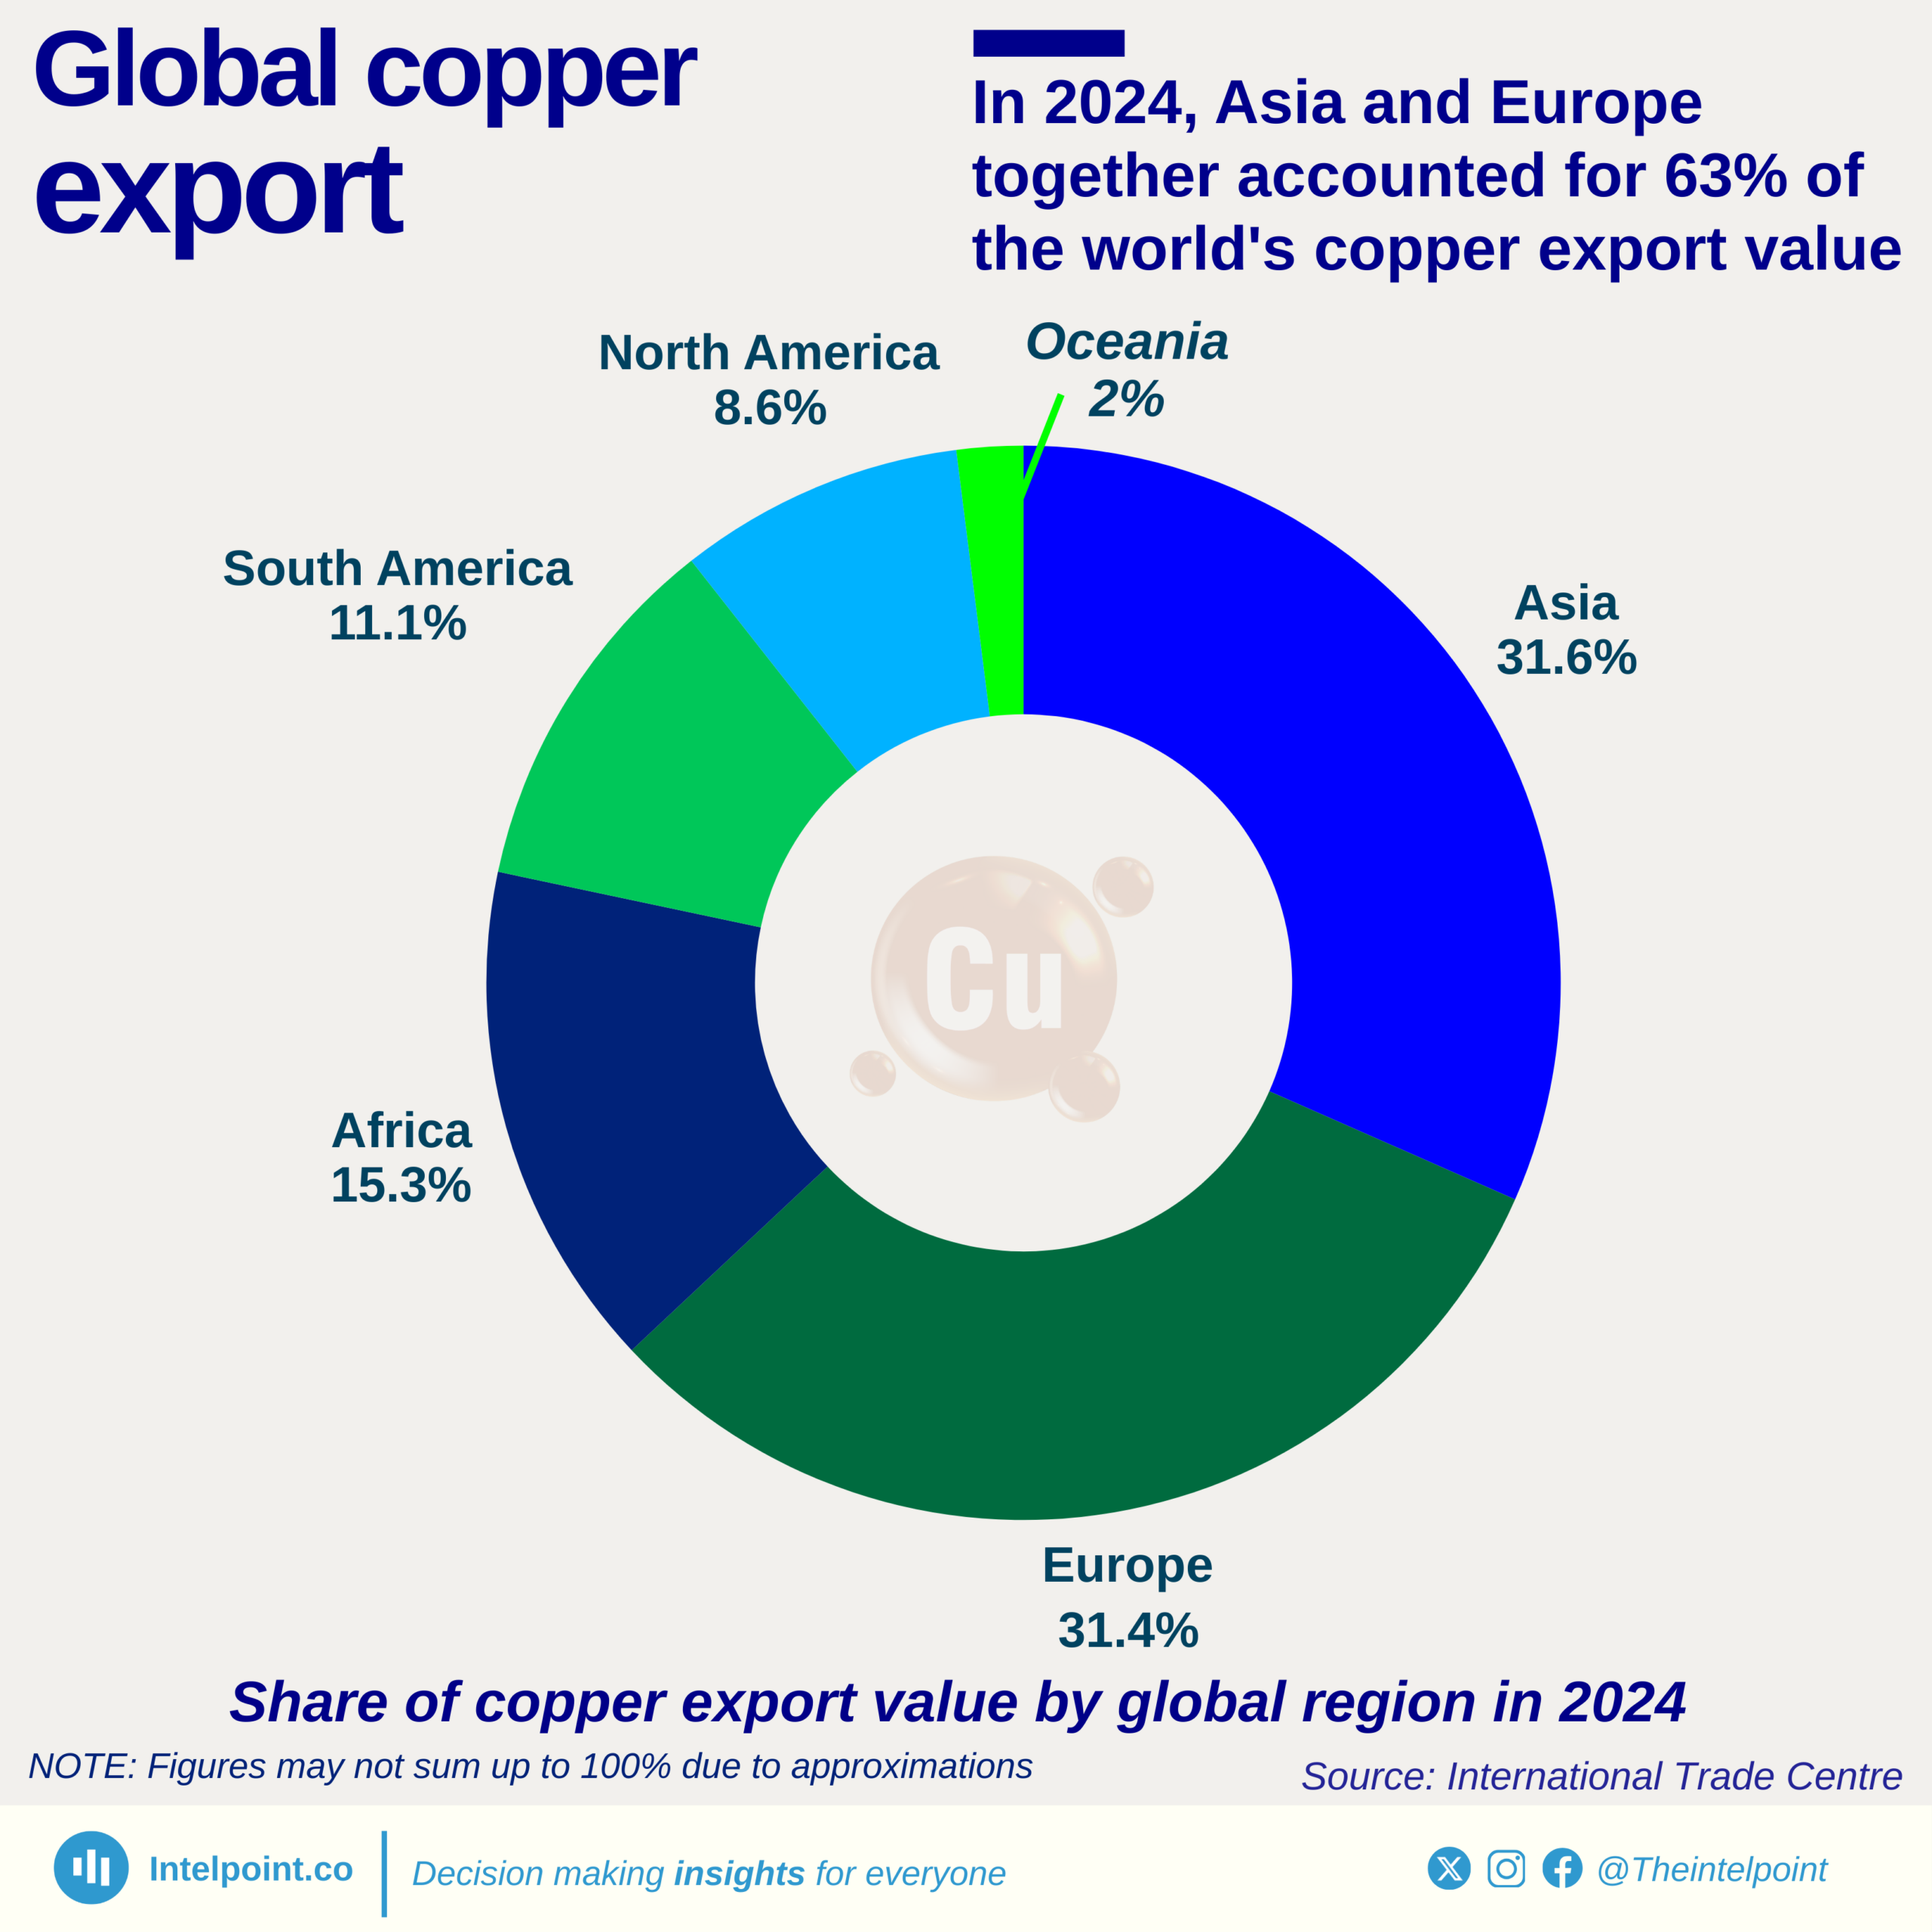
In 2024, the global copper export market was dominated by Asia and Europe, which together accounted for nearly two-thirds (63%) of the world’s copper export value. Asia led with 31.6%, closely followed by Europe at 31.4%, showing how these two regions anchor the global trade. Africa emerged as the third-largest contributor with 15.3%, highlighting its growing role in a market long shaped by industrial powerhouses.

South America (11.1%) and North America (8.6%) also maintained significant positions in the copper export market, with Oceania contributing a relatively small share of 2%. While their portions may be smaller compared to Asia and Europe, they still play critical roles in diversifying global supply.

Source:

International Trade Centre

Period:

2024
HTML code to embed chart
Want a bespoke report?
Reach out
Tags
Related Insights

Nigeria's energy goods imports have stayed low and stable for 7 years, while exports increased from ₦37B to ₦263B
  • Nigeria’s energy goods exports rose from ₦37.3B in 2017 to ₦262.9B in 2024, before falling to ₦154.2B in H1 2025.
  • Imports remained consistently low, ranging from ₦24.2M to ₦353.1M throughout the period.
  • Export growth outpaced imports, showing a widening trade surplus in energy goods.
  • The 2024 spike in exports represents the highest export value within the nine-year window.
  • Energy imports stayed below ₦400M yearly, indicating low dependency on foreign energy goods.

For most of the period (2013-H1 2025), China's share of Nigeria's imports from Asia hovers around 50%-55%, showing dominance
  • China has dominated Nigeria’s imports from Asia, maintaining a 50–55% share for most of the period.
  • China’s share reached its highest level at 58.6% in H1 2025.
  • India's import share remained volatile, ranging between 11% and 25%.
  • Total imports from Asia surged from ₦2.6 trillion in 2013 to ₦16.4 trillion in H1 2025.

Nigeria's agricultural imports' share has been dropping, from 83.9% (2017) to a low of 42.9% (H1 2025)
  • Agricultural imports fell from 83.9% in 2017 to 42.9% in H1 2025, indicating a significant decline in import dependency.
  • Agricultural exports grew from 16.1% in 2017 to 54.0% in 2024, surpassing imports for the first time since 2017.
  • Total agricultural trade increased from ₦1.1 trillion in 2017 to ₦8.2 trillion in 2024.
  • Between 2022 and 2024, the import share dropped significantly from 75.7% to 46.0%.

Crude oil imports in Nigeria emerged in H1 2025 (the first since 2017), capturing a 10.2% share of the total crude oil trade
  • Crude oil imports into Nigeria in H1 2025 marked the first occurrence since 2017.
  • Crude oil imports accounted for 10.2% of total crude oil trade.
  • From 2017 to 2024, exports made up 100% of crude oil trade annually.
  • Total crude oil trade peaked at ₦55.3 trillion in 2024.
  • The emergence of crude oil imports can be linked to domestic refinery operations, especially the Dangote Refinery.

Asia and Europe (combined) have consistently represented over 70% of Nigeria's total imports since 2013
  • Asia and Europe have consistently represented over 70% of Nigeria’s imports since 2013.
  • Asia’s share of imports reached a record 53.5% in H1 2025.
  • Europe contributed 23.1% of total imports in H1 2025.
  • Imports from the American region averaged between 10%–14% over the period.
  • Africa’s import share remained below 10%, showing limited regional trade.

The Netherlands held the largest share of Nigeria's imports from Europe for most of the period, averaging 20% of annual imports
  • The Netherlands has mostly been the top European import source, with Nigeria averaging 20% of annual imports from the region.
  • Netherlands' highest share of Nigeria's imports was 27.9% in 2018.
  • The United Kingdom consistently contributed around 5–15% of Nigeria’s European imports.
  • Germany’s share remained relatively stable at 5–10% over the years.
  • France, Italy, and Spain maintained smaller shares, mostly under 7%.

POPULAR TOPICS
SIGN UP TO OUR NEWSLETTER
Get periodic updates about the African startup space, access to our reports, among others.
Subscribe Here
Subscription Form

A product of Techpoint Africa. All rights reserved