Global wine production remained relatively stable over the decades, averaging 28.67 million tonnes, with a peak of 37.5 million tonnes in 1979

Key takeaways:

  • Over the past six decades, global wine production has remained relatively stable, averaging around 28 million tonnes annually.
  • Wine production increased from 21.5 million tonnes in 1961 to 27.4 million tonnes in 2022.
  • The highest production was recorded in 1979, reaching 37.5 million tonnes.
  • The second-highest year was 1982, with a production of 37.4 million tonnes.
  • Wine production exceeded 30 million tonnes in ten different years between 1961 and 2022.
  • Between 2000 and 2022, production was consistently stable, averaging about 27 million tonnes.
  • The 2022 production of 27.4 million tonnes represented a 27.3% increase compared to 1961.

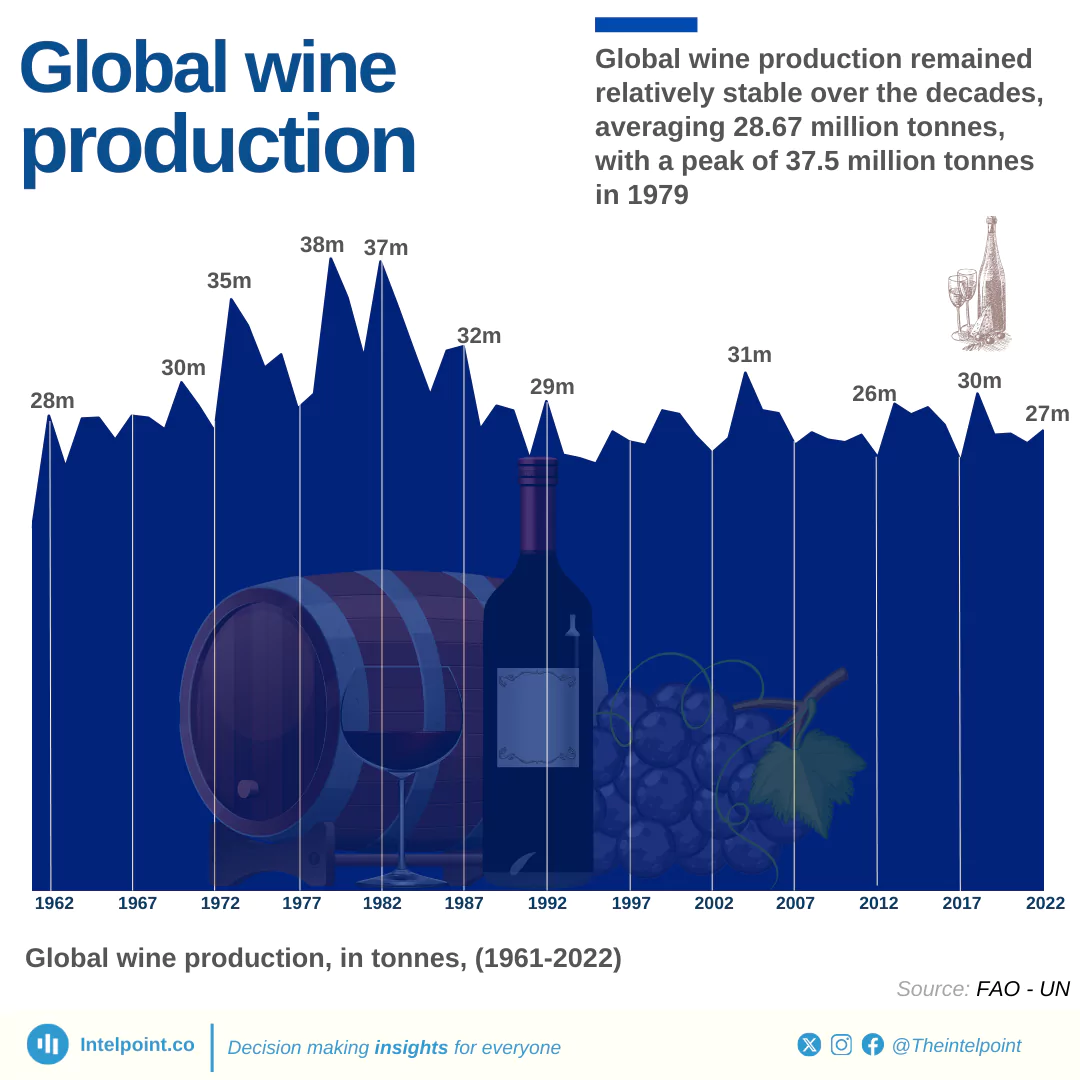
Global wine production followed a steadily increasing path from 1961 to 2022. Beginning at 21.5 million tonnes in 1961, production increased significantly over the following decades, reaching an all-time high of 37.5 million tonnes in 1979, a 74% rise from the 1961 level.

Following this peak, production settled into a more stable range, averaging approximately 28 million tonnes yearly. While there were natural fluctuations, the overall trend remained relatively consistent. By 2022, global wine production stood at 27.4 million tonnes, showing a 27% increase from the 1961 value.

Source:

FAO-UN

Period:

1961-2022
HTML code to embed chart
Want a bespoke report?
Reach out
Tags
Related Insights

Cocoa led Nigeria’s agricultural exports by value in Q1 2025, with over ₦1.2B
  • The value of agricultural goods exported in Q1 2025 rose to ₦1.70 trillion, up 64.65% year-on-year and 10.63% quarter-on-quarter, highlighting continued growth in the sector.
  • Standard and superior cocoa beans led the chart, contributing a combined ₦1.23 trillion, with major buyers being The Netherlands (₦344.17B) and Belgium (₦203.17B).
  • Cashew nuts in shell earned ₦157.63B, mostly exported to India (₦87.56B) and Vietnam (₦69.74B), while sesamum seeds brought in ₦128.18B.
  • Soya bean flours and ornamental flowers fetched ₦27B and ₦18B respectively, showing Nigeria's export mix is broadening.

Guinea-Bissau had the highest agricultural contribution to its GDP among African countries in 2024, at 36.8%
  • Guinea-Bissau showed the highest agricultural contribution to its GDP at 36.8% in 2024.
  • Contributions range widely, with high reliance seen in Comoros (36.6%) and Ethiopia (34.9%), contrasting with lower percentages in DR Congo (17.1%) and Angola (16.4%).
  • Agriculture, forestry, and fishing contributed a notable 20.4% to Nigeria's GDP in 2024.
  • Countries with high agricultural GDP contributions are predominantly located in West and East Africa.

Nigeria has produced over 1.39 billion tonnes of yam since 1961, over 64% of global production
  • Nigeria is the world’s top yam producer since the 1980s.
  • West Africa supplies over 95% of global yam output.
  • Ghana and Côte d’Ivoire have grown steadily in the rankings.
  • Non-African countries play a very small role today.
  • Nigeria exports very little yam despite massive production.

India leads global banana production with 36.6M tonnes in 2024 as Nigeria ranks 4th among top producers with 7.3M tonnes
  • India dominates global banana output with 36.6 million tonnes, accounting for over a third of total production among the top 10 countries.
  • China (11.7M) and Indonesia (9.34M) round out the top three, contributing significantly to Asia’s dominance in banana farming.
  • Nigeria ranks 4th globally, producing 7.3 million tonnes, slightly ahead of Ecuador and Brazil.
  • Africa is well represented, with Nigeria, Angola, and Tanzania collectively contributing 15.86 million tonnes, or about 16% of the top 10 output.

Despite volatility, Nigeria's kola nut production reached 188,700 tonnes in 2023, a 117.7% increase from the 1994-2006 average
Key Takeaways:
  • In 2023, Nigeria's kola nut production reached a peak of 188,703.54 tonnes.
  • Following a decline in production from 1994 to 2006, production rose dramatically from 2007 onwards.
  • Between 1997 and 2001, production was lowest, at only 82,000 tonnes.
  • The 2010s saw steady growth, fuelled by increased agricultural investment and possibly rising domestic or export demand.
  • The average production from 1994 to 2006 was 86,698.12 tonnes.

Western Africa produces the largest share of cashew nuts in Africa, growing by nearly 2,443% since 1990
Key Takeaways:
  • Africa’s total cashew nut (in shell) production increased from 172,050 tonnes in 1961 to over 2.25 million tonnes in 2023, a growth of approximately 1,209%.
  • Western Africa has been the primary driver of this growth since the 1990s and now produces the largest share of cashew nuts in Africa.
  • Western Africa accounted for 84% of Africa’s total cashew nut production by 2023.
  • Middle Africa has maintained a minimal but consistent level of production.
  • Eastern Africa led production from the 1960s through the 1980s before being overtaken by Western Africa.
  • The most significant growth in Africa’s cashew production began in the 1990s.
  • Despite overall growth, cashew production in Africa has experienced periodic fluctuations.
  • Mostly due to their climate conditions, Southern and Northern Africa regions are less favourable for cashew production than other African regions.

POPULAR TOPICS
SIGN UP TO OUR NEWSLETTER
Get periodic updates about the African startup space, access to our reports, among others.
Subscribe Here
Subscription Form

A product of Techpoint Africa. All rights reserved