Ghana’s debt interest fell to $780 million in 2023 after peaking at a record $1.49 billion in 2022

Key Takeaways

  • Ghana’s debt interest payments remained below $200 million for nearly three decades, reflecting relatively low external borrowing.
  • From 2000 to 2010, payments rose moderately, reaching $300 million by 2010 as Ghana’s borrowing needs expanded.
  • Interest payments accelerated sharply, surpassing $1 billion in 2017 and peaking at $1.49 billion in 2022.
  • After years of growth, payments plunged to $780 million in 2023, suggesting debt restructuring, payment relief, or reduced new borrowing.

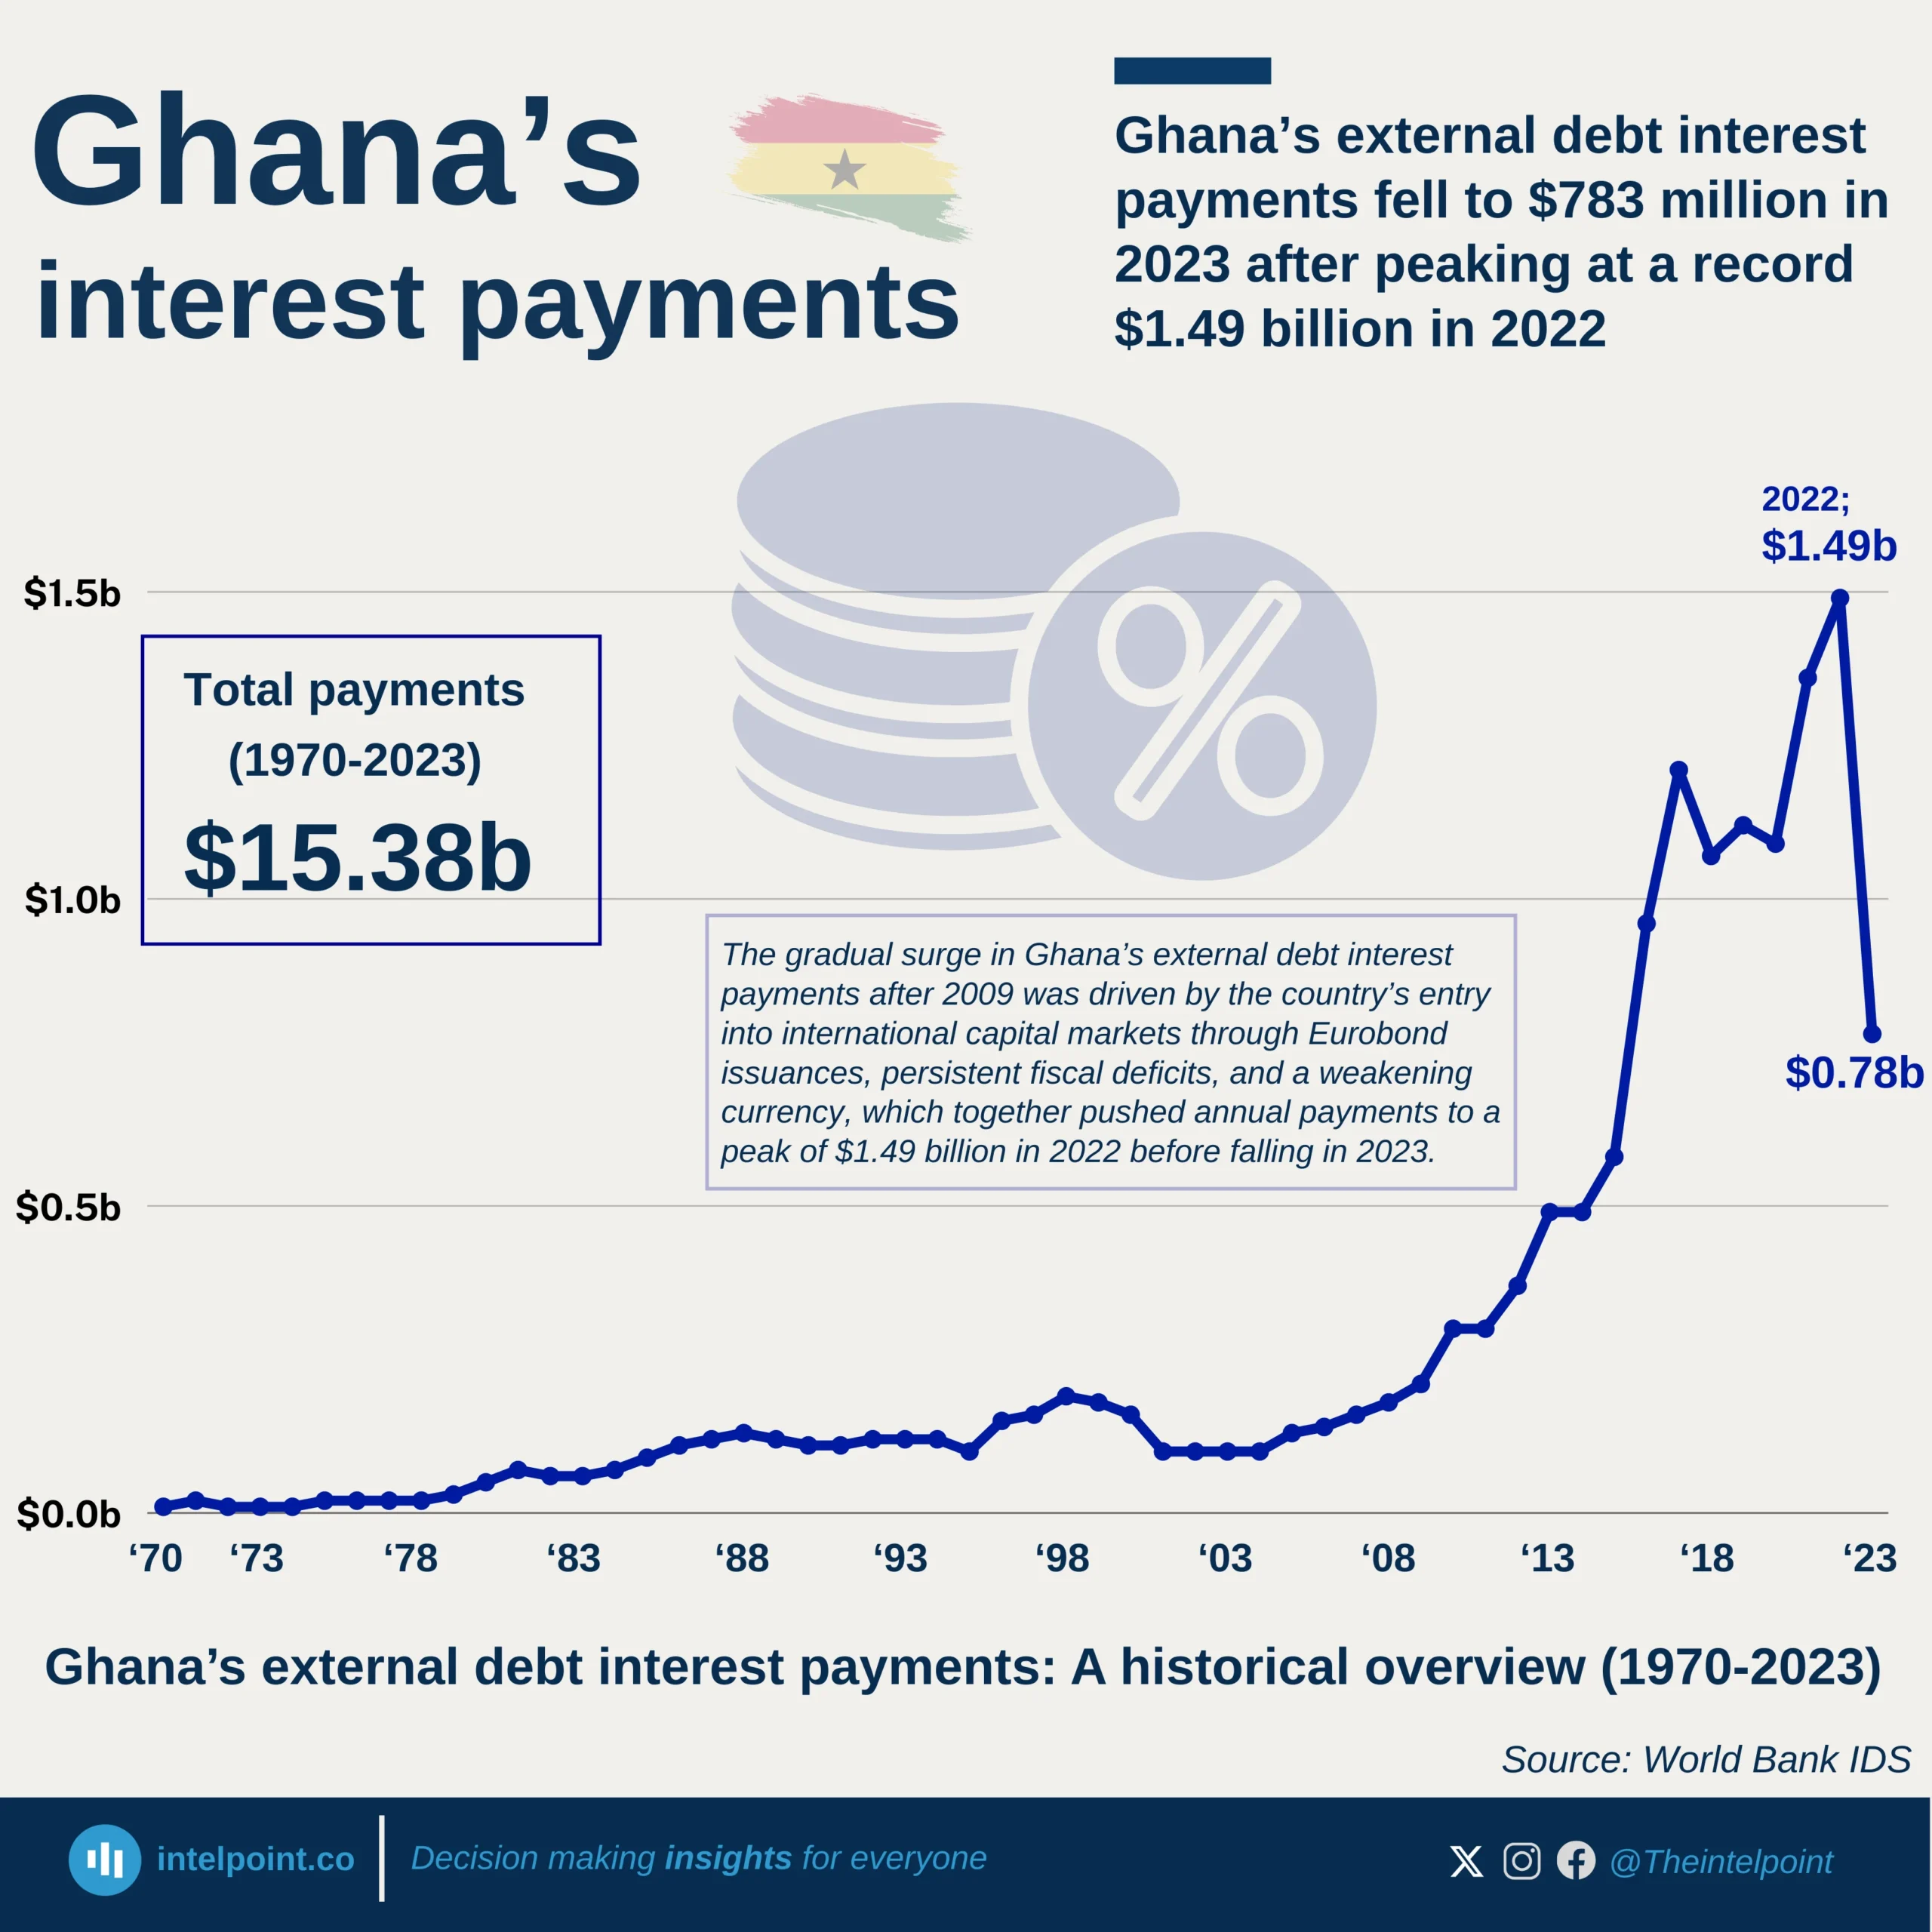
Ghana’s external debt interest payments tell a striking story of economic transition. For decades, from the 1970s through the early 2000s, the burden was modest, rarely exceeding $200 million. However, as the country pursued ambitious development goals and tapped into global capital markets, the cost of servicing debt grew rapidly. By 2016, payments approached $1 billion, and just six years later, they peaked at $1.49 billion in 2022, underscoring the intensity of Ghana’s debt exposure. In 2023, the figure dropped dramatically to $780 million, nearly half the previous year’s level, signalling a potential turning point linked to economic adjustments, fiscal reforms, or international debt relief efforts.

Source:

World Bank IDS

Period:

1970 - 2023
HTML code to embed chart
Want a bespoke report?
Reach out
Tags
Related Insights

Yams produced in Nigeria in 2023 were valued at $25.4b, the highest among major reported commodities
  • After yielding 61.9 million tonnes, yams were valued at $25.4 billion in 2023, the highest among reported commodities.
  • With 62.7 million tonnes produced, cassava generated $9.1 billion, making it the second most valuable crop.
  • Okra ($818/t), tomatoes ($808/t), and pineapples ($753/t) earned the highest returns per unit despite smaller volumes (1.6–3.8 million tonnes).
  • Maize ($3.7 b, 11.1 m t), rice ($3.1 b, 8.9 m t), sorghum ($2.3 b, 6.4 m t), cowpeas ($1.2 b, 4.3 m t), and groundnuts ($0.9 b, 4.3 m t) form the backbone of production.

The basket of food that cost ₦100k in January 2025 cost approximately ₦114k in August
  • Food prices rose roughly 13.9% from January to August 2025, according to the rebased Consumer Price Index (CPI) from the National Bureau of Statistics.
  • Month-on-month inflation for food fluctuated, with some months seeing sharper increases than others.
  • Using January as a baseline, the purchasing power of money for food declined steadily, meaning households need more naira to buy the same items.
  • Food carries a large weight in the CPI basket, making it a major driver of overall inflation and cost-of-living increases.

Trade and agriculture led Nigeria’s ₦51.20 trillion economy in Q2 2025, as oil’s share remained modest
  • Trade contributed 18.28%, making it the largest sector in Q2 2025's GDP.
  • Crop production followed with 17.8%, underscoring agriculture’s central role.
  • Oil and gas added just 4.05%, highlighting its shrinking share compared to non-oil sectors.
  • Real estate and telecoms reinforced the growing strength of services in the Nigerian economy.

Kenya's private sector credit growth plunged to 0.9% from a peak of 13.5% and has now rebounded to 4.4%
  • Private sector credit growth peaked at 13.5% in Q4 2023.
  • Growth remained stable between 12 and 13% throughout 2022 and 2023.
  • A sharp decline began in 2024, dropping to 11.5% in Q1.
  • Credit growth plunged to 5.4% in Q2 2024, showing a steep contraction.
  • The lowest point was Q4 2024, at just 0.9%.
  • A rebound started in early 2025, with growth rising to 2.4% in Q1.
  • By Q2 2025, private sector credit growth recovered to 4.4%, though still far below its 2023 highs.

Private sector lending in Kenya is concentrated in manufacturing, trade, and households, accounting for a combined 54.5%
  • Private households hold the largest share of credit at 27.8%.
  • Trade accounts for 14.4% of outstanding private sector loans.
  • Manufacturing makes up 12.3% of the private sector credit share.
  • Combined, households, trade, and manufacturing absorb 54.5% of all private credit.
  • Consumer durables contribute 9.4% of outstanding loans.

In ten years, Osun State’s IGR rose nearly fivefold to ₦54.7b in 2024, driven by a great 97% leap from 2023
  • Osun’s Internally Generated Revenue (IGR) grew from ₦11.78b in 2015 to ₦54.70b in 2024, marking a 364% increase.
  • The state maintained steady annual growth after 2017, with notable acceleration from 2020 onward.
  • The single biggest leap occurred between 2023 and 2024, with revenue nearly doubling from ₦27.72b to ₦54.70b.
  • The upward trend reflects improved tax collection, diversification of revenue sources, and stronger fiscal policies.

POPULAR TOPICS
SIGN UP TO OUR NEWSLETTER
Get periodic updates about the African startup space, access to our reports, among others.
Subscribe Here
Subscription Form

A product of Techpoint Africa. All rights reserved