Fuels and lubricants dominated 2024 imports, accounting for 37.4% (₦22.7T) of the total ₦60.6T

  • Nigeria imported a total of ₦60.6 trillion worth of goods in 2024.
  • Fuels and lubricants dominated imports with ₦22.7 trillion (37.4%).
  • Industrial supplies accounted for ₦13.4 trillion (22.1%), showing strong demand for production inputs.
  • Capital goods and parts represented ₦9.1 trillion (15%).
  • Food and beverage imports reached ₦6.6 trillion (10.9%), signalling a high reliance on external food sources.

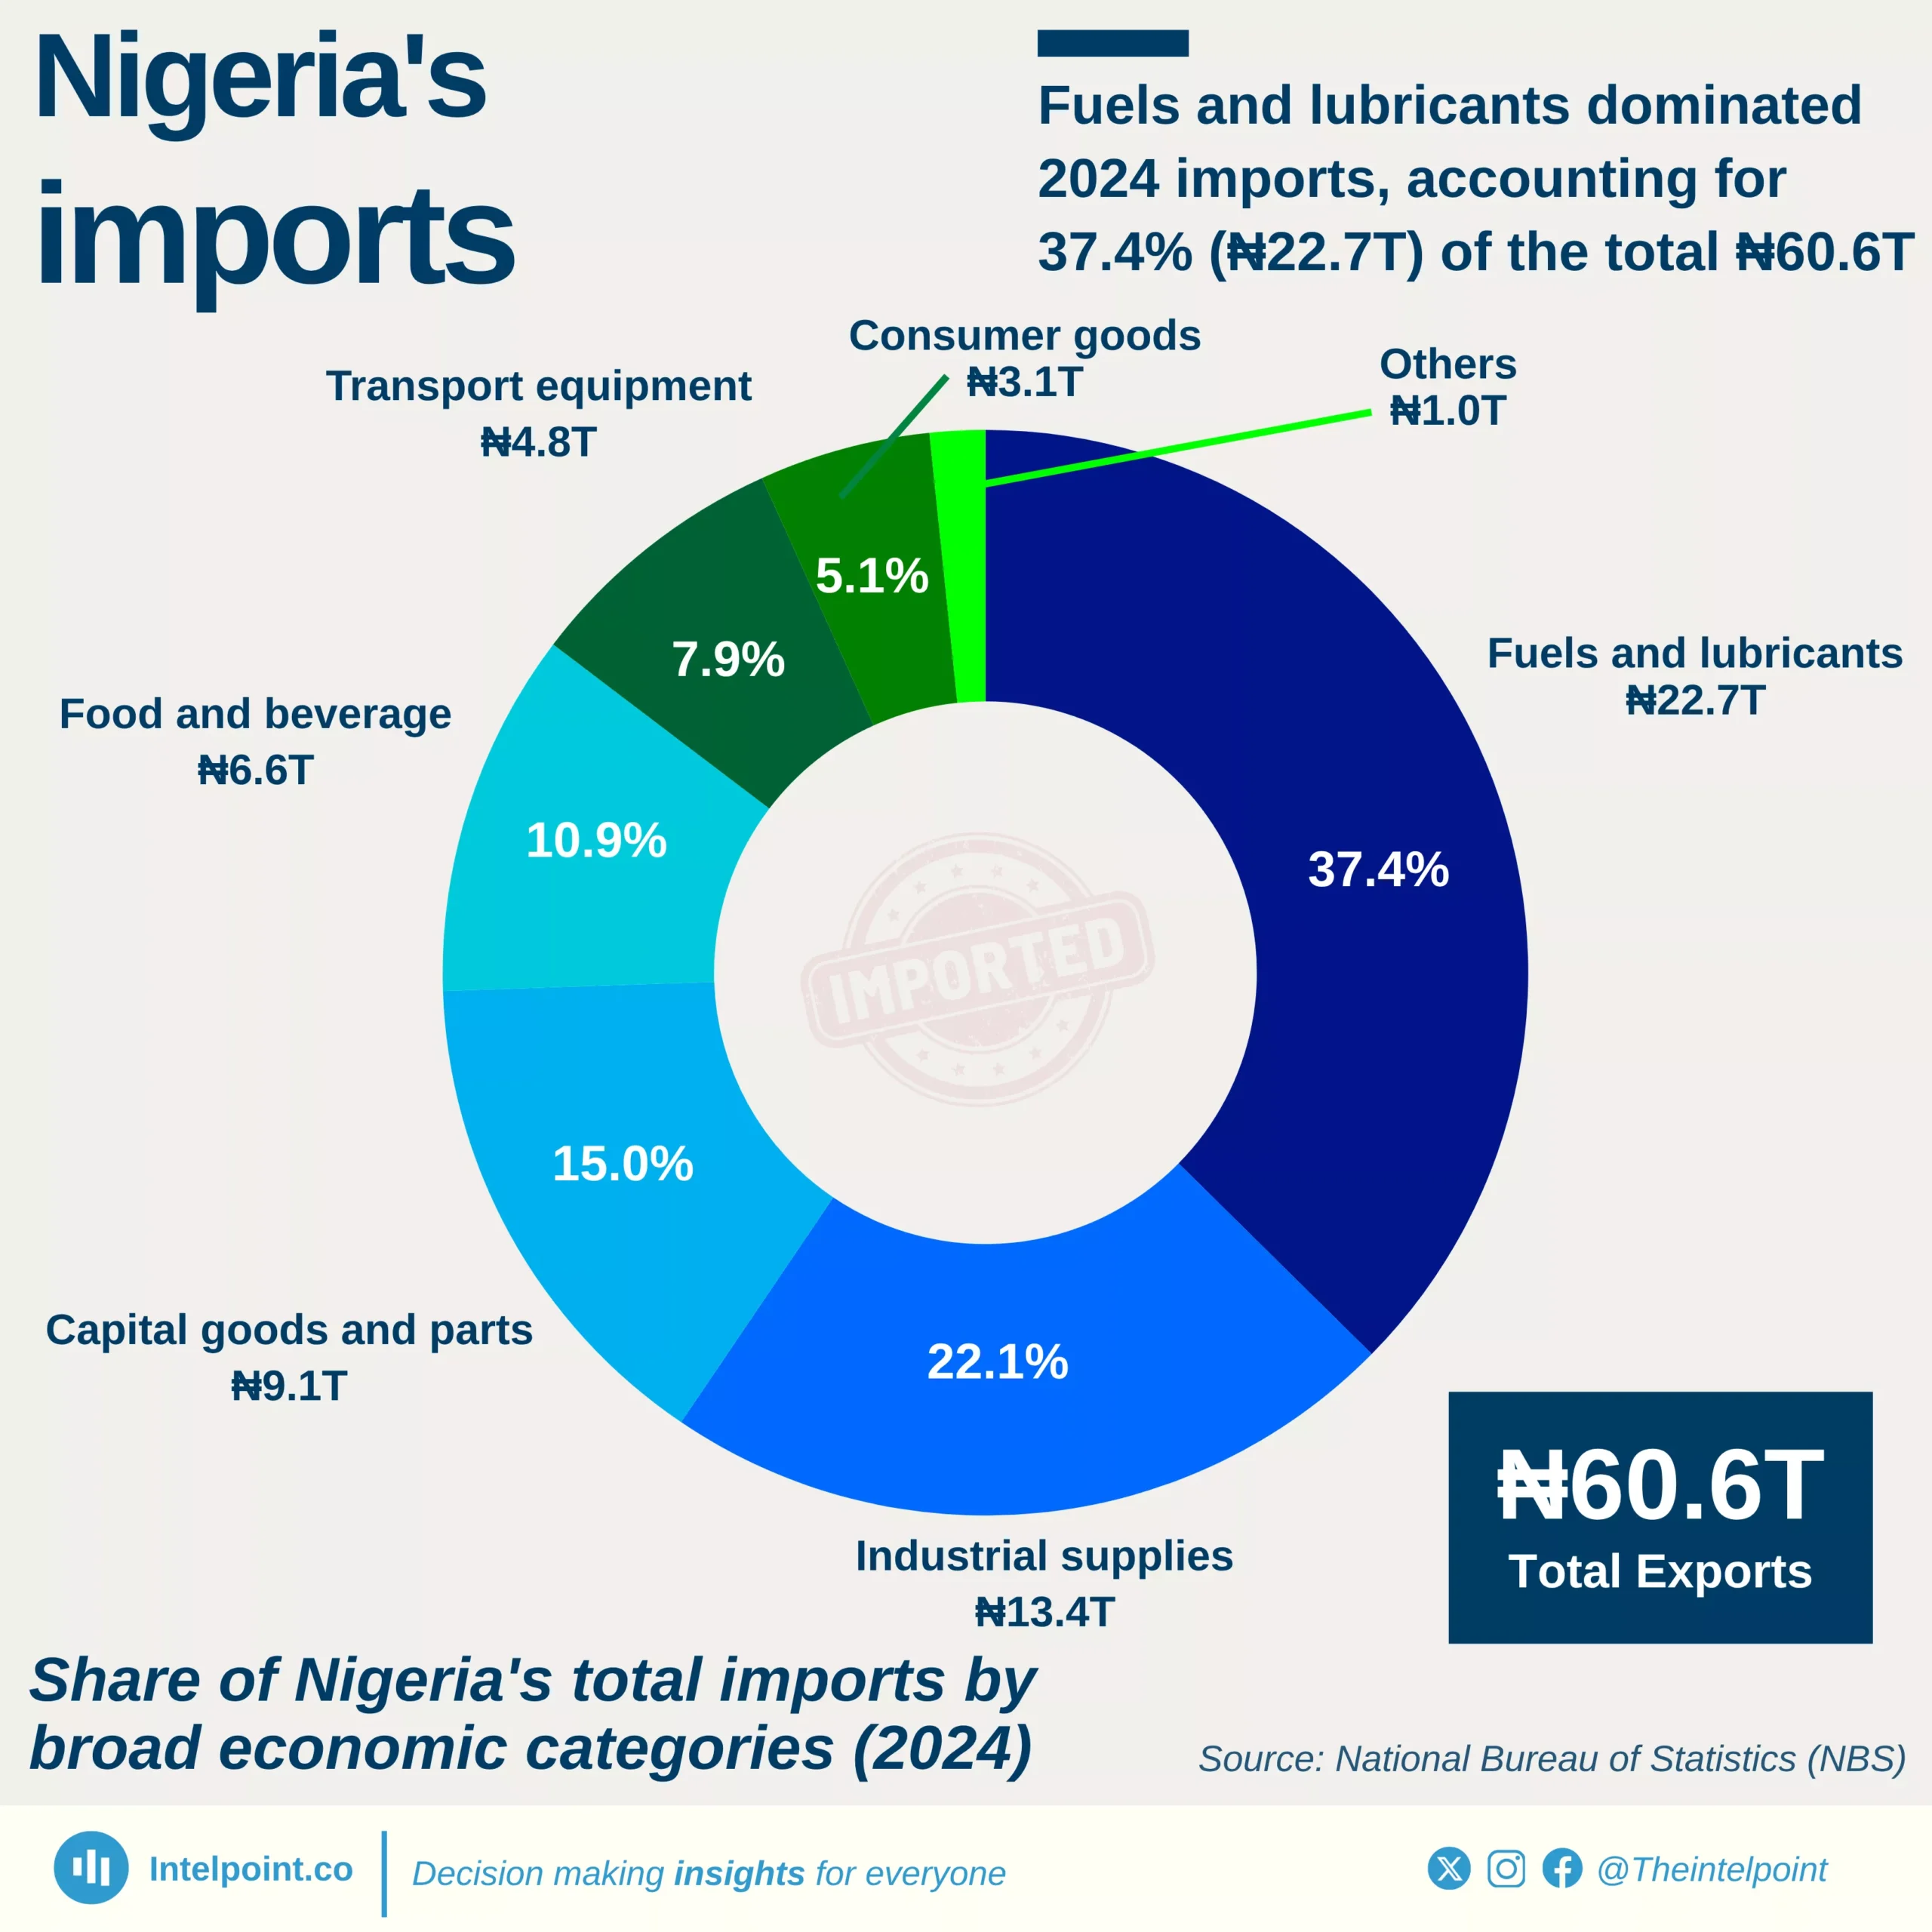
Nigeria’s total imports reached ₦60.6 trillion in 2024, with fuels and lubricants emerging as the dominant import category, accounting for ₦22.7 trillion (37.4%) of the total. This underscores the country’s heavy reliance on imported petroleum products despite being a major crude oil producer. Industrial supplies ranked second with ₦13.4 trillion (22.1%), reflecting the strong demand for raw materials and intermediate goods needed by Nigeria’s manufacturing and construction sectors.

Source:

National Bureau of Statistics

Period:

2024
HTML code to embed chart
Want a bespoke report?
Reach out
Tags
Related Insights

Nigeria's imports of food and beverage have grown in value by 265% since 2020, reaching ₦6.6T in 2024
  • Nigeria’s food and beverage imports increased almost ninefold, from ₦0.7 trillion in 2013 to ₦6.6 trillion in 2024.
  • Imports remained relatively stable between 2015 and 2019, averaging around ₦1.1–₦1.6 trillion.
  • A major spike occurred in 2021, when imports surged by 62%, reaching ₦2.9 trillion.
  • Overall, the trend underscores Nigeria’s ongoing challenge of reducing dependency on imported food and beverages despite policies aimed at self-sufficiency.

Nigeria is buying more from ECOWAS, with their share of African imports up to 32.4% in H1 2025
  • ECOWAS’s share of Nigeria’s African imports grew to 32.4% in H1 2025, up from 15.0% in 2021.
  • The lowest ECOWAS import share was recorded in 2014 (8.8%), showing significant progress since then.
  • The share of ECOWAS imports has more than doubled since 2021, signalling stronger regional trade ties.
  • Nigeria’s total imports from Africa rose to ₦1.8 trillion in 2025 (H1), indicating expanding trade activity.

For every $1 Ghana earns from exporting pharmaceutical products, it spends about $22 on imports
  • For every $1 Ghana earns from pharmaceutical exports, it spends about $22 on imports, underscoring the country’s overwhelming dependence on foreign pharmaceutical products.
  • Ghana is a net importer of medicine and has been for nearly two decades.
  • By 2015, Ghana’s pharmaceutical imports reached its peak with $348.12m while exports were $3.10m, meaning imports were nearly 100 times larger.
  • In 2016, Ghana recorded its highest-ever export performance at $78.33 million, but even then, imports stood at $154.96m, almost two times higher.

For the first time in 17 years, Ghana’s ceramic exports recorded a $19.9m surplus in 2023
  • In 2023, Ghana recorded $91.9m in ceramic exports, amassing $19.9m profit, after 17 years of consistent trade losses and heavy dependence on imported ceramic products.
  • For 17 years, Ghana’s ceramic market was largely import-driven, with local industries struggling to compete against foreign products.
  • Ghana's ceramic products trade recorded $1.397 billion in trade deficit in almost two decades.
  • Ghana's ceramic industry has finally moved from dependency to a driver of profit and progress.

Over the past two decades, Egypt exported roughly twice as much ceramic products as it imported
  • Over the past two decades, Egypt exported roughly twice as much ceramic products as it imported, positioning itself as a key player in regional and global ceramic products trade.
  • In 2012, exports peaked at $488.51 million, more than double imports at $178.23 million, setting a clear demonstration of strong industrial and commodity output.
  • In 2008, exports soared to $325.86 million, more than doubling imports at $126.21 million.
  • Between 2017 and 2021, the export sector showed stable performance, averaging $327 million annually.
  • The year 2021 was a standout, with exports reaching $401.12 million, reflecting a strong rebound that reaffirmed Egypt’s export capacity post-pandemic.

The U.S. consistently leads Nigeria’s imports from the Americas, accounting for 57–73% in 13 years
  • The U.S. consistently leads Nigeria’s imports from the Americas, accounting for 57–73% between 2013 and 2025.
  • Brazil ranks second, with shares ranging between 11% and 24%, highlighting its steady trade ties with Nigeria.
  • During the period, the combined share of the U.S. and Brazil never fell below 76%, even at its lowest point in 2022.
  • Total imports from the Americas surged from ₦0.9 trillion in 2013 to a peak of ₦6.3 trillion in 2024.
  • Canada’s import share peaked at 16.4% in 2022, showing a rare moment of diversification.

POPULAR TOPICS
SIGN UP TO OUR NEWSLETTER
Get periodic updates about the African startup space, access to our reports, among others.
Subscribe Here
Subscription Form

A product of Techpoint Africa. All rights reserved