Crude oil leads Nigeria’s global exports with 68.87% share, while refined petroleum products (motor spirit, gas oil) top its imports at over 27%

Key Takeaways:

  • Crude oil remains Nigeria’s largest export, while refined petroleum products lead imports.
  • Natural gas ranks as the second-largest export, contributing 9.71% of the total export value.
  • The top five imported products account for 32.28% of Nigeria’s global imports.
  • The top ten exports represent over 95% of Nigeria’s total export value.

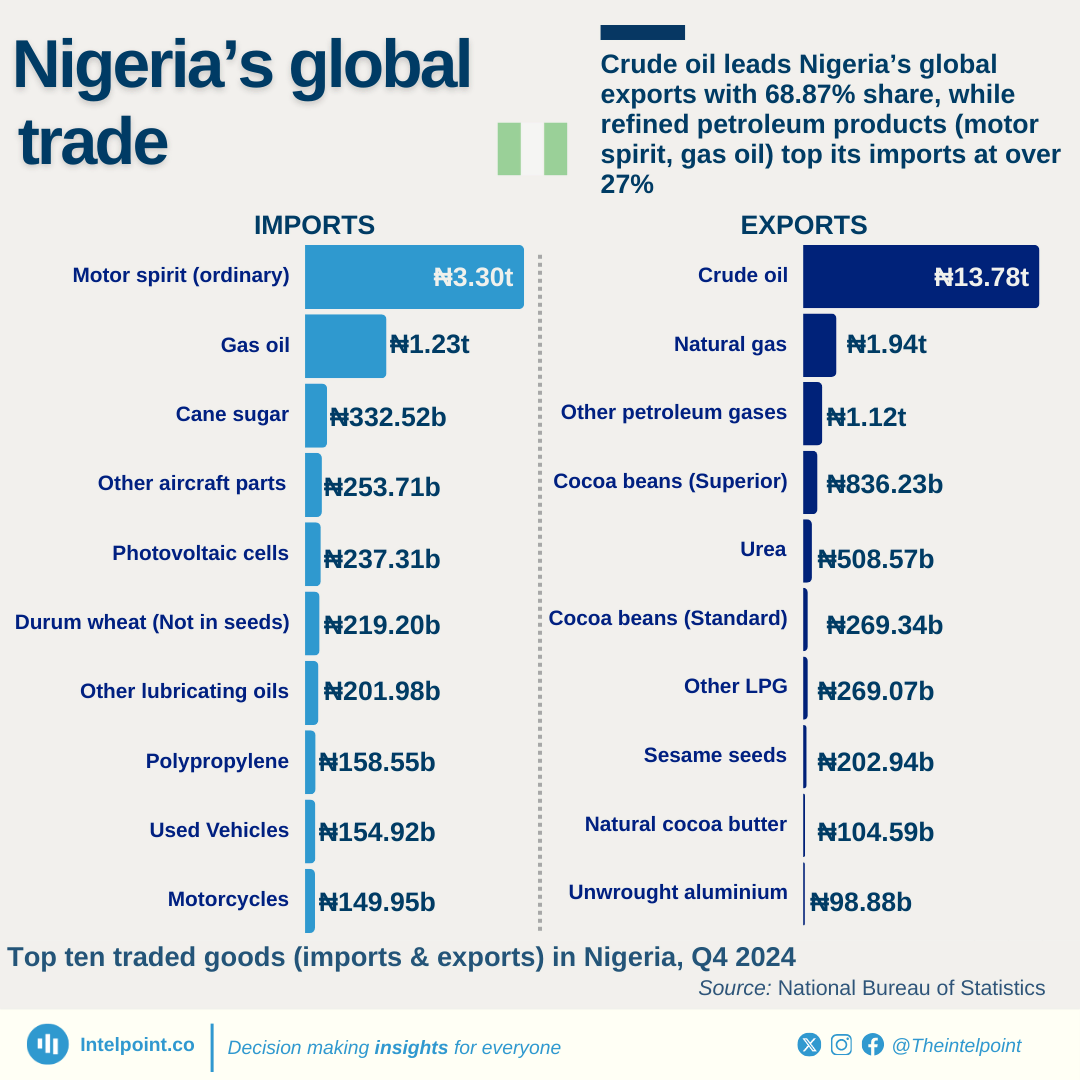
In the fourth quarter of 2024, crude oil and oil obtained from bituminous minerals accounted for ₦13.78 trillion, representing nearly 70% of Nigeria’s global exports. Natural gas followed, adding ₦1.94 trillion or 9.71% to Nigeria’s global exports.

On the import side, refined petroleum products topped the list. Motor spirit (petrol) led with ₦3.3 trillion, while gas oil followed with ₦1.23 trillion. Together, these accounted for over 27% of Nigeria’s global import value.

Though oil dominates the country's export trade landscape, non-oil exports such as cocoa beans, sesame seeds, and natural cocoa butter are emerging as valuable contributors to its export diversification strategy, with individual shares ranging from 0.52% to 4.18%. Meanwhile, Nigeria’s imports reflect a broad range of needs, highlighting the importance of enhancing domestic manufacturing and reducing reliance on foreign goods.

Source:

National Bureau of Statistics

Period:

Q4 2024
HTML code to embed chart
Want a bespoke report?
Reach out
Tags
Related Insights

The U.S. consistently leads Nigeria’s imports from the Americas, accounting for 57–73% in 13 years
  • The U.S. consistently leads Nigeria’s imports from the Americas, accounting for 57–73% between 2013 and 2025.
  • Brazil ranks second, with shares ranging between 11% and 24%, highlighting its steady trade ties with Nigeria.
  • During the period, the combined share of the U.S. and Brazil never fell below 76%, even at its lowest point in 2022.
  • Total imports from the Americas surged from ₦0.9 trillion in 2013 to a peak of ₦6.3 trillion in 2024.
  • Canada’s import share peaked at 16.4% in 2022, showing a rare moment of diversification.

Nigeria's H1 trade: Imports from ECOWAS countries rose from 12% in H1 2021 to a peak of nearly 40% in H1 2024
  • Imports from ECOWAS countries peaked at 39.9% in H1 2024, up from just 12.0% in H1 2021.
  • The share declined to 32.4% in H1 2025, showing a reversal after the 2024 peak.
  • Total import values grew sharply, from ₦209.6B in H1 2020 to ₦1.8T in H1 2025.
  • In H1 2019, ECOWAS already had a decent share of 19.6%, showing long-standing but fluctuating trade ties.

The ECOWAS share of Nigerian exports to African countries nearly doubled, from 34.2% to 62.1%
  • ECOWAS’ share of Nigerian exports rose from 34.2% in H1 2019 to 62.1% in H1 2025.
  • The most significant share came in H1 2022, when ECOWAS accounted for 75.8% of exports.
  • Exports to other African countries dropped significantly in 2022, to just 24.2%.
  • Nigeria’s total exports to Africa grew from ₦0.9T in H1 2022 to ₦4.8T in H1 2025.
  • ECOWAS consistently maintained a majority share from H1 2022 onwards, with a share above 60%.

Nigeria’s exports remain oil-dominated, but non-oil exports are steadily rising—reaching up to 18% in early 2025
  • Oil exports continued to dominate, averaging over 88% of total exports in 2024 and remaining above 81% in the first half of 2025.
  • Non-oil exports rose gradually, from a low of 6.9% (February 2024) to a high of 18.1% (January 2025).
  • Peaks in non-oil export contributions occurred in July 2024 (16.4%) and January–April 2025 (13–18%), indicating progress toward diversification.
  • Total exports remained heavily oil-driven, though sustained double-digit non-oil shares in late 2024 and early 2025 show a slow shift.

After a decline from 13.1% in 2019, the non-oil export share grew by 5.6 percentage points, from 8.7% (2023) to 14.3% (2025)
  • Non-oil exports rose to 14.3% of total exports in 2025, up from 8.7% in 2023.
  • Oil exports still represent 85.7% of total exports in 2025.
  • The non-oil share reached 13.1% in 2019 before dipping and rebounding by 2025.
  • Nigeria’s total exports expanded from ₦9.6 trillion in 2015 to ₦43.3 trillion in H1 2025, showing strong value growth.
  • The lowest non-oil share in the decade occurred in 2016 (4%), reflecting heavy oil dependence.

China dominates Nigeria’s imports while Spain leads as top export destination in Q2 2025
  • China remains Nigeria’s largest import partner, accounting for ₦4.96T or 32.45% of total imports—more than double the U.S.'s share.
  • The United States holds second place in imports, contributing ₦2.16T (14.12%), while India, the Netherlands, and the UAE follow with smaller shares below 6%.
  • Spain tops Nigeria’s export market, receiving ₦2.47T worth of goods, representing 10.85% of total exports.
  • Europe features strongly among export partners, with Spain, France, and the Netherlands together absorbing nearly a quarter of Nigeria’s outbound trade.

POPULAR TOPICS
SIGN UP TO OUR NEWSLETTER
Get periodic updates about the African startup space, access to our reports, among others.
Subscribe Here
Subscription Form

A product of Techpoint Africa. All rights reserved