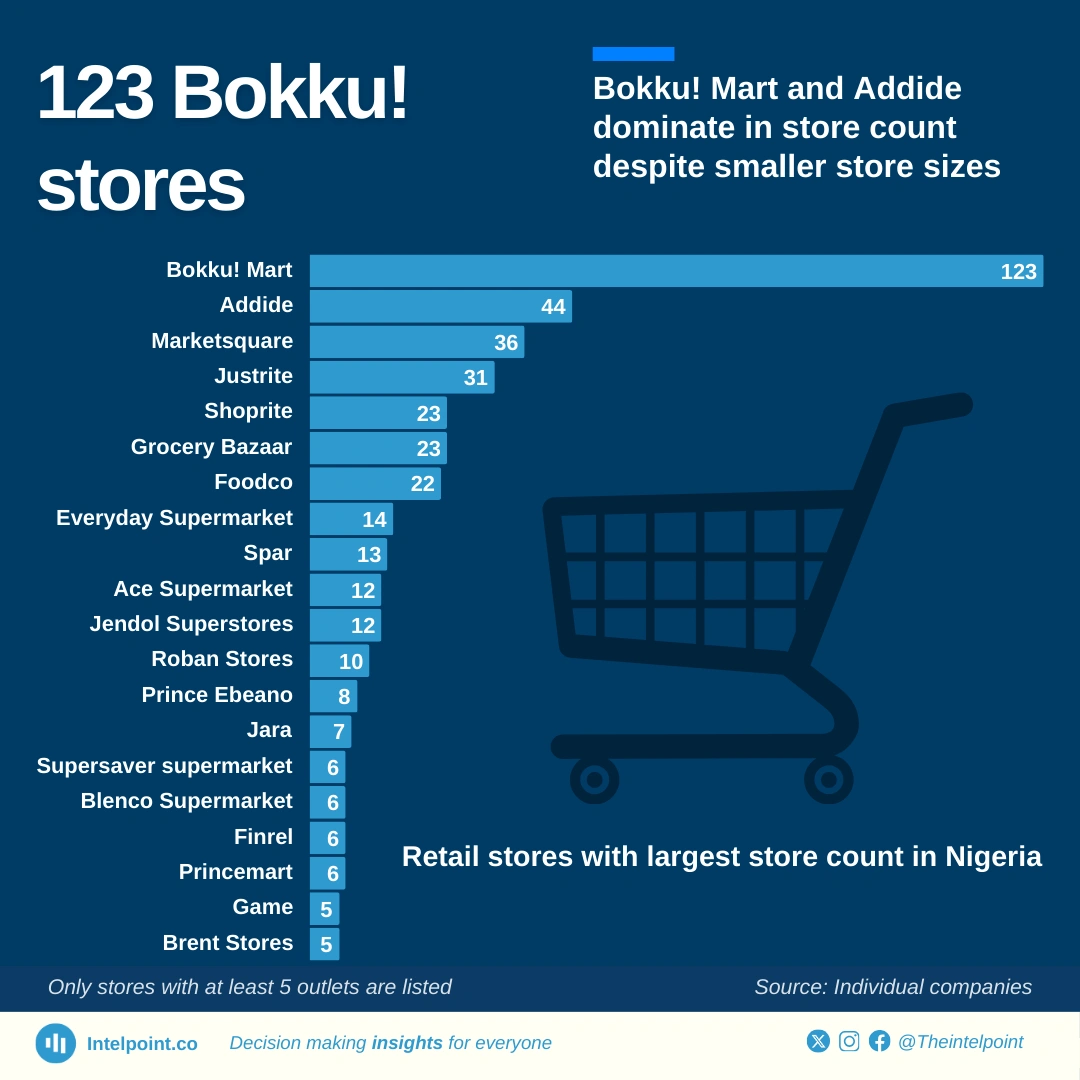
Bokku! Mart and Addide dominate in store count despite smaller store sizes

Key takeaways

  • Bokku! Mart dominates the retail landscape with 123 locations, nearly three times the count of the second-largest chain, Addide, which has 44 stores
  • Marketsquare, Justrite, and Shoprite round out the top five with 36, 31, and 23 stores, respectively, indicating a competitive yet fragmented retail sector
  • Most retail chains have fewer than 25 stores, with 13 out of the 18 listed having fewer than 15 stores
  • Traditional supermarket names like Shoprite and Game face competition from local brands

Nigeria’s retail sector is highly fragmented, with some players having extensive footprints. Bokku! Mart leads with 123 stores, far ahead of the second-largest chain, Addide, which has 44 stores. Other notable brands like Marketsquare, Justrite, and Shoprite have between 23 and 36 stores.
Despite Shoprite’s international reputation, it lags behind indigenous brands in terms of store count. The majority of retail chains have fewer than 15 outlets, reflecting the sector's challenges in achieving large-scale expansion. While some brands focus on widespread presence, others prioritise fewer but larger stores.
Source:

Individual companies

Period:

2025
HTML code to embed chart
Want a bespoke report?
Reach out
Tags
Related Insights

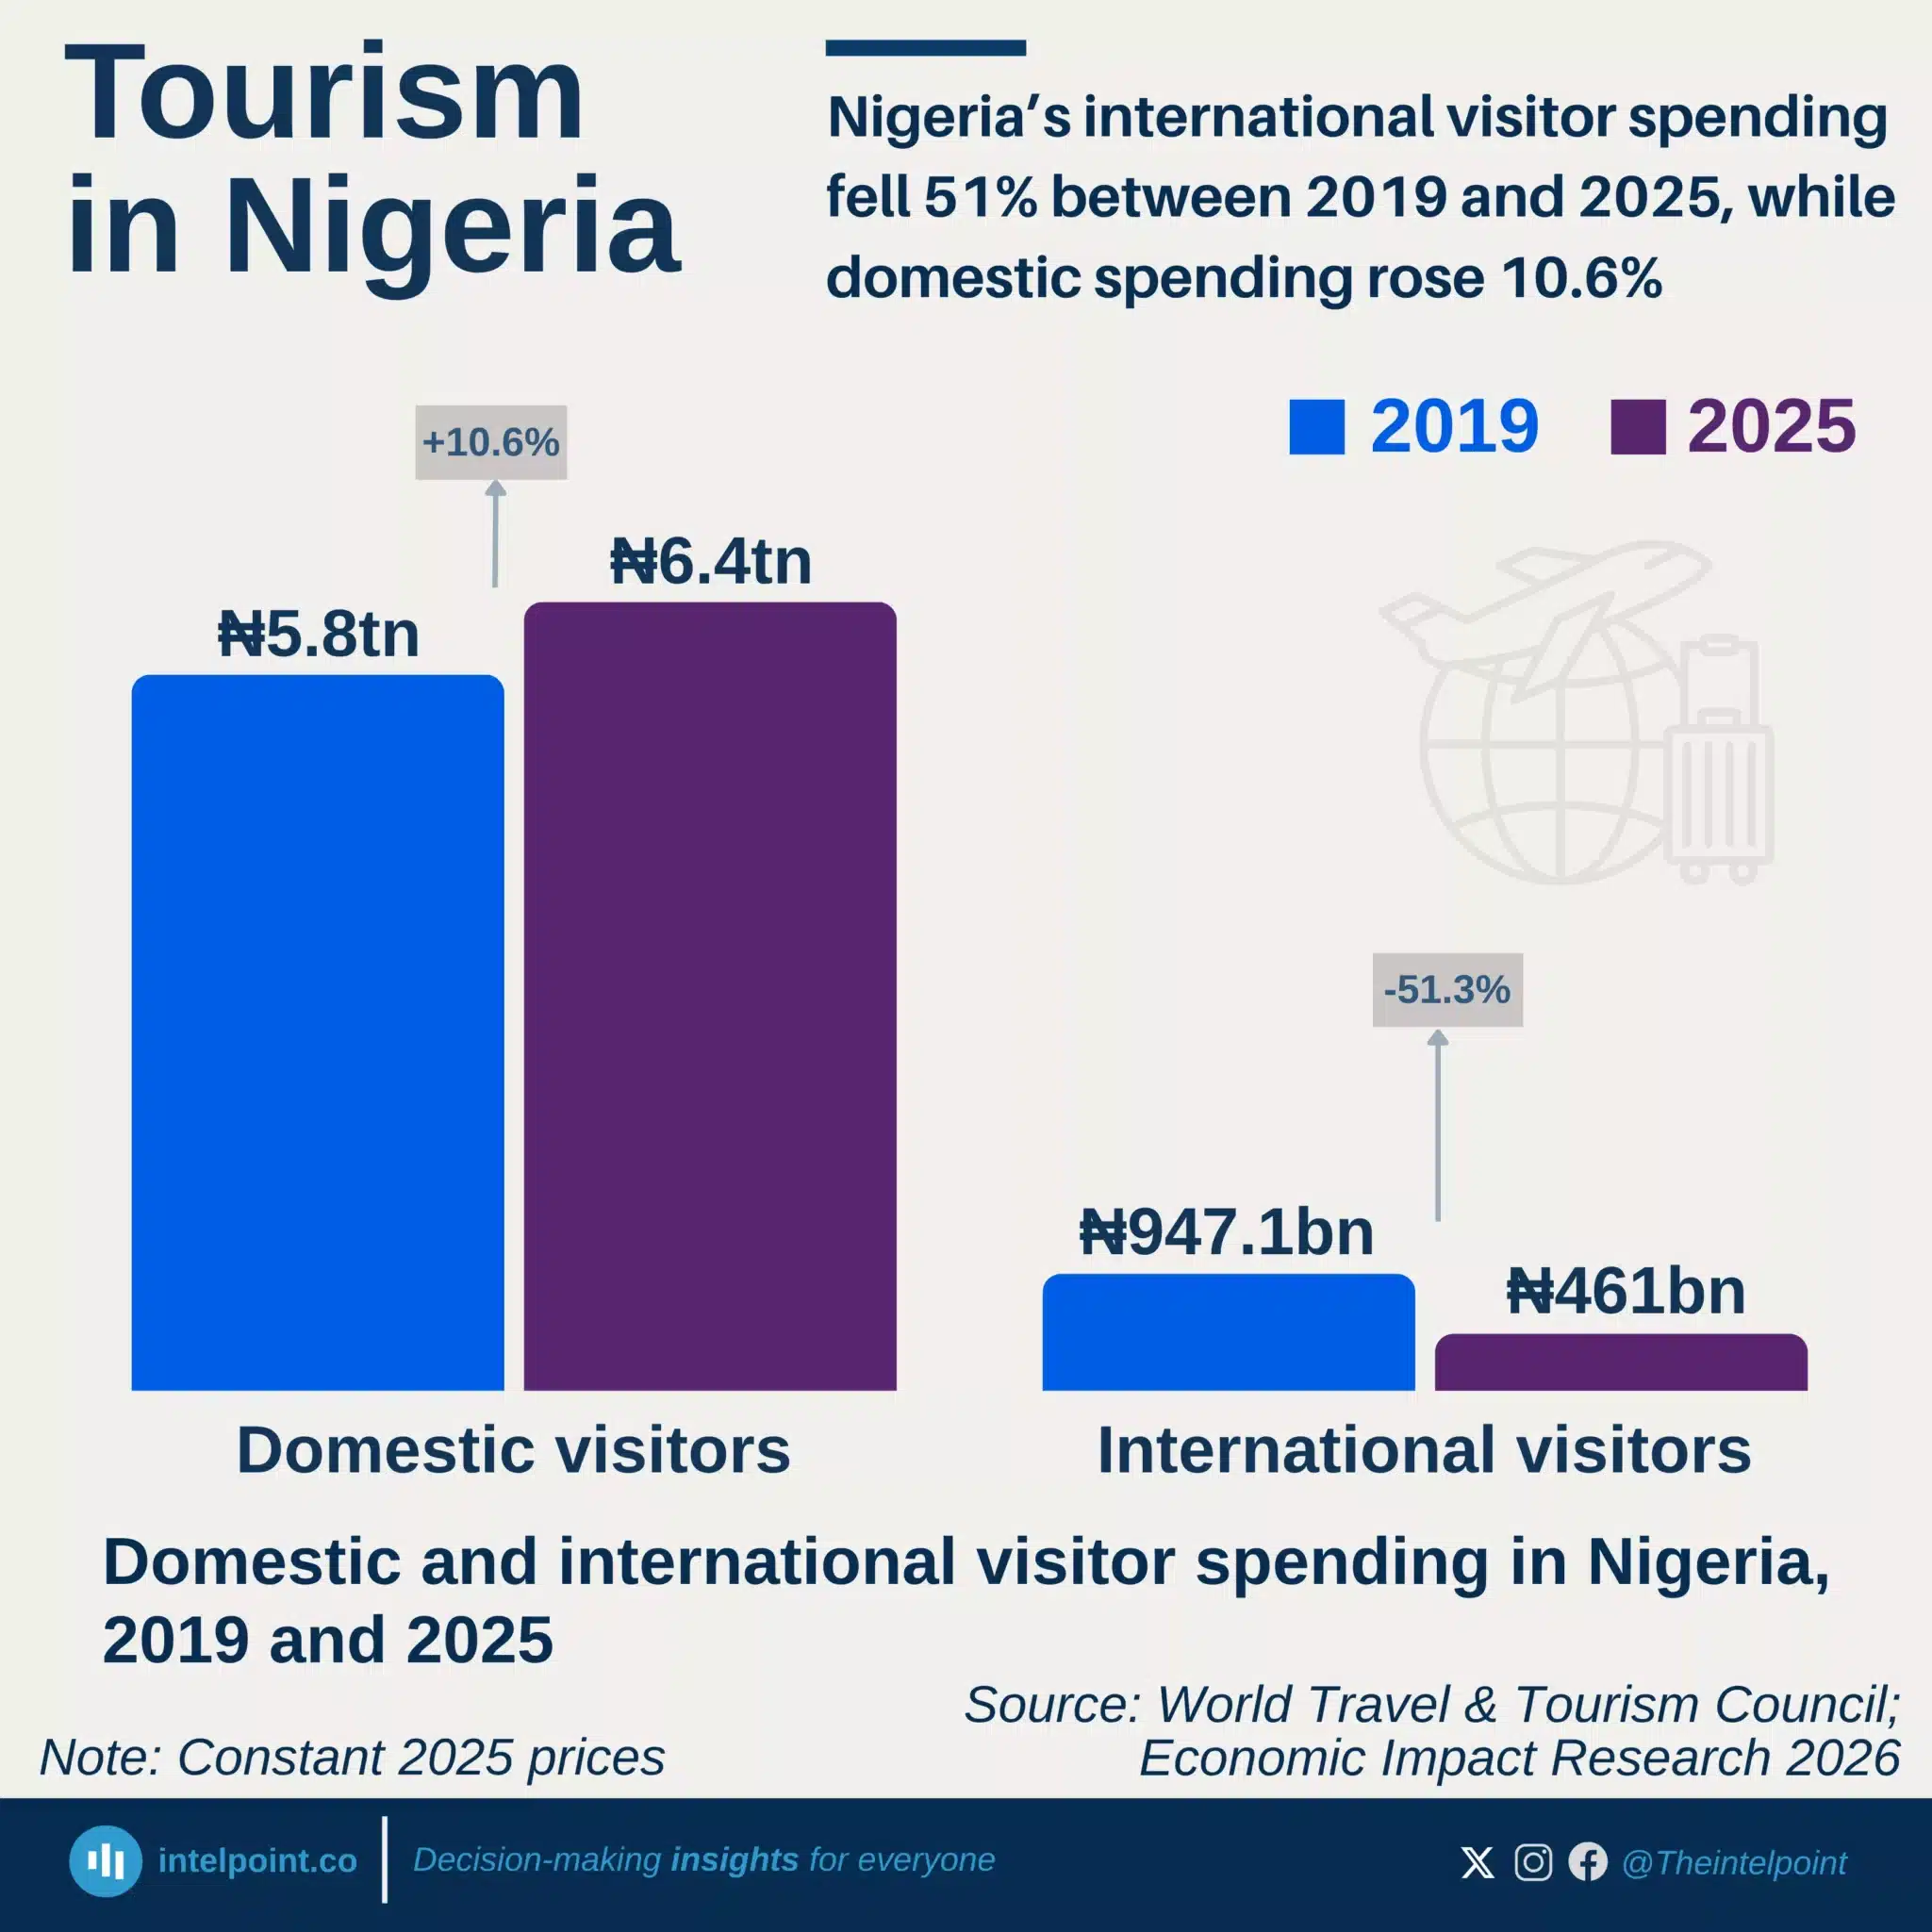
Nigeria’s international visitor spending fell 51% between 2019 and 2025, while domestic spending rose 10.6%
  • International visitor spending fell 51.3%, from ₦947.1 billion in 2019 to ₦461 billion in 2025.
  • For every ₦100 international visitors spent in 2019, they spent about ₦49 in 2025, adjusted for inflation.
  • International visitor spending declined for three consecutive years, falling 18.6% in 2025.
  • Domestic visitor spending rose 10.6% between 2019 and 2025 to ₦6.39 trillion.
  • Domestic visitors accounted for roughly ₦93 of every ₦100 spent on travel and tourism within Nigeria in 2025.

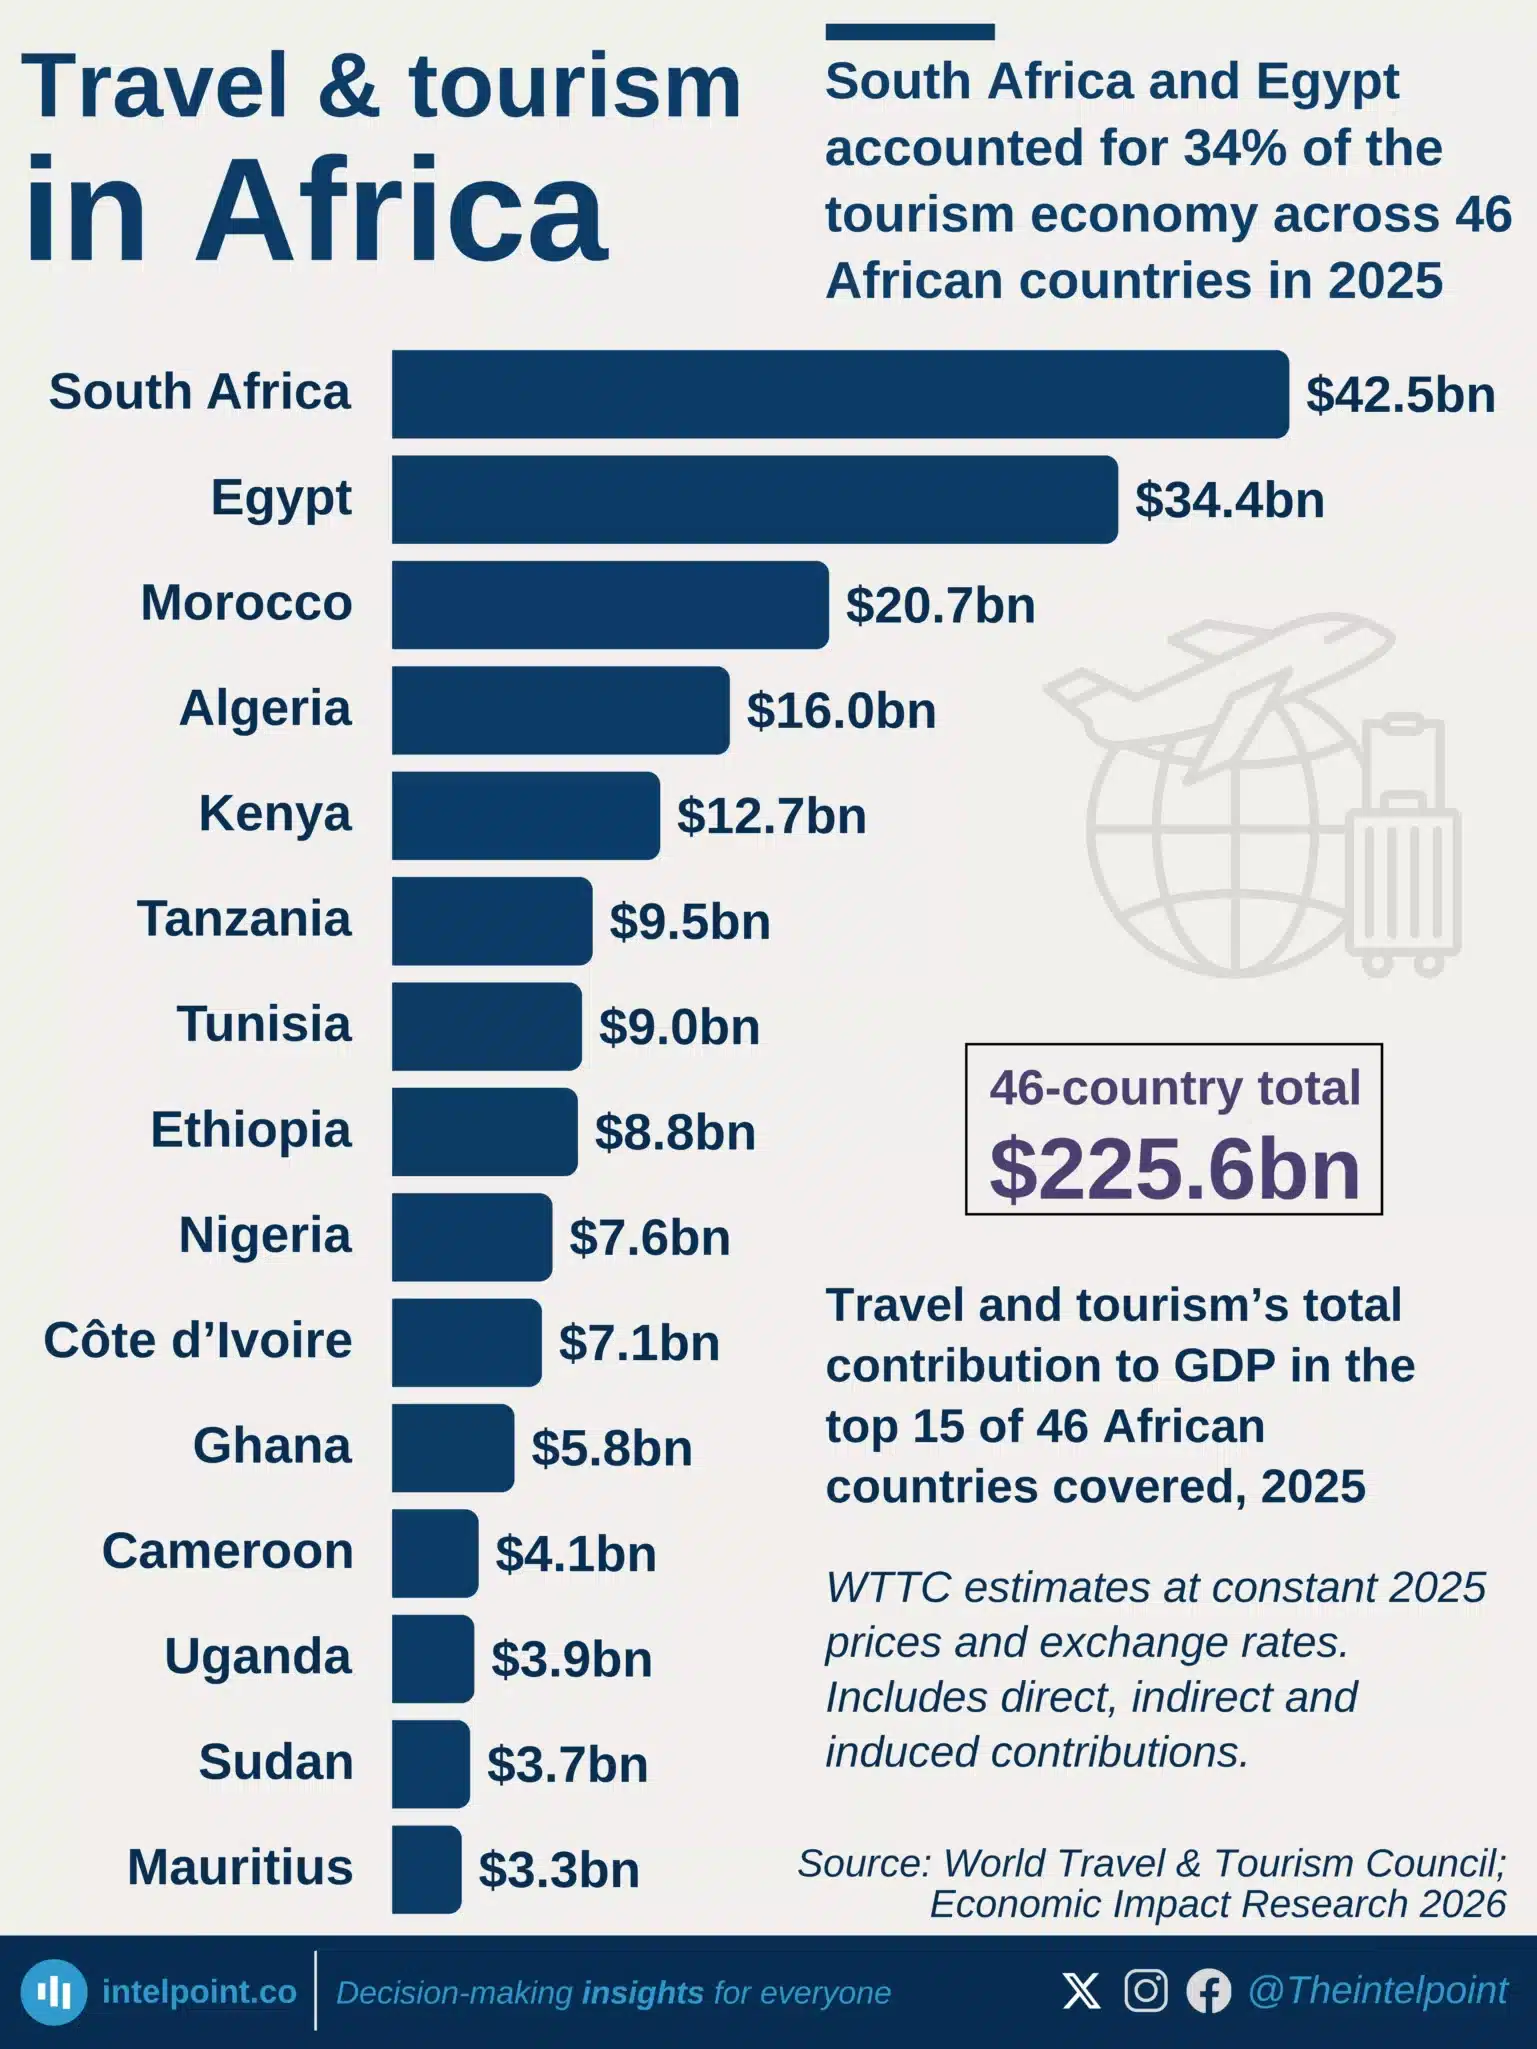
South Africa and Egypt accounted for 34% of the tourism economy across 46 African countries in 2025
  • South Africa and Egypt contributed $76.9 billion, roughly a third of the 46-country total.
  • South Africa led with $42.5 billion, followed by Egypt at $34.4 billion.
  • The top four countries accounted for slightly more than half of the $225.6 billion total.
  • Nigeria ranked ninth among the countries covered, with $7.6 billion.
  • Nigeria had the largest contribution among the West African countries included.

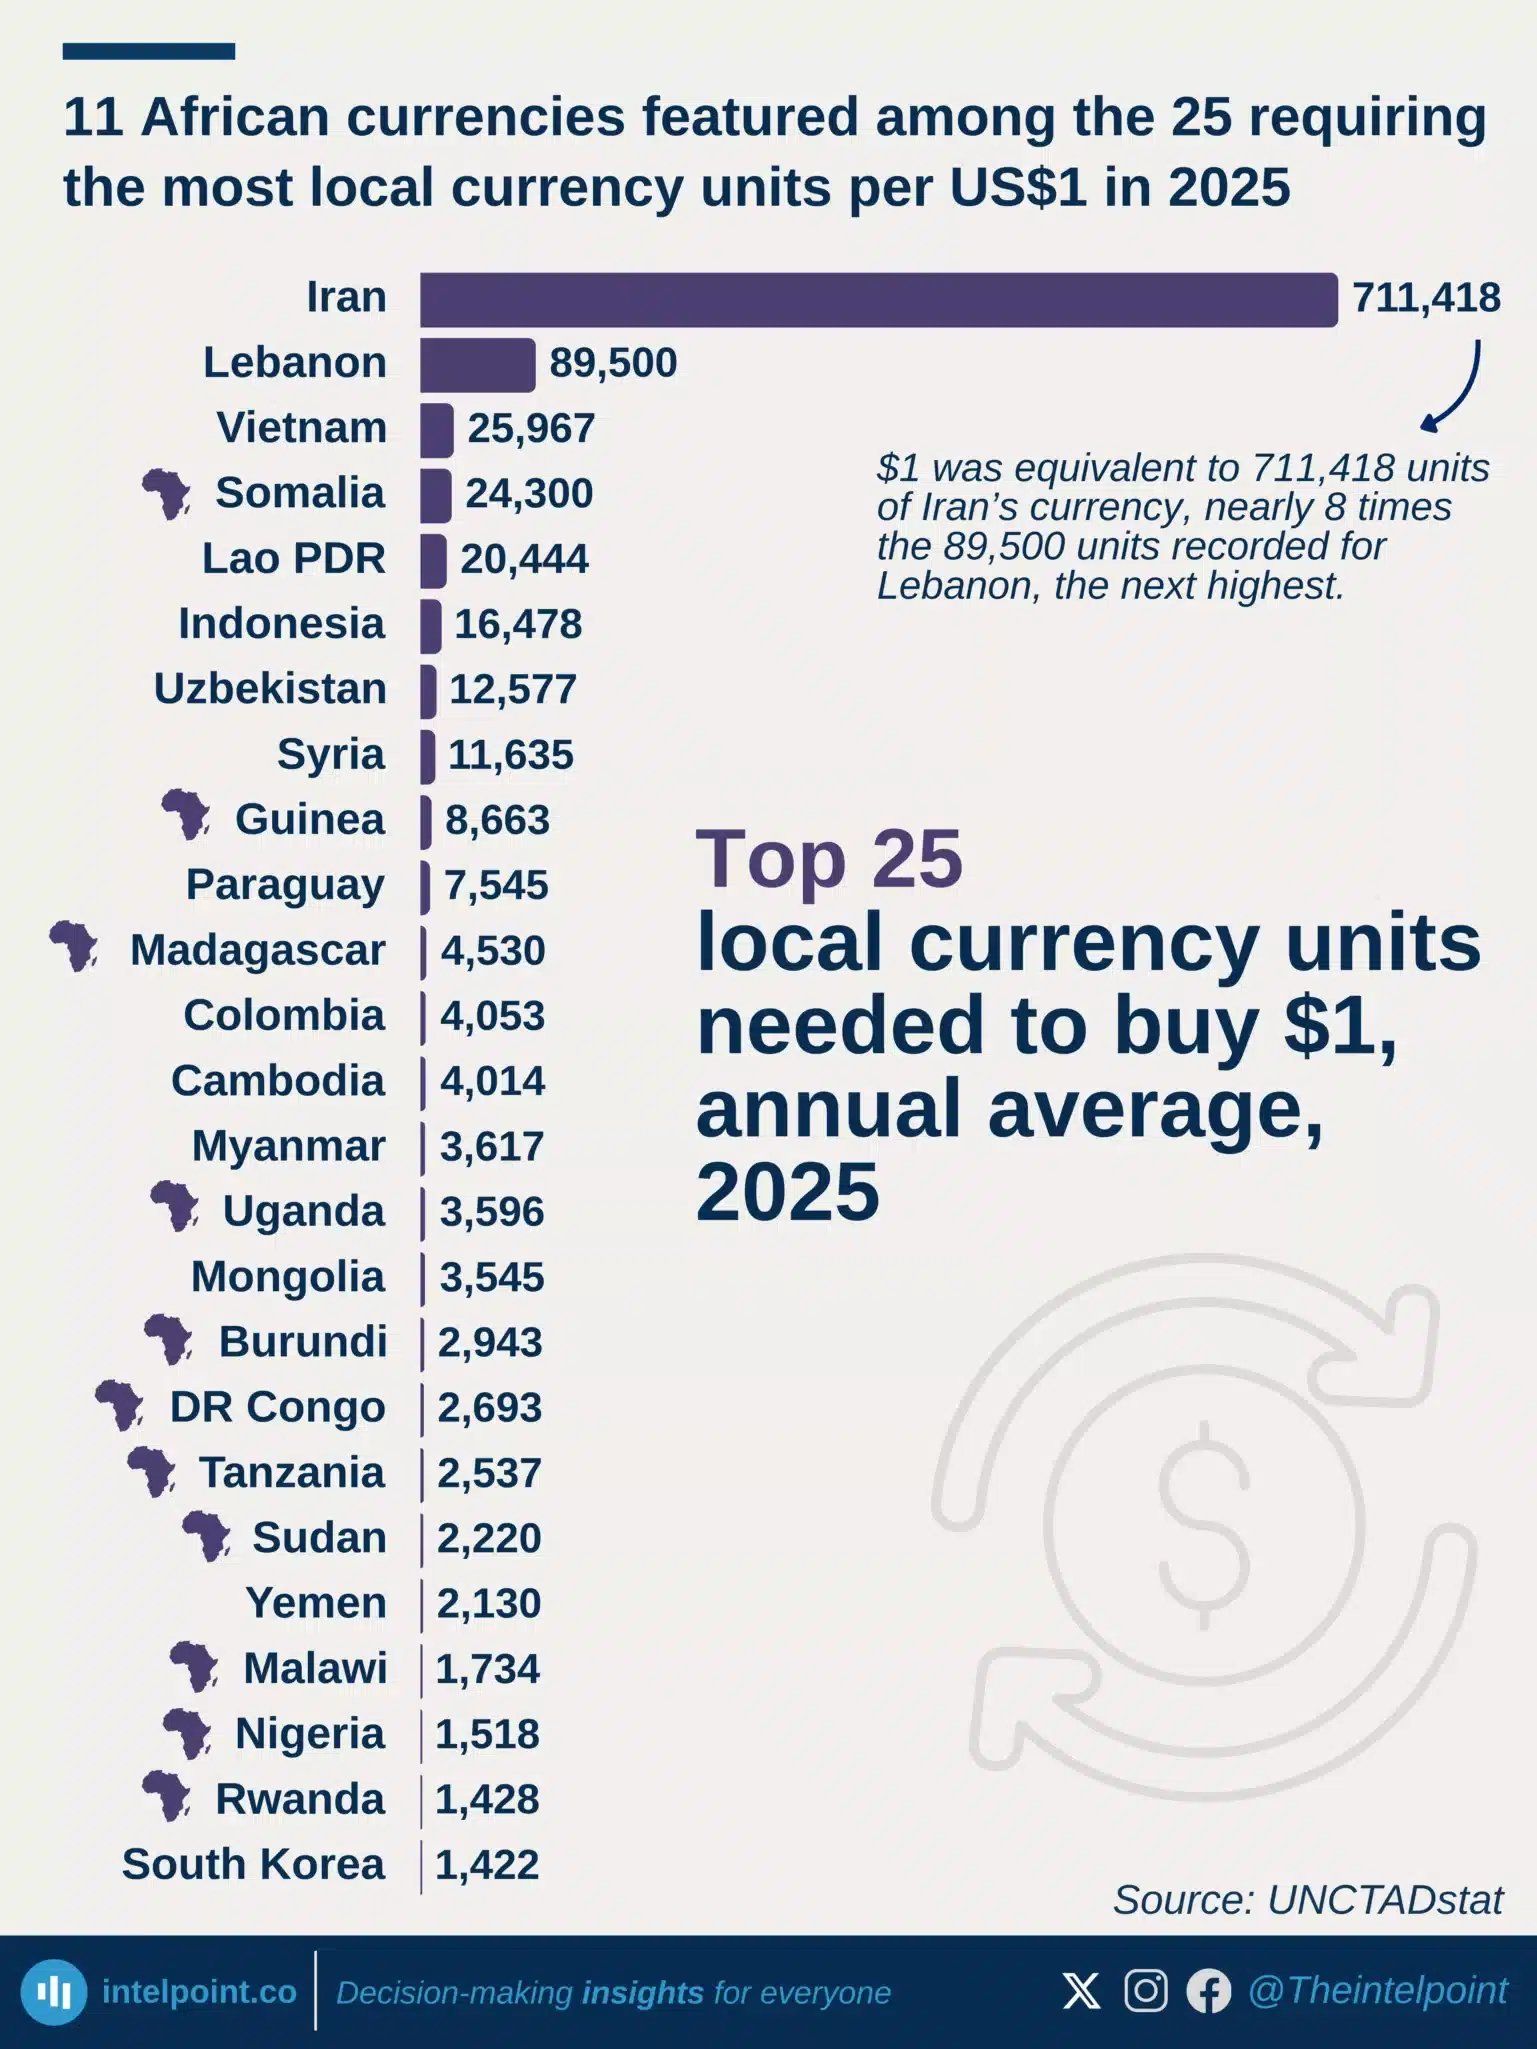
11 African currencies featured among the 25 requiring the most local currency units per US$1 in 2025
  • 11 African currencies featured among the 25 listed.
  • Somalia had the highest exchange rate among the African currencies highlighted, at 24,300 shillings per US$1.
  • Nigeria’s naira averaged ₦1,518 per US$1 in 2025.
  • 7 of the 11 African countries were in Eastern Africa, based on the UN M49 subregional classification.
  • Iran was the global outlier, averaging 711,418 rials per US$1, nearly eight times Lebanon’s 89,500.

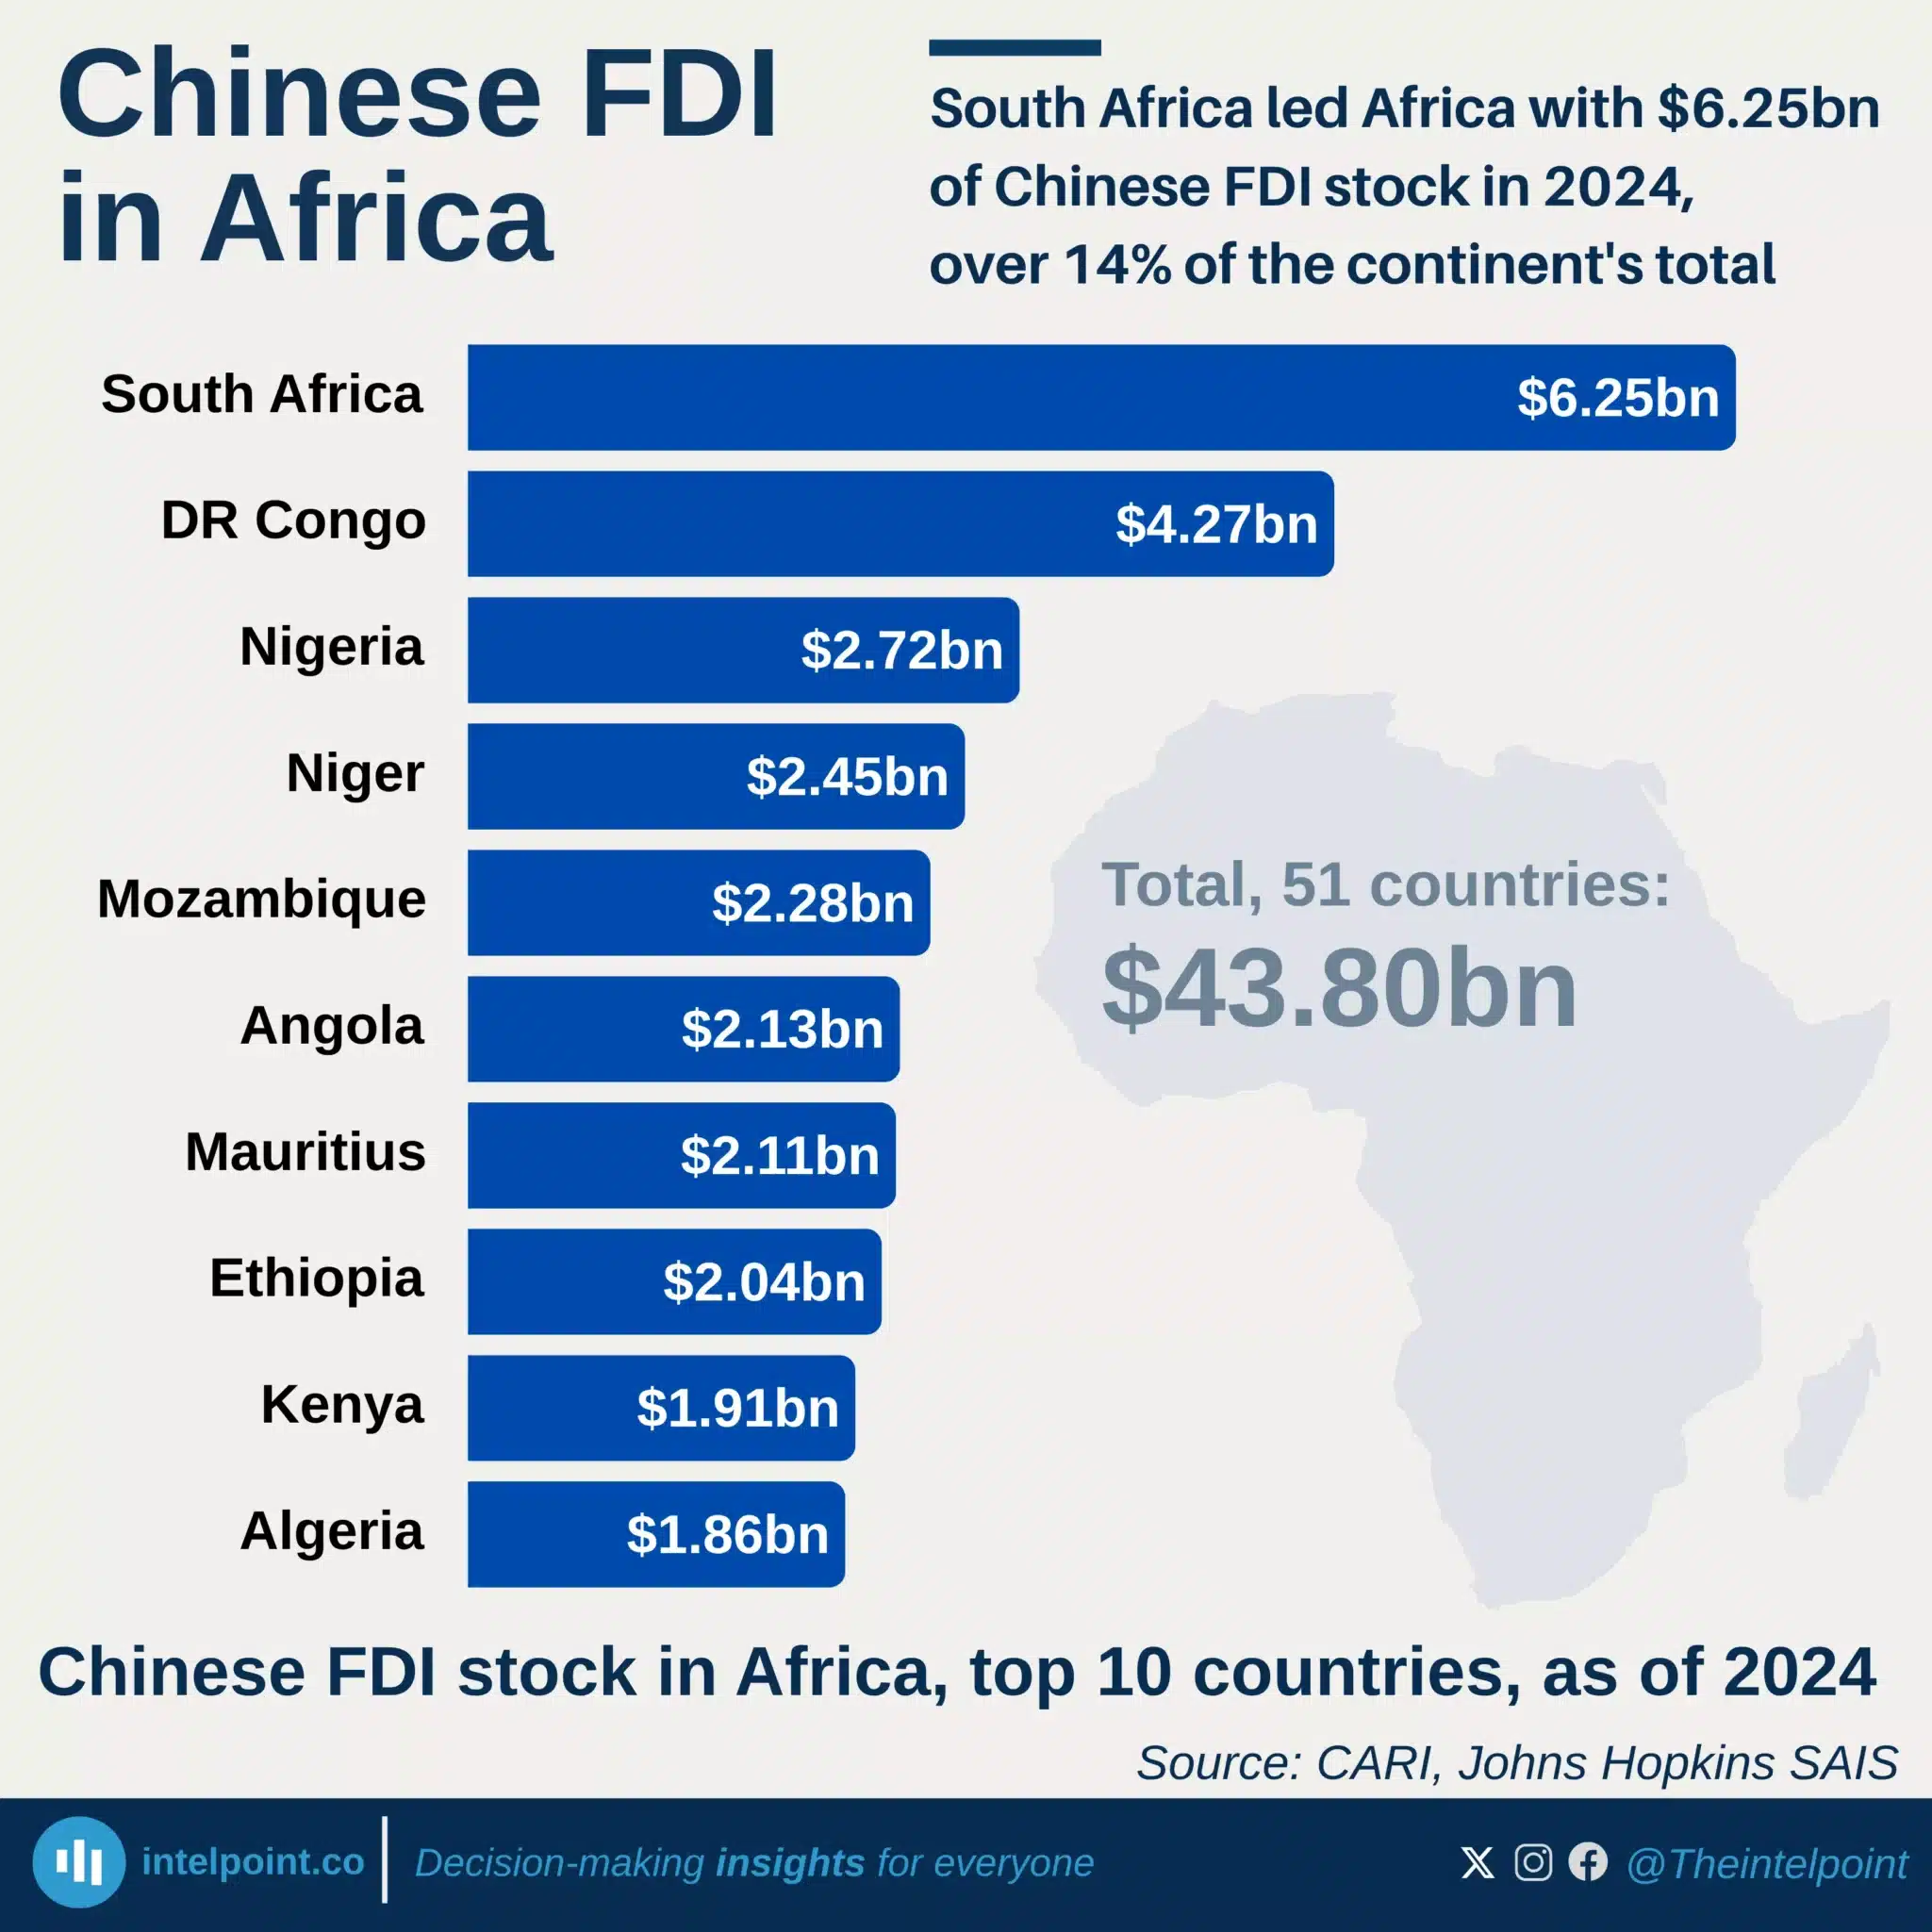
South Africa led Africa with $6.25bn of Chinese FDI stock in 2024, over 14% of the continent's total
  • South Africa held the largest Chinese FDI stock in Africa at $6.25 billion in 2024.
  • South Africa, DR Congo and Nigeria held 30% of Africa’s Chinese FDI stock.
  • The top 10 countries accounted for 64% of the continent’s total Chinese FDI stock.
  • Niger led the remaining top 10 countries with $2.45 billion, followed by Mozambique at $2.28 billion.

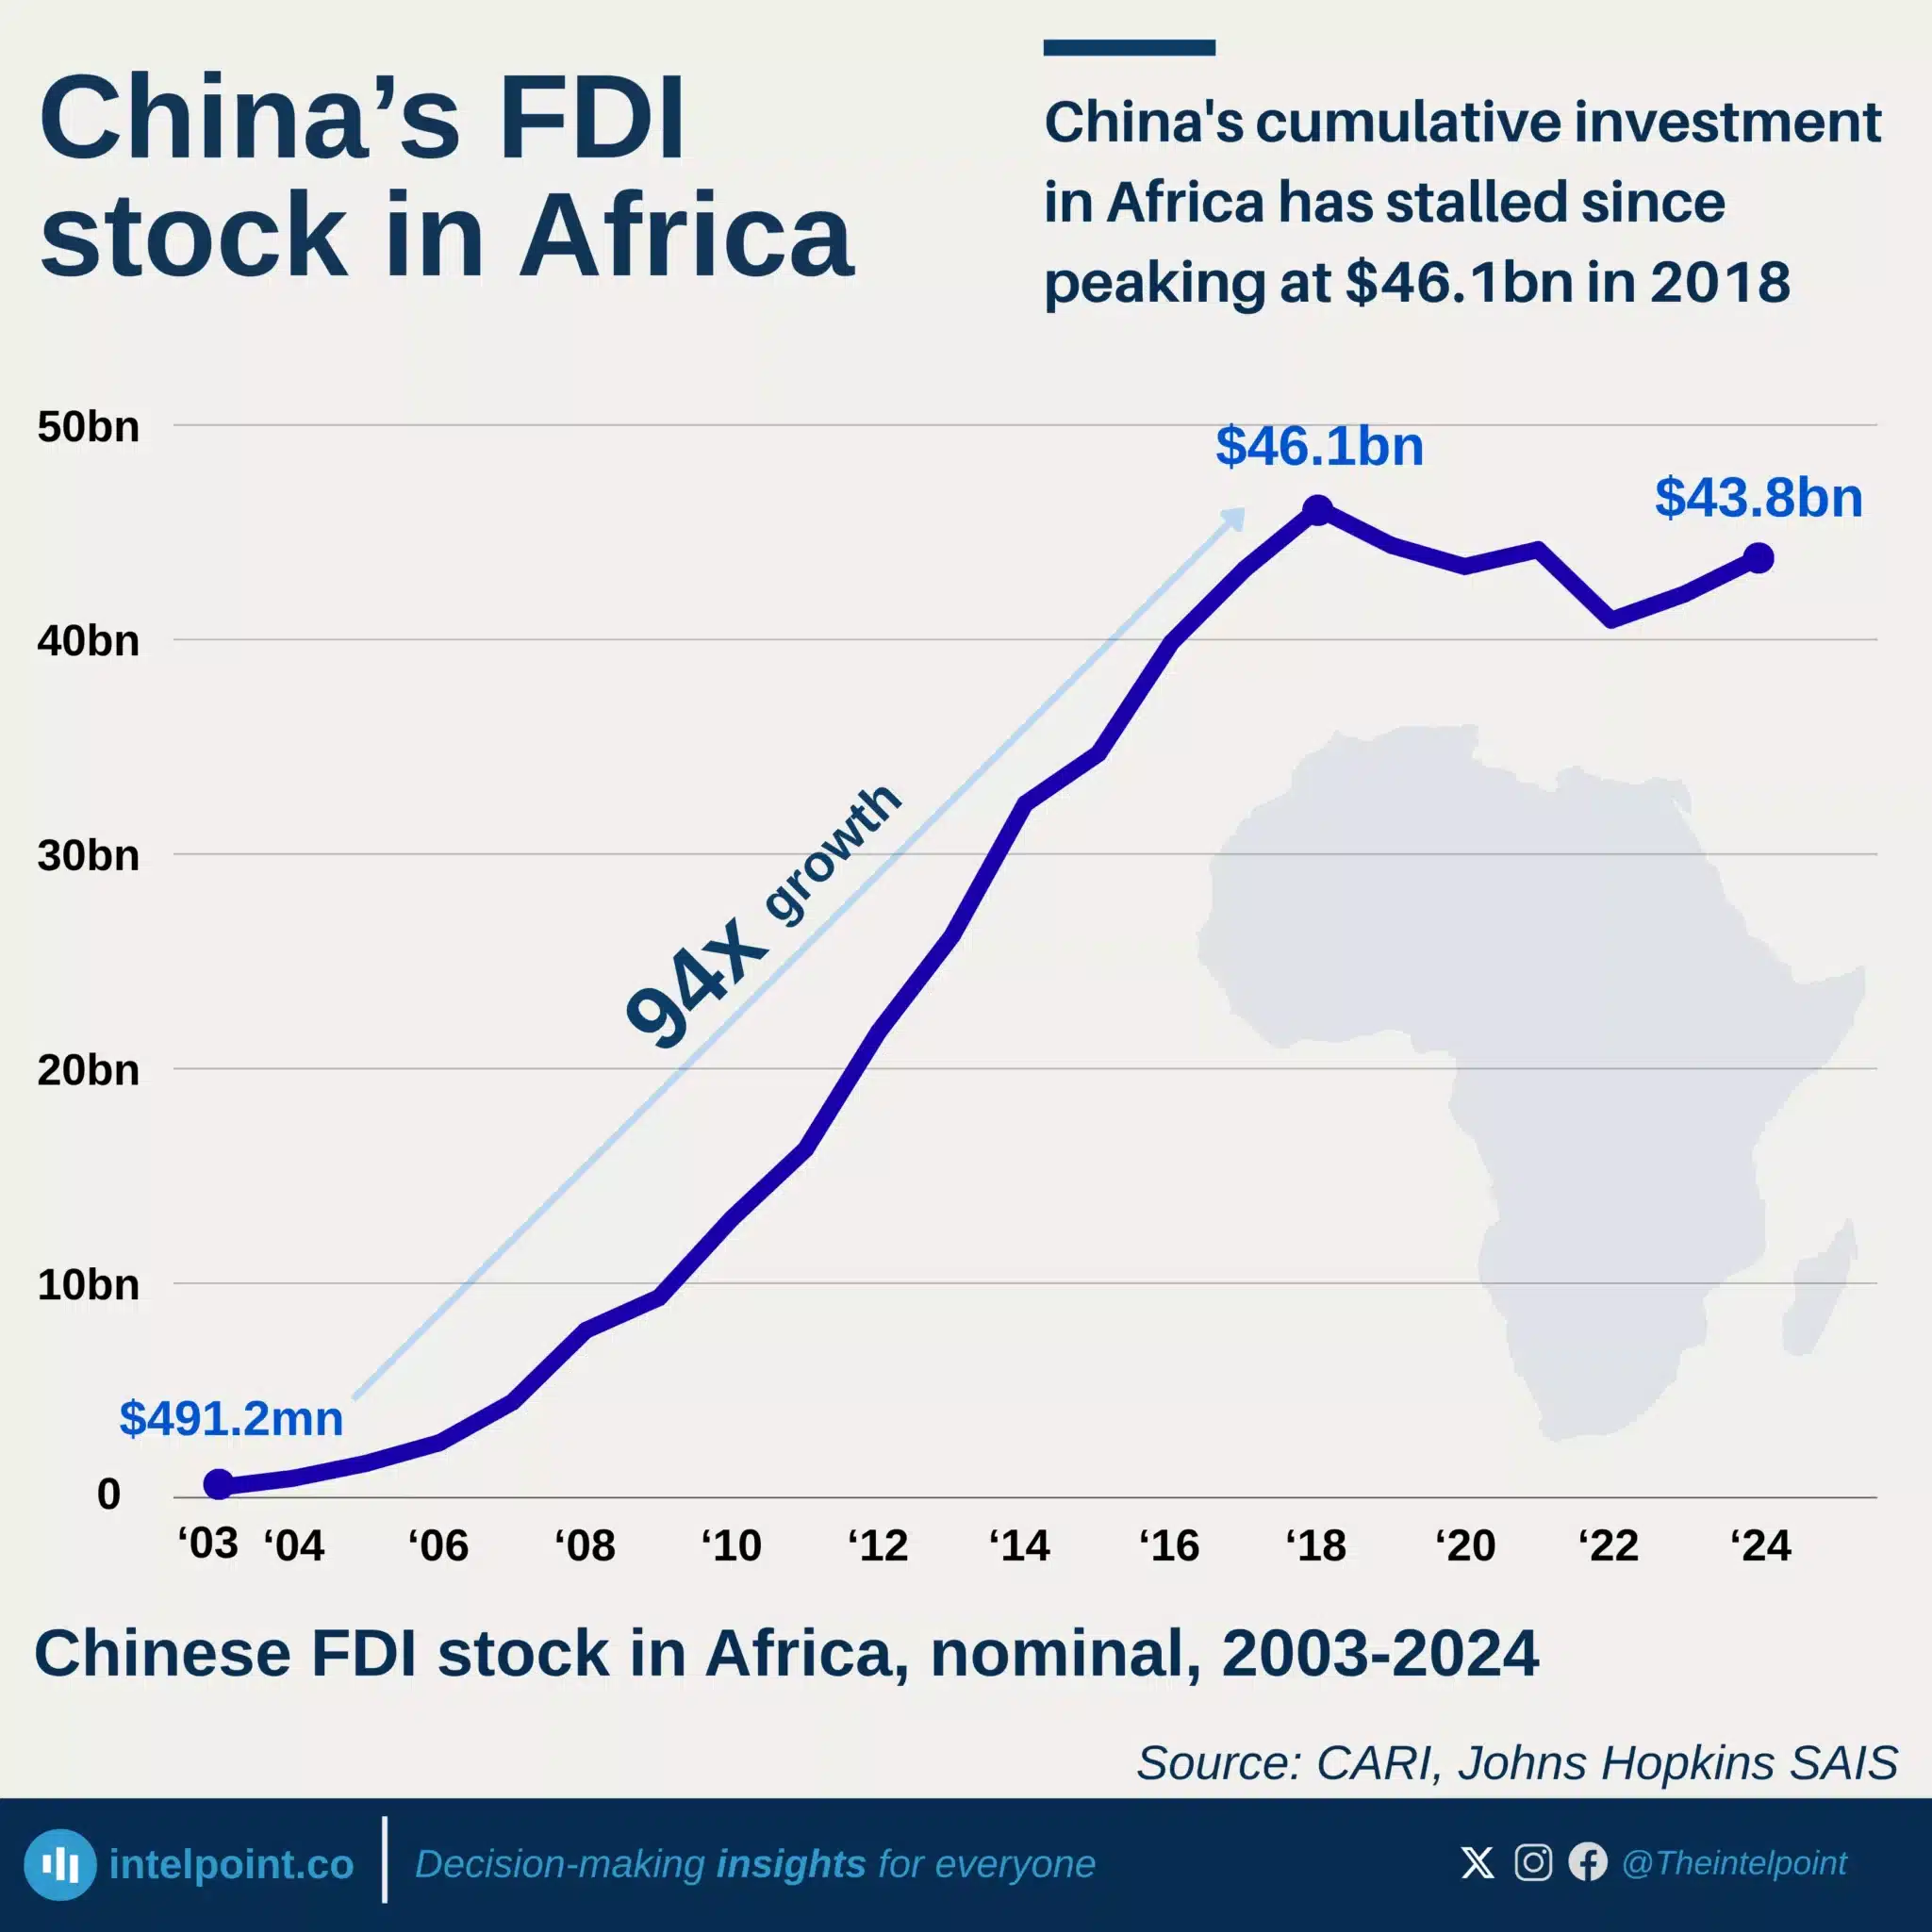
China's cumulative investment in Africa has stalled since peaking at $46.1bn in 2018
  • China's FDI stock in Africa rose 94-fold, from $491 million in 2003 to $46.1 billion in 2018.
  • By 2024, the stock had recovered to $43.8 billion, still 5% below its 2018 peak.
  • Africa accounted for just 1.4% of China's $3.14 trillion global FDI stock in 2024.
  • Nigeria's Chinese FDI stock fell from a 2017 peak of $2.86 billion to $2.72 billion in 2024.
  • African countries recorded a net $2.31 billion decline in Chinese FDI stock between 2018 and 2024.
  • Niger recorded the largest increase, from $758 million in 2018 to $2.45 billion in 2024.
  • Zambia recorded the largest decline, from $3.52 billion in 2018 to $1.70 billion in 2024.

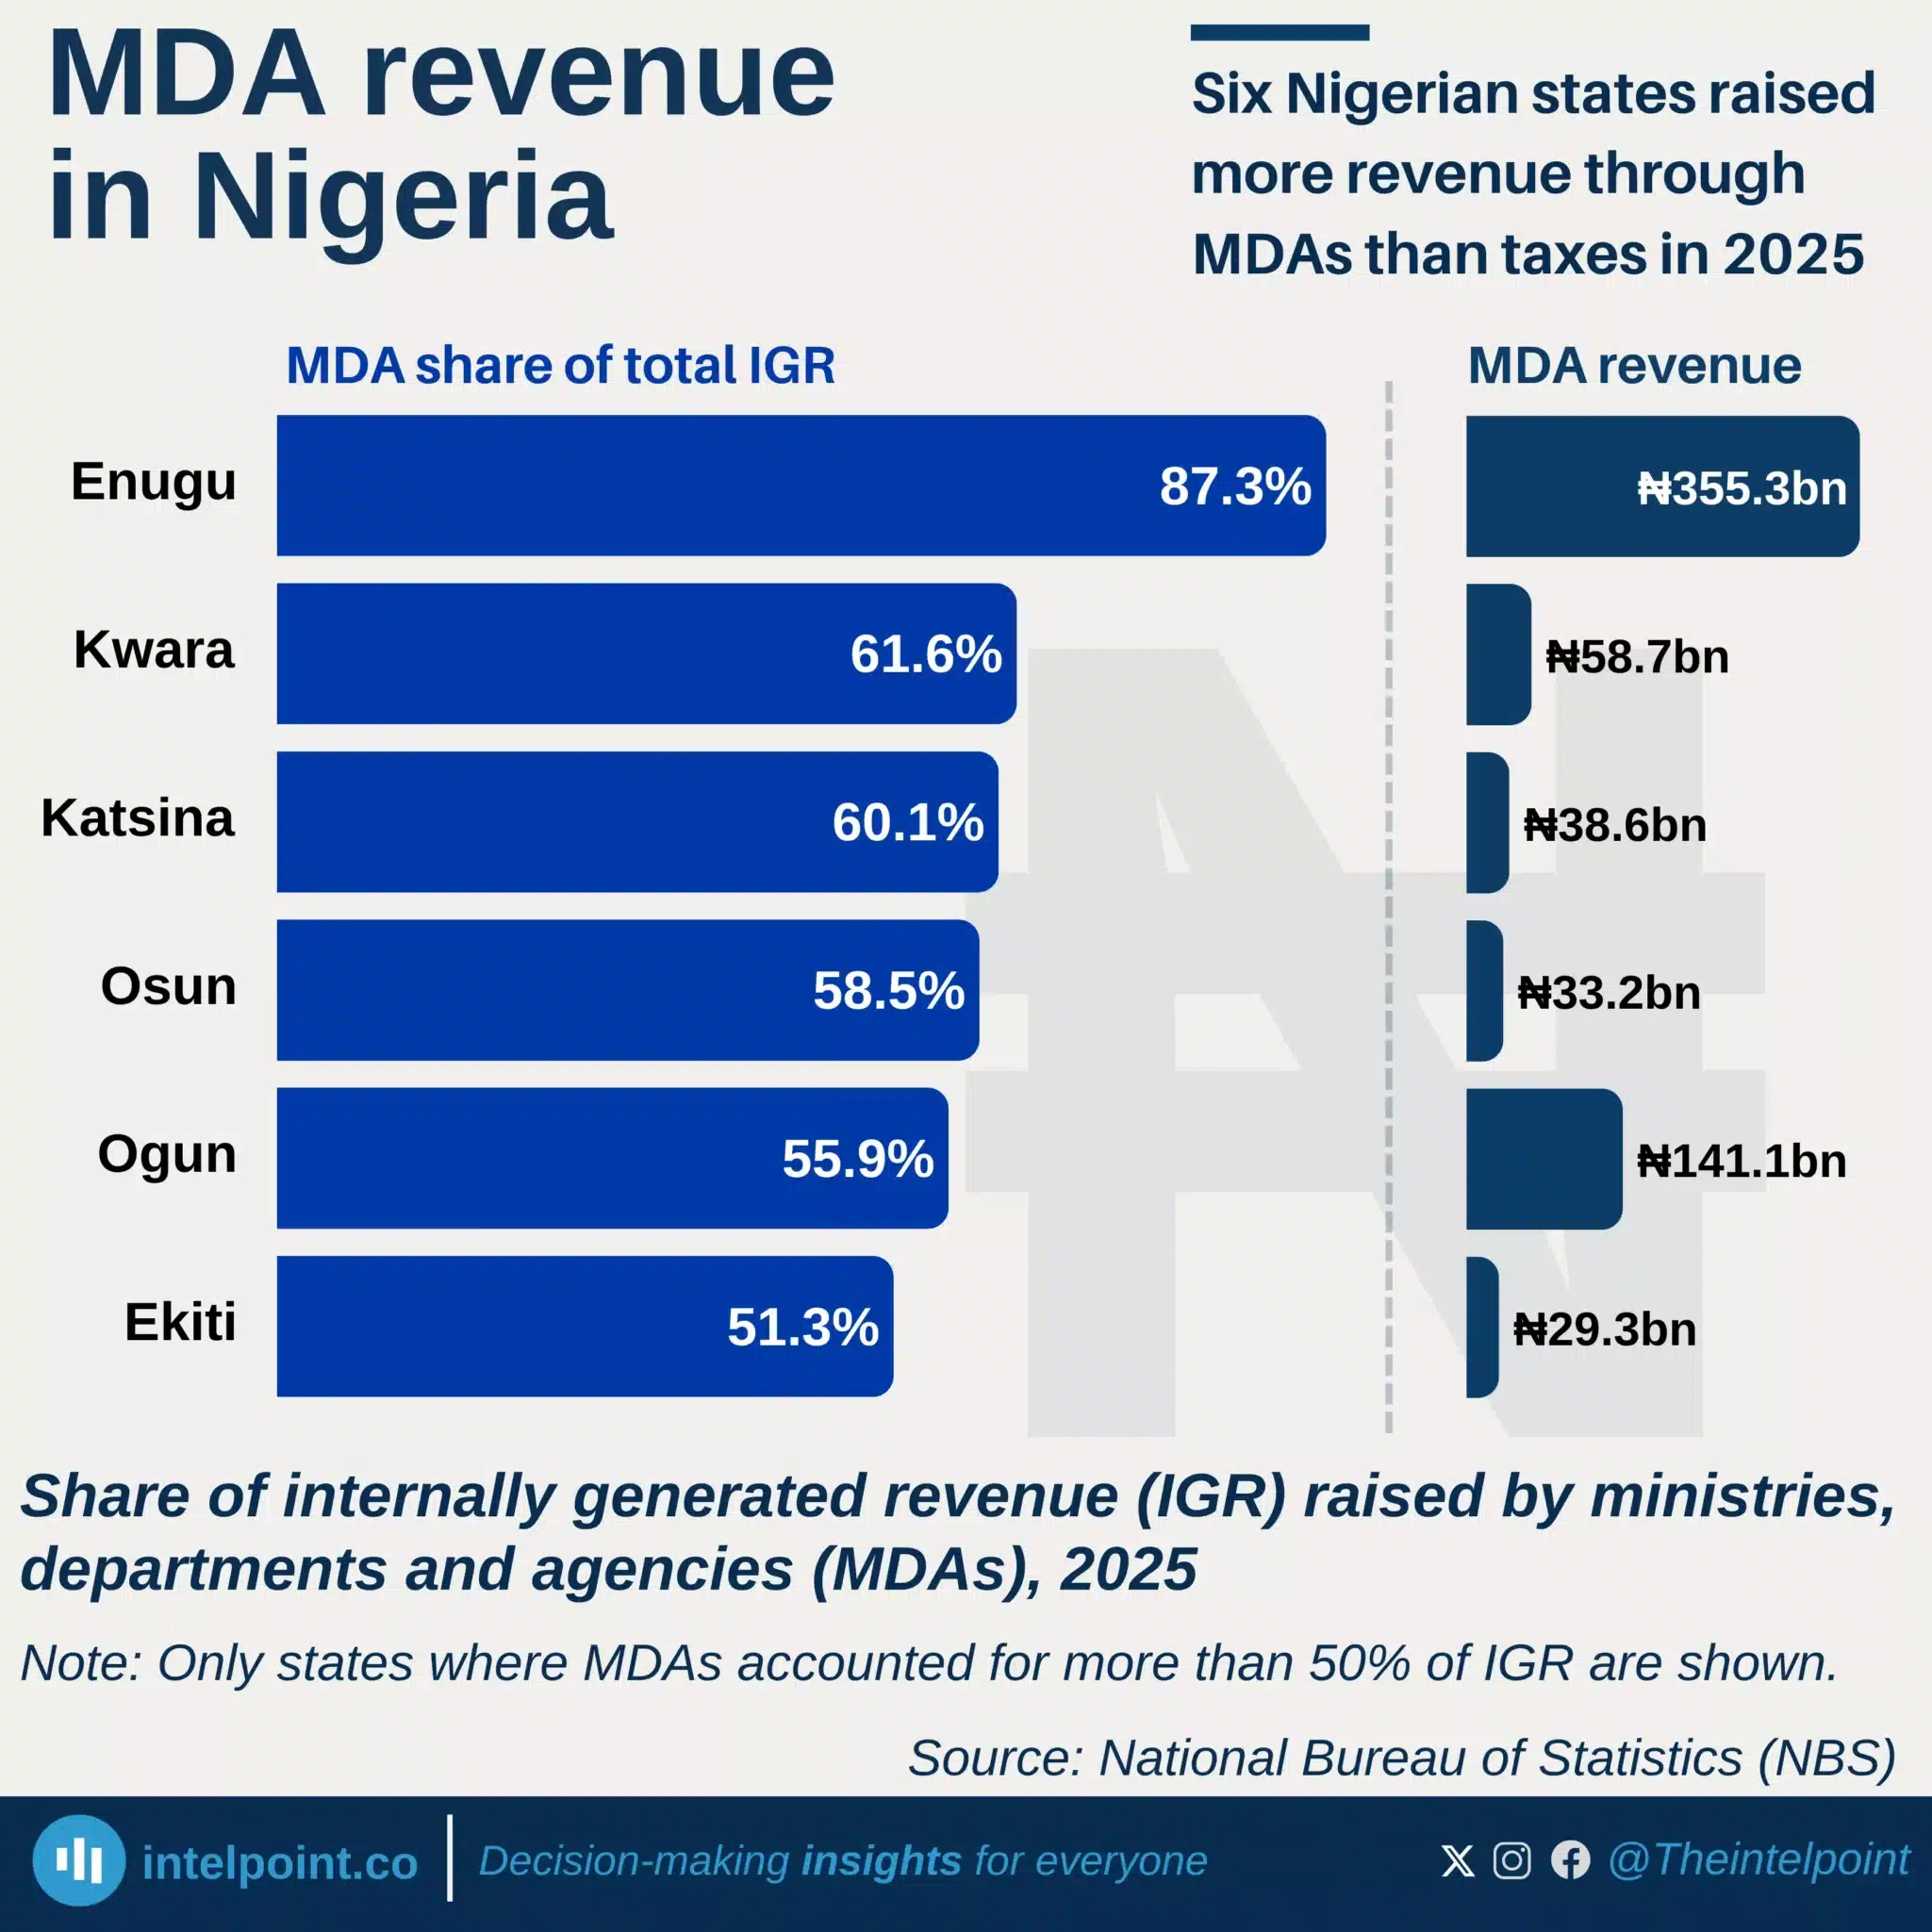
Six Nigerian states raised more revenue through MDAs than taxes in 2025
  • Six states generated about ₦656 billion through MDAs in 2025, nearly half of all MDA revenue.
  • The number of states where MDAs accounted for over half of IGR fell from seven in 2024 to six in 2025.
  • Enugu’s MDA share rose from 82.9% in 2024 to 87.3% in 2025, widening its lead.
  • Kwara, Katsina and Osun recorded MDA shares of 61.6%, 60.1% and 58.5%, respectively.

POPULAR TOPICS
SIGN UP TO OUR NEWSLETTER
Get periodic updates about the African startup space, access to our reports, among others.
Subscribe Here
Subscription Form

A product of Techpoint Africa. All rights reserved