After its peak ($8.9b) in 2011, Nigeria's FDI declined almost every year to its lowest ($780m) in 2018, a 91% decline

Key Takeaways

  • FDI inflows peaked in 2011 at $8.91 billion, the highest in the 35-year period.
  • Between 2005 and 2012, Nigeria saw a sustained boom in FDI, with seven consecutive years above $4 billion.
  • In 2018, Nigeria recorded its lowest FDI inflow in decades at just $0.78 billion.
  • By 2024, FDI stood at $1.08 billion, down 88% from its 2011 peak, reflecting declining investor interest or changing investment climates.

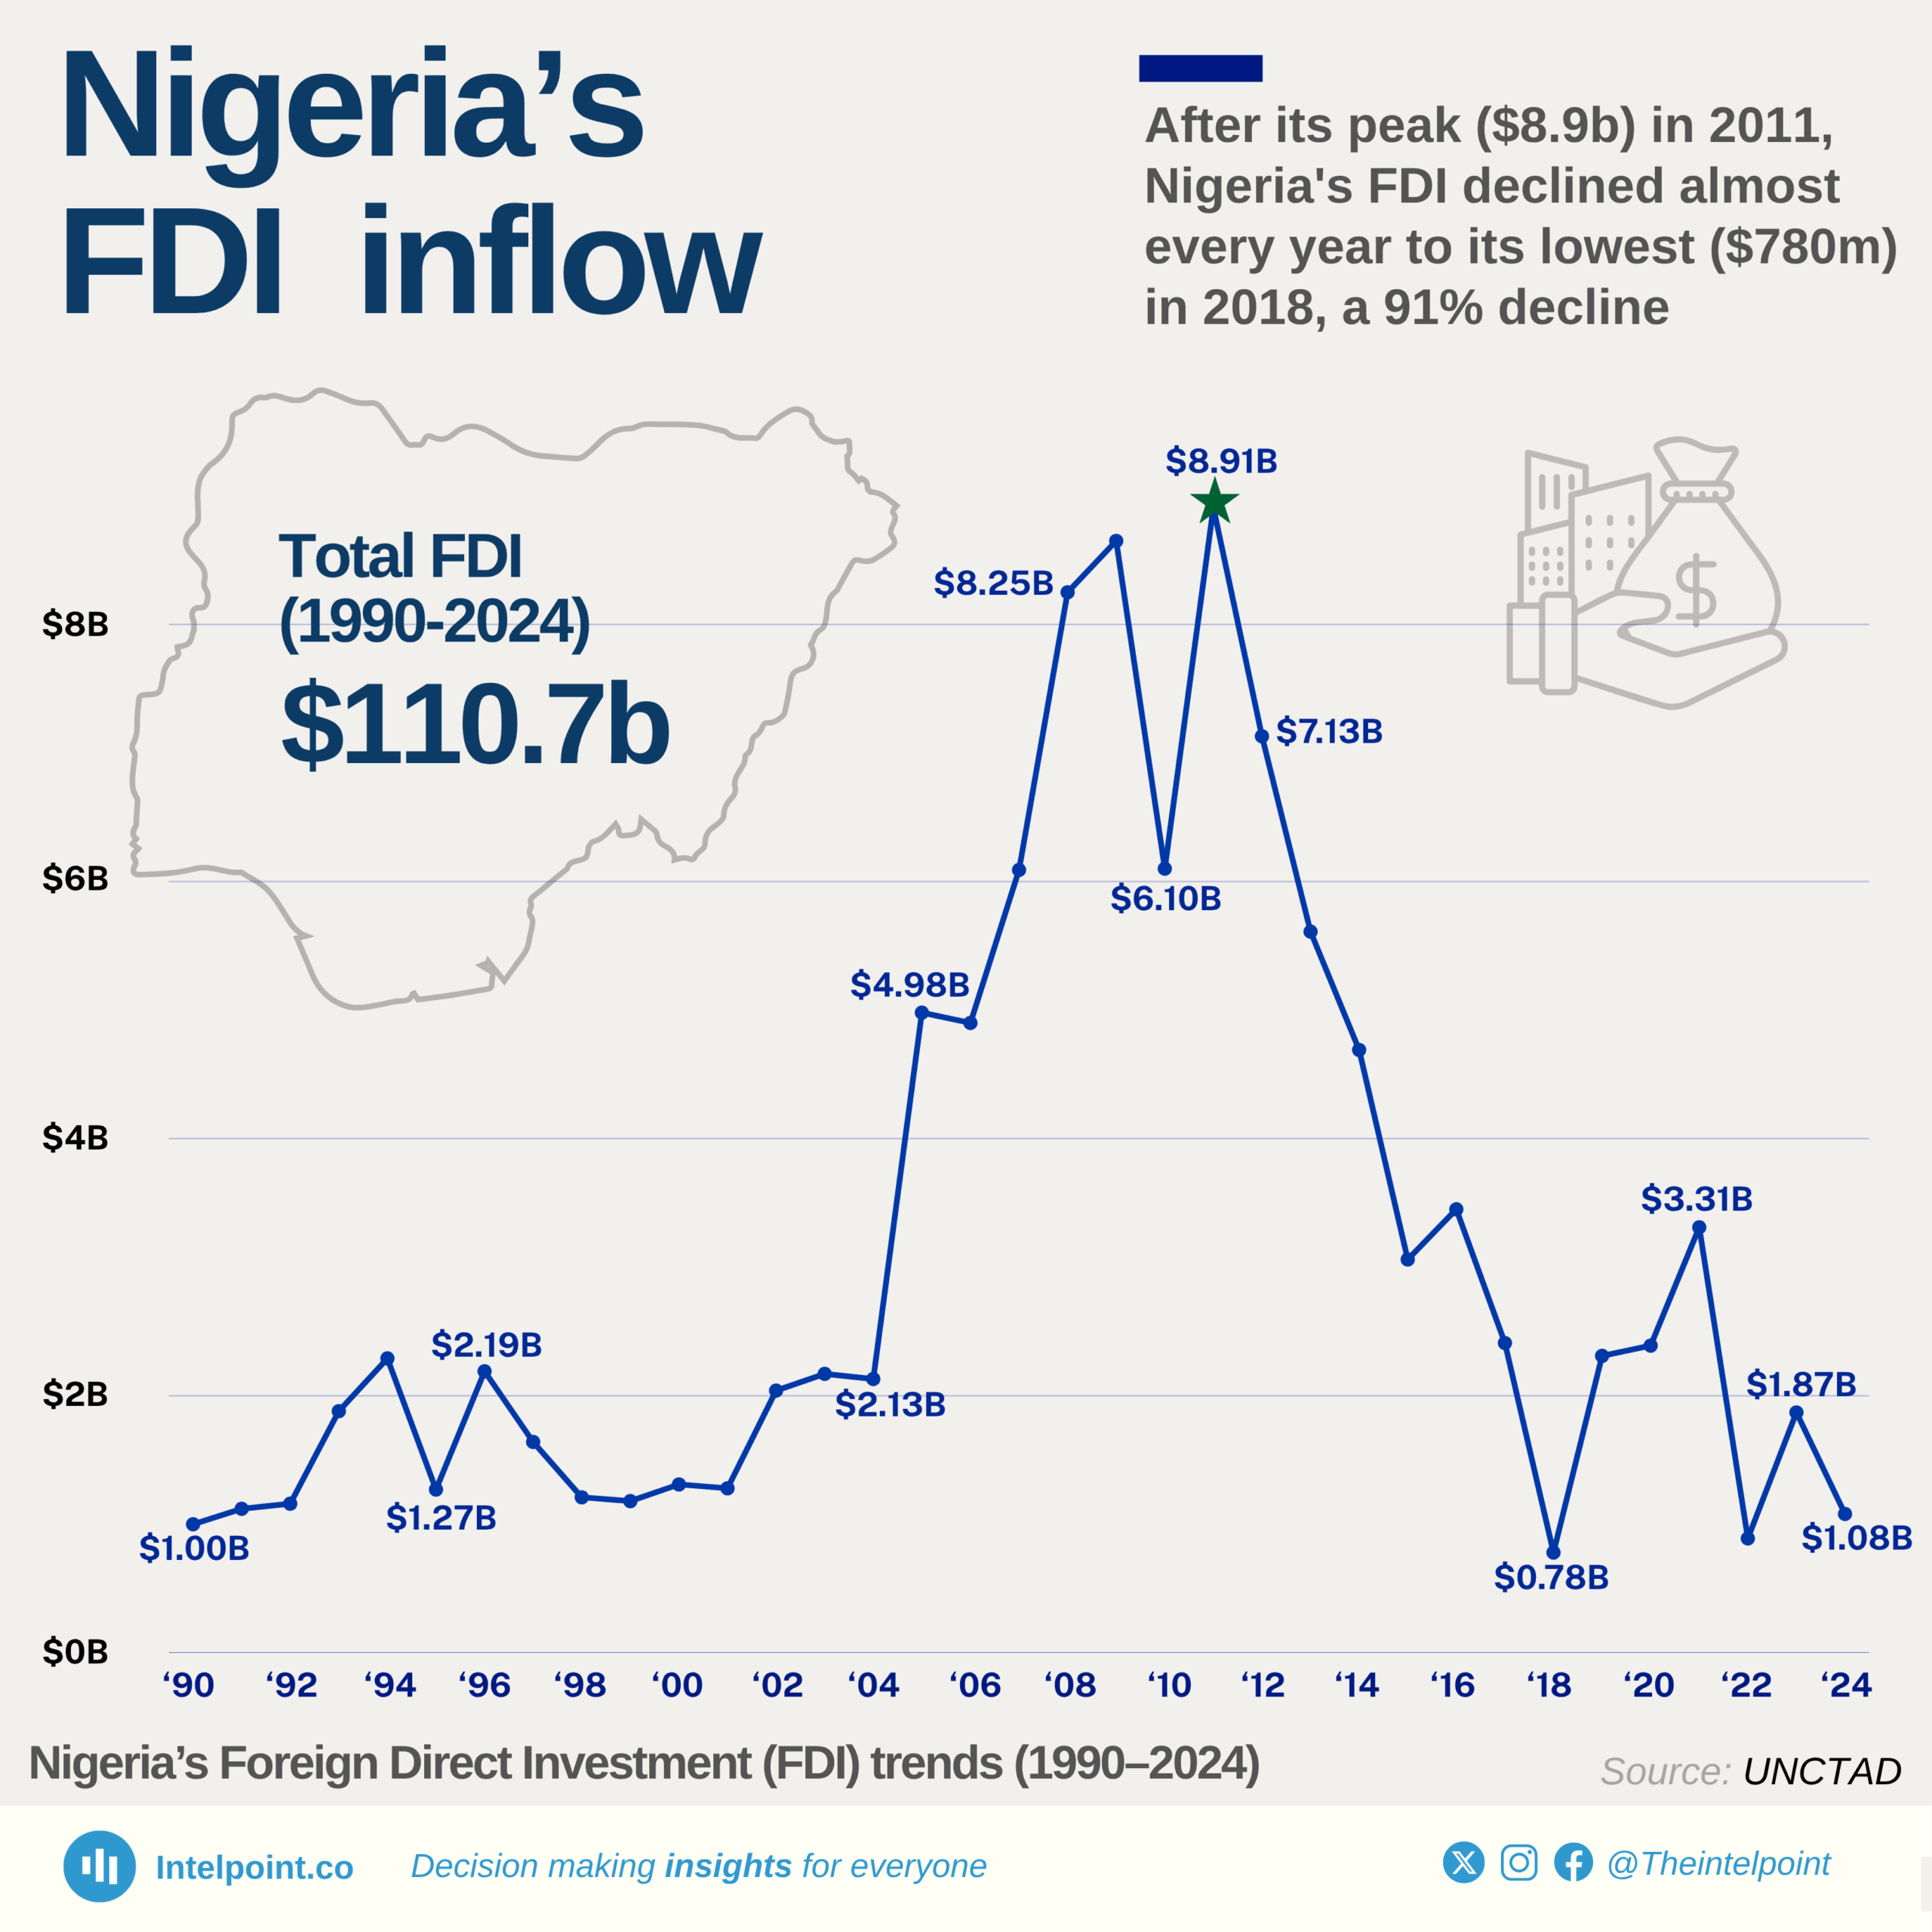
Nigeria’s Foreign Direct Investment trajectory from 1990 to 2024 paints a vivid picture of economic highs and lows. In the 1990s and early 2000s, FDI hovered around $1–2 billion. It surged in the mid-2000s, climbing rapidly to reach $8.91 billion in 2011, the country’s strongest year in attracting foreign capital. This era coincided with oil sector liberalisation and Nigeria’s re-emergence as a key frontier market.

However, post-2011, inflows began a steady decline. By 2018, FDI had dropped below $1 billion, the lowest point in decades. Although modest recoveries were seen in later years, 2024 closed at $1.08 billion, far from the highs of the previous decade.

Source:

UNCTAD

Period:

1990 - 2024
HTML code to embed chart
Want a bespoke report?
Reach out
Tags
Related Insights

Nigeria’s foreign trade
  • Total Trade Volume in Q1 2025 stood at ₦36.02 trillion, with exports totalling ₦20.6 trillion and imports at ₦15.4 trillion, resulting in a surplus of ₦5.17 trillion.
  • Crude oil dominates Nigeria’s export trade, accounting for the largest share of export revenue. -
  • Other petroleum oil products are also a major export item, reflecting the significance of both raw and refined oil-based commodities in Nigeria’s trade portfolio. -
  • On the import side, manufactured goods dominate, showing Nigeria’s continued reliance on foreign machinery, technology, and consumer goods.
  • While Nigeria exports mostly raw and oil-based products, it imports refined, processed, or industrial goods, indicating a structural trade gap and limited local industrial capacity. -
  • Agricultural and raw material goods feature on both sides of trade, but their value is significantly less than petroleum-related trade.

Nigeria's foreign trade
  • India is Nigeria’s largest export destination Nigeria exported ₦2.84 trillion worth of goods to India in Q1 2025, driven largely by crude oil.
  • China dominates imports into Nigeria China supplied ₦4.66 trillion worth of goods, far outpacing all other countries. Likely dominated by electronics, machinery, and manufactured goods.
  • The United States appears on both sides. Nigeria exports ₦1.54 trillion to the US and imports ₦1.42 trillion, showing a relatively balanced trade relationship.
  • European countries are major export Partners Netherlands (₦2.30T), France (₦1.44T), and Spain (₦1.44T) are prominent export destinations, indicating strong demand for Nigerian crude oil and other commodities in Europe.
  • UAE barely makes the import list. The UAE closes out the top import list at ₦0.61 trillion, showing relatively lower trade volume compared to others, but still significant enough to be in the top 5.

Nigeria's agric exports
  • The value of agricultural goods exported in Q1 2025 rose to ₦1.70 trillion, up 64.65% year-on-year and 10.63% quarter-on-quarter, highlighting continued growth in the sector.

  • Standard and superior cocoa beans led the chart, contributing a combined ₦1.23 trillion, with major buyers being The Netherlands (₦344.17B) and Belgium (₦203.17B).

  • Cashew nuts in shell earned ₦157.63B, mostly exported to India (₦87.56B) and Vietnam (₦69.74B). Sesamum seeds brought in ₦128.18B.

  • Soya bean flours and ornamental flowers fetched ₦27B and ₦18B respectively, showing Nigeria's export mix is broadening.


Cars lead in road traffic crashes, while luxury bus accidents surge by 466.7% over four years
  • Cars were involved in the highest number of road accidents, recording 665 cases over the four-year period.
  • Luxury buses and bicycles recorded the highest quarter-on-quarter (QoQ) growth in accident involvement.
  • Tankers, cars, and motorcycles saw the sharpest QoQ declines, with accident rates falling by 47.2%, 30.6%, and 24.7% respectively.

42% of Nigeria’s applications have been rejected over the past 15 years amidst surging demand for Schengen visas
  • Nigerians submitted 1.1 million Schengen visa applications between 2009 and 2024.
  • The highest rejection rates occurred in 2017 (53%) and 2019 (51%).
  • A total of 491,844 applications were rejected, a cumulative denial rate of 42.1%.
  • Despite post-pandemic recovery, 2024 recorded the highest applications (111k), with a 45% rejection rate.
  • The year 2010 stands out as the period with the least number of Schengen visa applications submitted by the Nigerian consulate.

Nearly 30% of road accidents recorded in Nigeria between Q3 2020 and Q3 2024 occurred in FCT, Ogun, and Nasarawa
  • FCT, Ogun, and Nasarawa consistently rank as the top three states with the highest number of road accidents.

  • The FCT recorded its peak accident figures in 2022, particularly in Q2 (842 cases) and Q4 (864 cases).

  • In Q2 and Q3 of 2024, Ogun State surpassed the FCT in the number of reported accidents.

  • Across these three states, there has been a notable decline in accident numbers, with an average decrease of approximately 37.6% between Q2 and Q3 2024.


POPULAR TOPICS
SIGN UP TO OUR NEWSLETTER
Get periodic updates about the African startup space, access to our reports, among others.
Subscribe Here
Subscription Form

A product of Techpoint Africa. All rights reserved