9mobile's subscriber base declined from a peak of 23.5 million in September 2015 to less than 3 million by April 2025, representing an 87.4% loss

Key takeaways:

  • In September 2015, 9mobile had a peak subscriber base of 23.49 million.
  • After reaching that peak, its subscriber base fell steadily in late 2015.
  • The most drastic reduction happened between February and April 2024, with nearly 5 million customers lost in just three months.
  • 9mobile has lost more than 20 million customers since its peak in September 2015.
  • More than 10 million subscribers were lost between January and April 2025 (>78%).
  • 9mobile customers increased significantly until 2015, then steadily declined, with a steep reduction after 2023.
  • The subscriber base was mostly steady from January 2020 to February 2024.

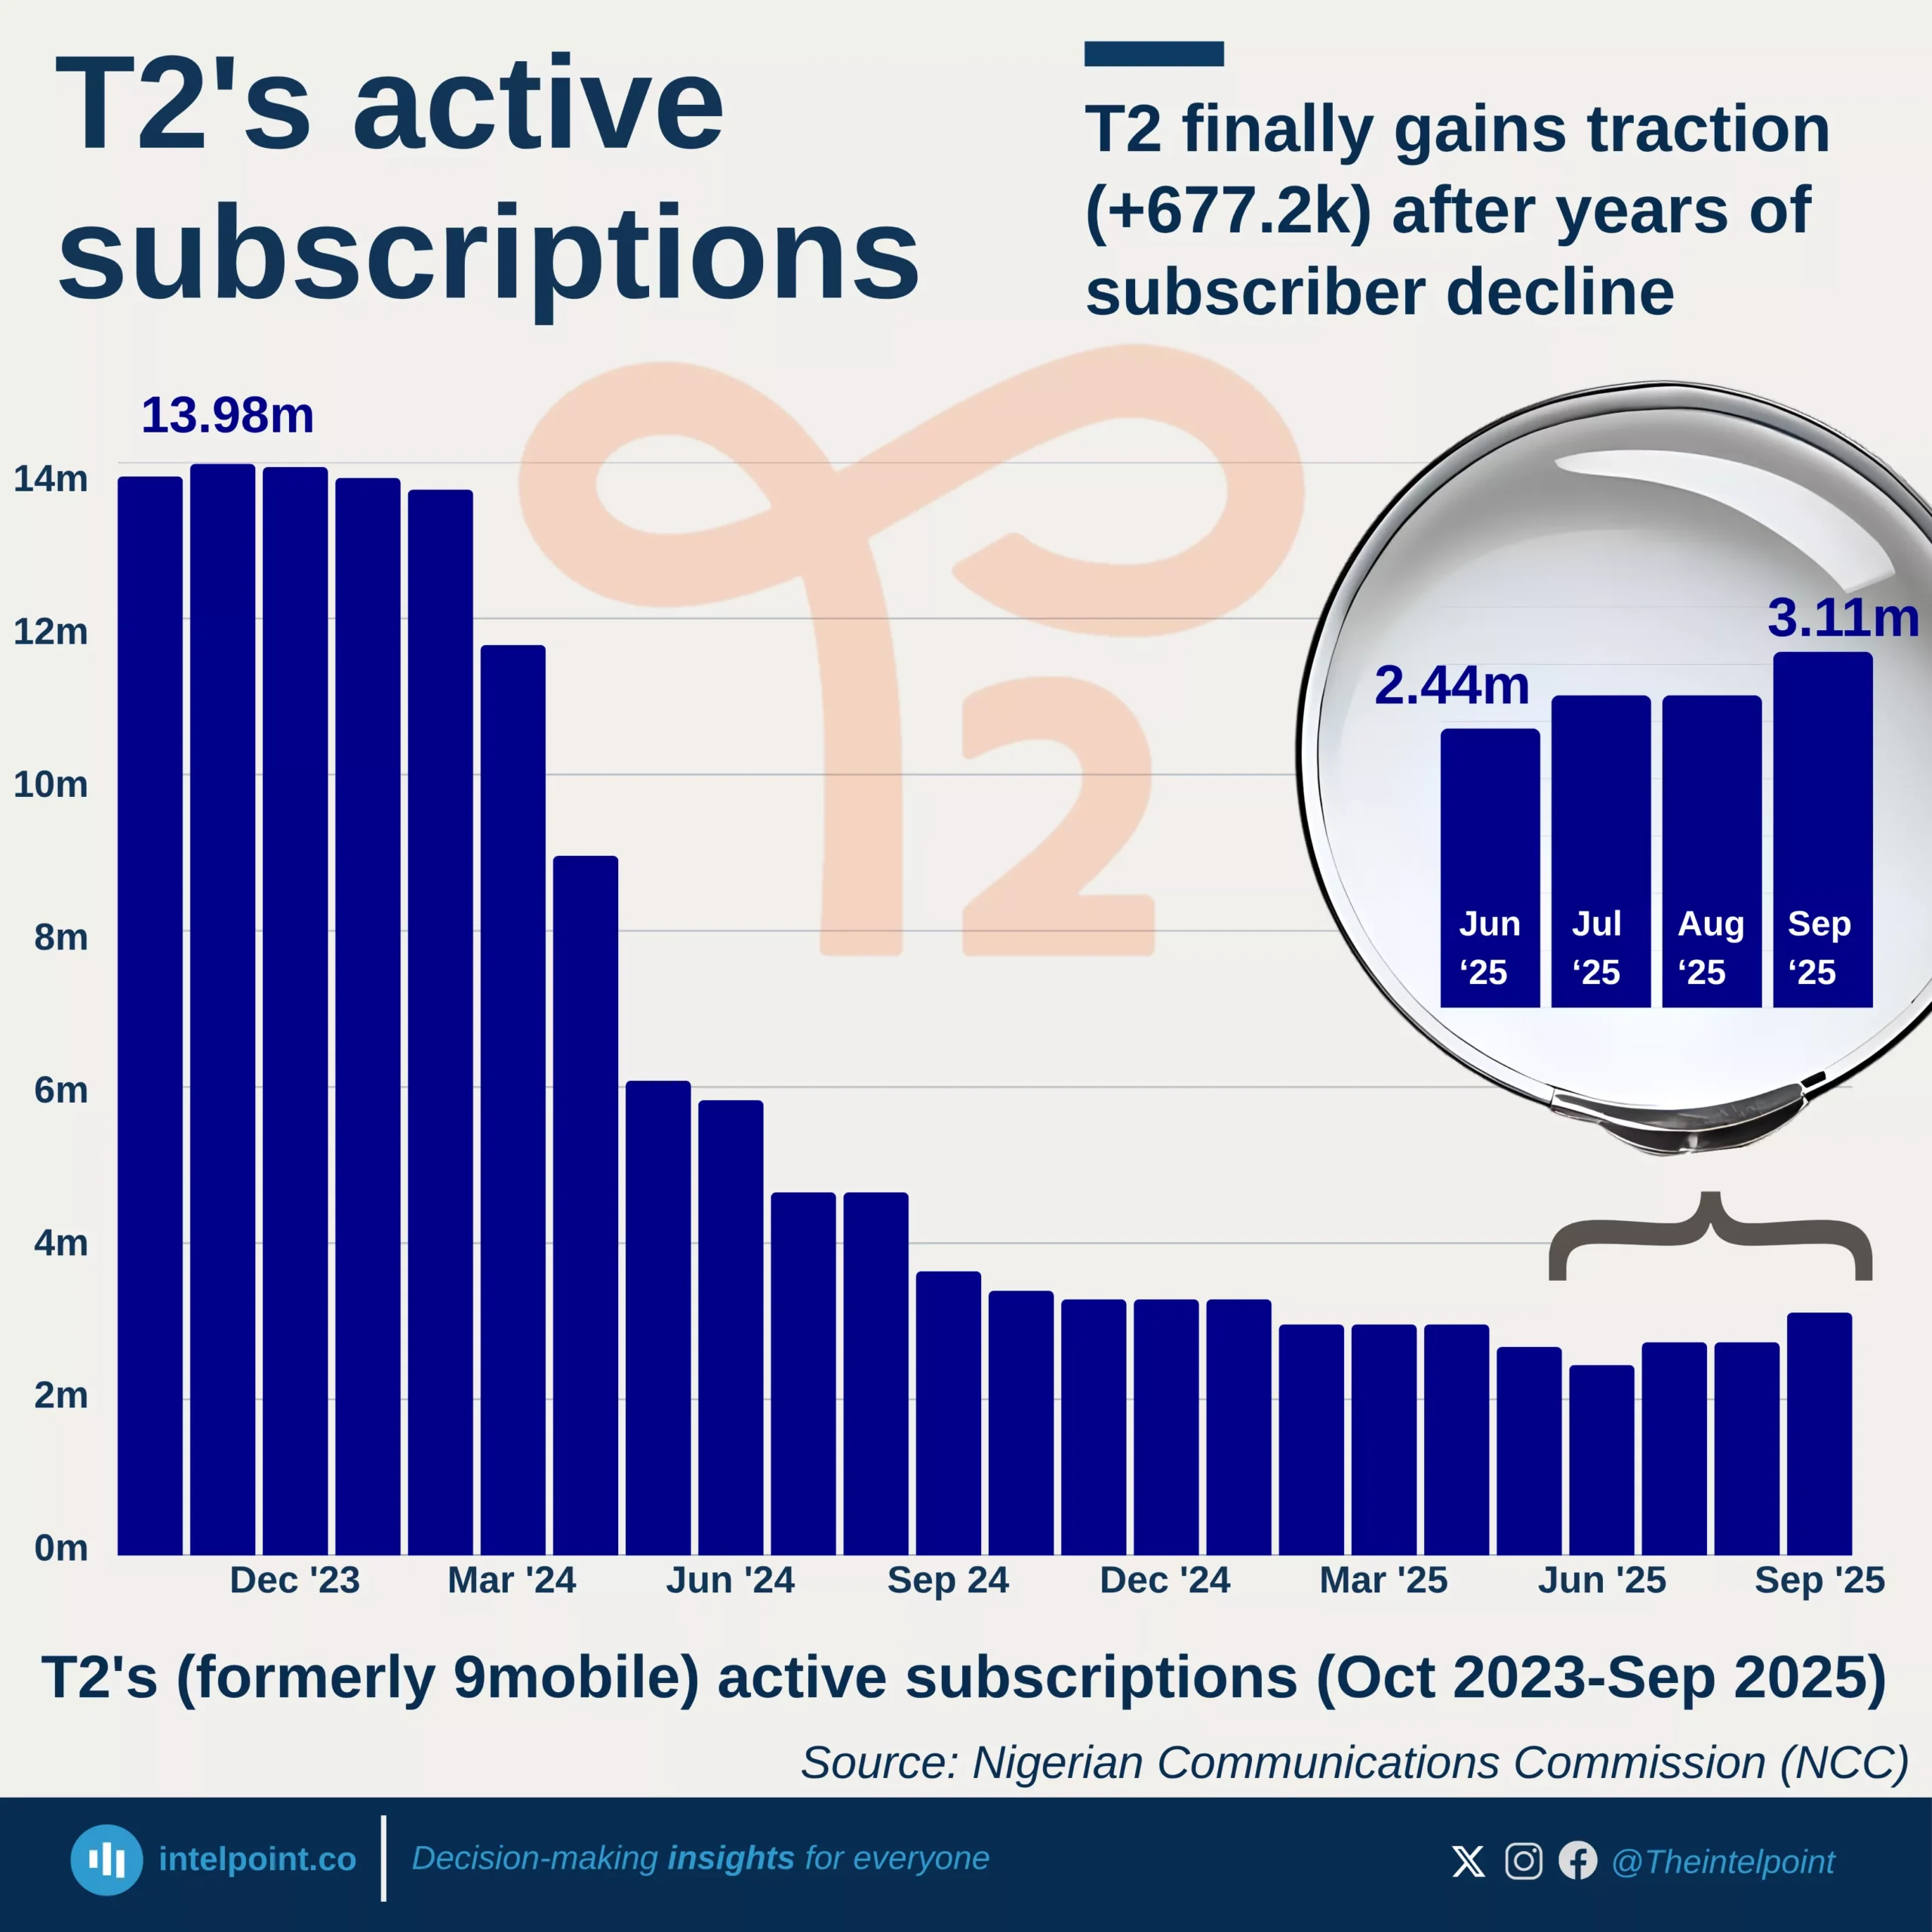
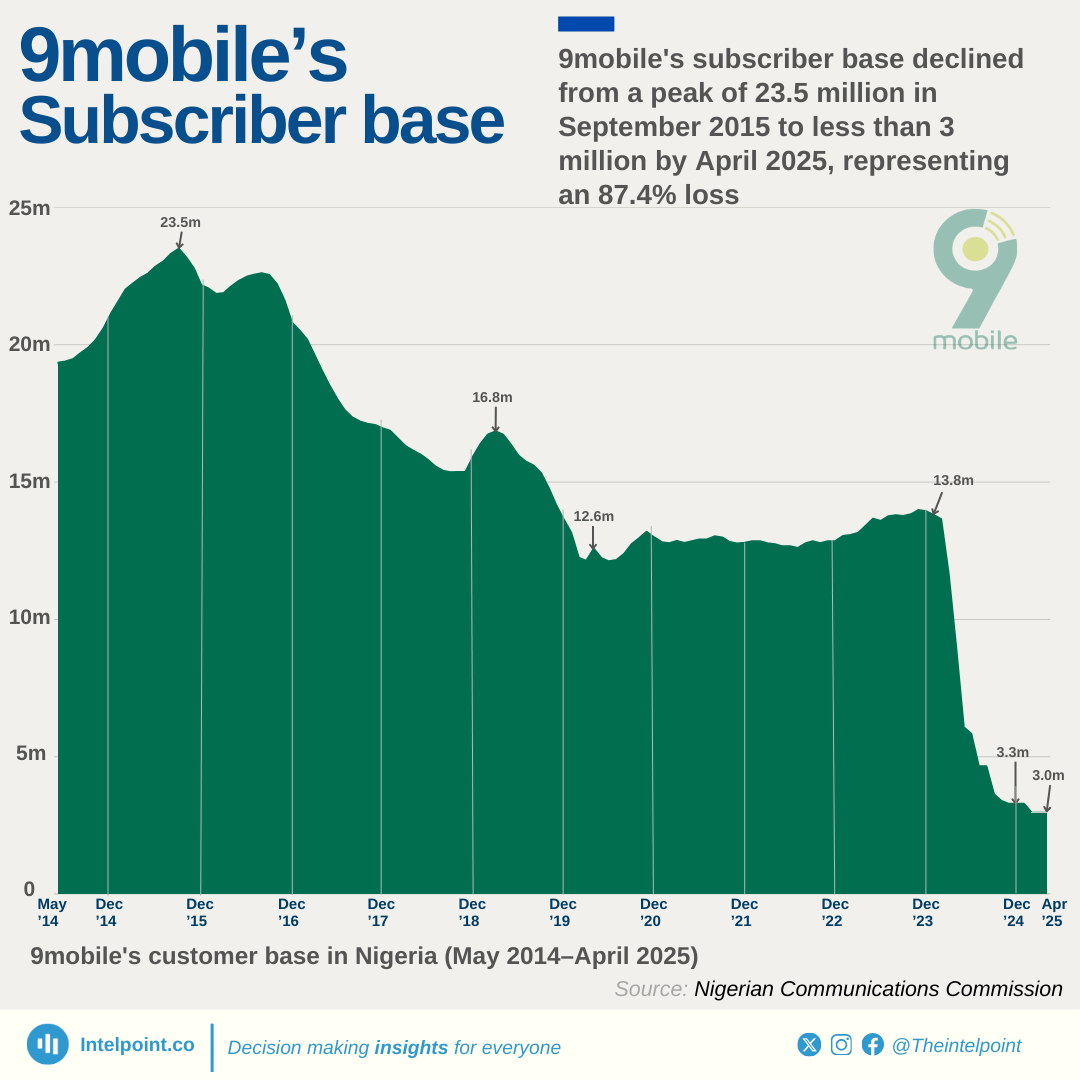
Between 2014 and 2015, 9mobile saw strong subscriber growth, reaching approximately 23.5 million in September 2015. However, its customer base has been on a decreasing trend since late 2015, with a brief and temporary recovery in late 2018 before continuing its downward trend in mid-2019.

From late 2019, the company's customer base stabilised until January 2024, when it began declining drastically from 13.8 million to less than 3 million by April 2025, representing an 87% loss in just over a year.

This massive loss could be attributed to ongoing service issues, poor customer experience, or competitive pressure from its competitors.

Source:

Nigerian Communications Commission

Period:

May 2014 - April 2025
HTML code to embed chart
Want a bespoke report?
Reach out
Tags
Related Insights

9mobile lost more than 110,000 users porting to other providers in 47 months, with the largest outflow exceeding 5,000 users between July 2024 and April 2025
Key Takeaways:
  • September 2024 saw the most outbound departures (7,127), followed by January 2025 (6,716 losses).
  • From June 2021 to April 2025, the network saw a steady and increasing loss of consumers to other suppliers.
  • The outflow has accelerated considerably since mid-2023, showing growing subscriber dissatisfaction or more appealing options.
  • The largest monthly outflows occurred between July 2024 and April 2025, when more than 5,000 subscribers left on a consistent monthly basis.
  • Early 2021 numbers were extremely low, with only 323 ports in June and July 2021.
  • The number of subscribers transferring out decreased dramatically between September 2024 and December 2024, before peaking again in January 2025.
  • Monthly port-outs rose from 323 in June 2021 to 7,127 in September 2024, an approximately 2,107% increase.

On average, over 75% of subscribers that switched networks ported from 9mobile, peaking at over 90% in September 2024
Key Takeaways:
  • 9mobile consistently tops the port-out chart, averaging over 75% of all outgoing ports over 24 months.
  • The highest subscriber loss from 9mobile occurred in September 2024, with 90.38% of all ports.
  • Airtel and Globacom show relatively stable port-out shares, rarely crossing 15%, with occasional surges. MTN has the lowest overall port-out rates, peaking at 13.64% in January 2025.
  • Total port-outs to other service providers surged by 127%, from 2,992 in May 2023 to 6,789 in April 2025.
  • The highest port transfer to another provider occurred in September 2024, with 7,886 total departures, and 9mobile recording 7,127 losses (90.38%).
  • Globacom’s outflow increased sharply from the July 2023 low, reaching 18.16% in April 2025.
  • Airtel maintained relatively low but fluctuating port-out rates, hitting its highest at 14.61% in October 2023.

Chrome alone accounts for two-third of all web traffic across all devices, outpacing Safari and Edge
  • Chrome dominates the global browser market with a 66% share, handling two-third of all web traffic across devices.
  • Safari follows distantly at 17%, trailing Chrome by a wide margin of 49% points.
  • Edge, Firefox, Samsung Internet, and Opera combined account for only 12% of the market, showing limited competition.
  • Other lesser-known browsers collectively hold a 5% share, indicating minimal impact from emerging or alternative players.

MTN Nigeria leads the number of subscribers porting in with an average of 62% annually, peaking at 5,551 in January 2025
Key takeaways:
  • MTN continuously received the most ported-in subscribers, particularly from 2023 to 2025.
  • MTN ported-in subscribers increased from 616 in June 2021 to 5,551 in January 2025.
  • Airtel subscribers from other networks expanded from 360 to 2,414 port-ins (567%) throughout the same period.
  • Airtel experienced significant growth in August-September 2024 and January 2025, with over 2,000 port-ins monthly.
  • Globacom's performance remained low, with fewer than 1,000 port-ins throughout the period.
  • The high number of subscribers switching to MTN indicates a stronger customer preference for MTN, most likely owing to perceived quality or promotional incentives.

Mobile data usage in Sub-Saharan Africa significantly lags behind the global average of 21.6 GB per month
  • Sub-Saharan Africa has the lowest mobile data usage globally, at 6.7 GB/month, which is less than one-third of the global average.
  • India, Nepal, and Bhutan top the global chart with the highest data consumption at 36 GB/month, signalling deep mobile integration in daily life.
  • Gulf Cooperation Council countries follow closely with 31.9 GB/month.
  • Western Europe and North America share the same high usage rate of 25.8 GB/month, indicating mature digital economies with consistent connectivity.
  • Latin America also lags, though still more than twice ahead of Sub-Saharan Africa at 15.2 GB/month.
  • The Middle East and North Africa surpass the global average too, at 22.7 GB/month, further highlighting the unique lag of Sub-Saharan Africa in mobile data use.

The total global monthly cellular data usage across all mobile app categories reached 146.92 EB in January 2025
  • Video apps consumed 75.86% of the total global mobile data, making them by far the largest data users.
  • Social networking apps accounted for 7.84% of the total data usage, translating to 11.52 exabytes.
  • The "Others" category, which includes smaller app groups, made up 10.48% of global mobile data usage.
  • Software updates consumed 2.73% of the global mobile data volume, equivalent to 4.01 exabytes.
  • Web browsing took up 1.42% of mobile data use globally, accounting for 2.09 exabytes.
  • Audio apps like streaming music services accounted for 1.20% of the total mobile data usage.
  • File sharing applications consumed just 0.47% of the mobile data globally, indicating a relatively small share compared to other categories.

POPULAR TOPICS
SIGN UP TO OUR NEWSLETTER
Get periodic updates about the African startup space, access to our reports, among others.
Subscribe Here
Subscription Form

A product of Techpoint Africa. All rights reserved