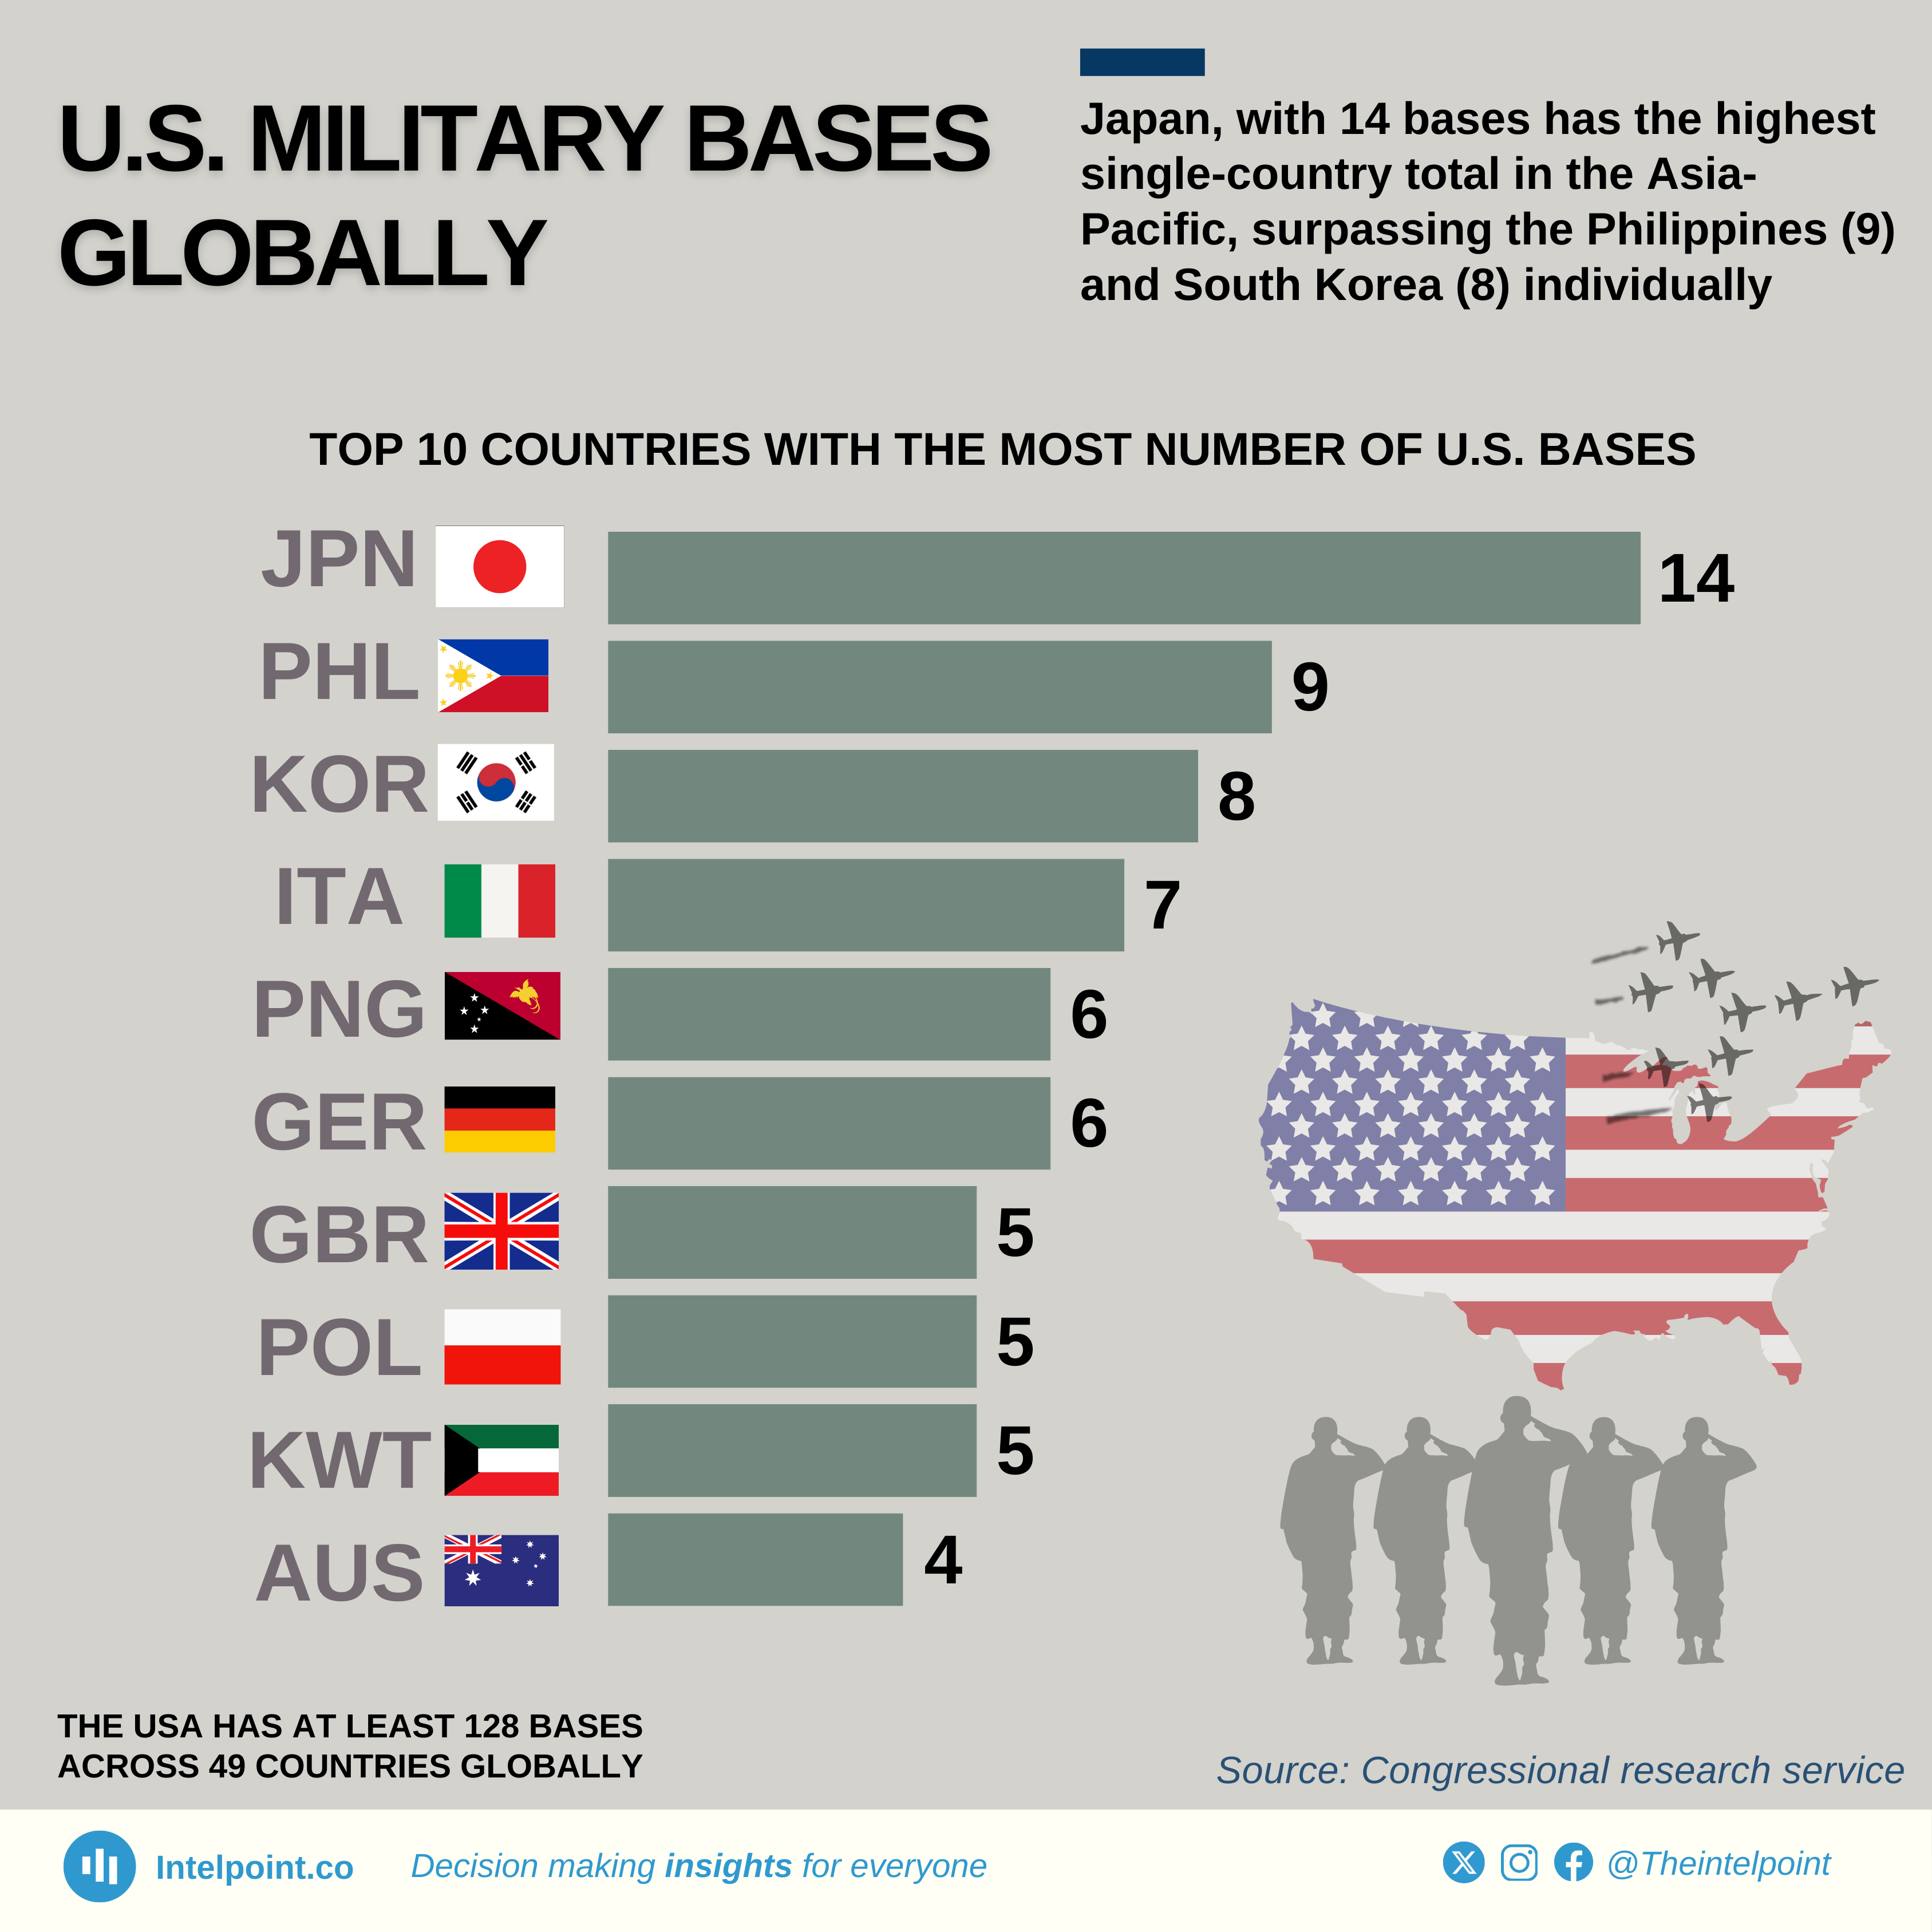
Japan leads with 14 bases. It hosts the most U.S. bases globally, exceeding individual counts in the Philippines (9) and South Korea (8).
Asia-Pacific Dominance: The region (Japan, Philippines, South Korea, Australia, and Papua New Guinea) accounts for 41 bases, nearly 1/3 of the global total.
The Asia-Pacific region hosts 41 U.S. bases, while Europe (Italy, Germany, Poland, UK) has 23. This indicates a growing strategic pivot towards the Pacific compared to traditional European deployments.
Kuwait (5 bases) stands out as the primary hub for U.S. military operations in the Middle East, highlighting its role as a key staging ground for regional security.
The top 10 host countries account for 69 of the 128 total bases (over 53%), meaning nearly half of U.S. overseas bases are spread across the remaining 39 countries.
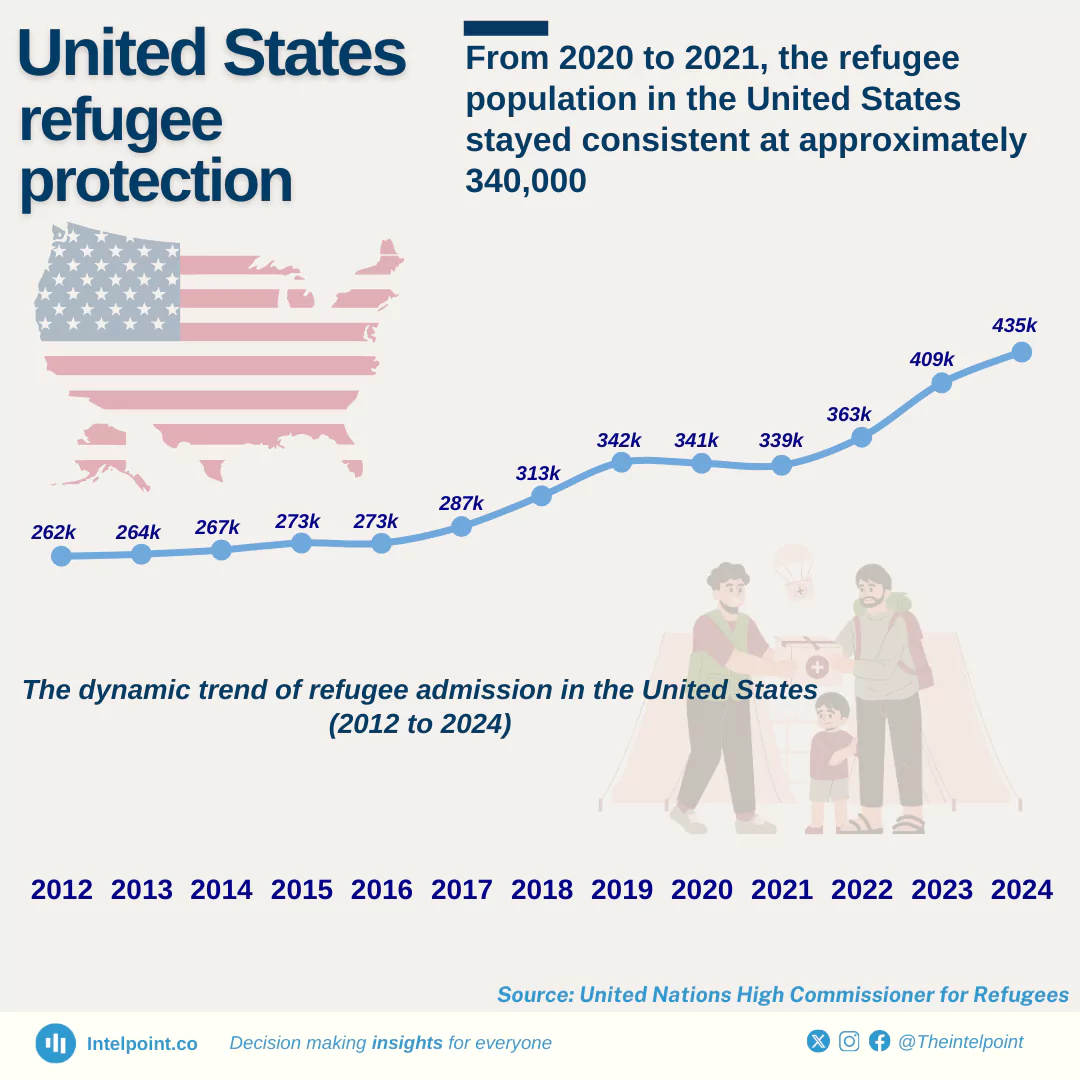
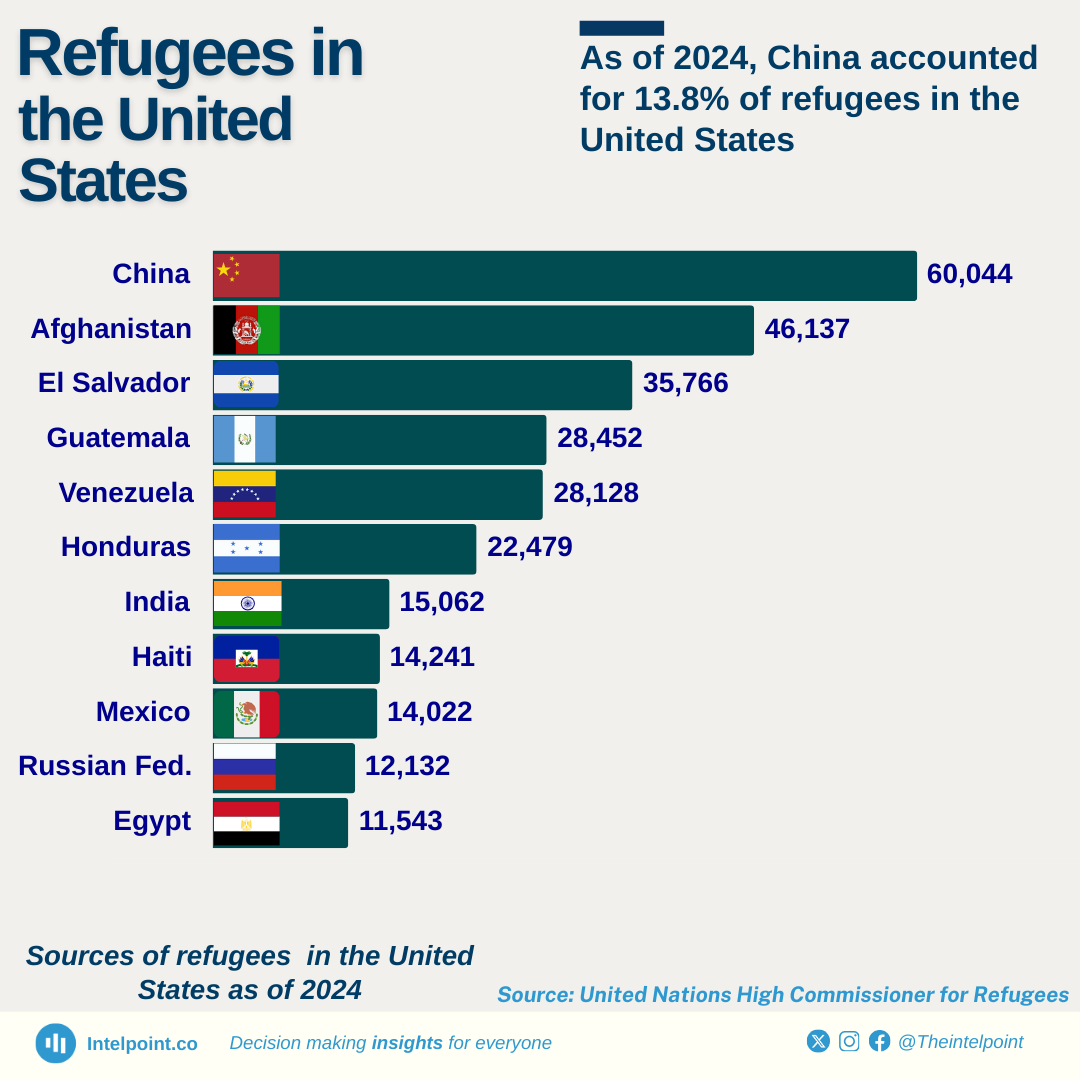
United Nations High Commissioner for Refugees (UNHCR) has documented over 435,000 refugees in the U.S. in 2024.
China and Afghanistan stand as the leading sources of refugees, with 60,044 and 46,137 individuals identified as refugees from these countries respectively.
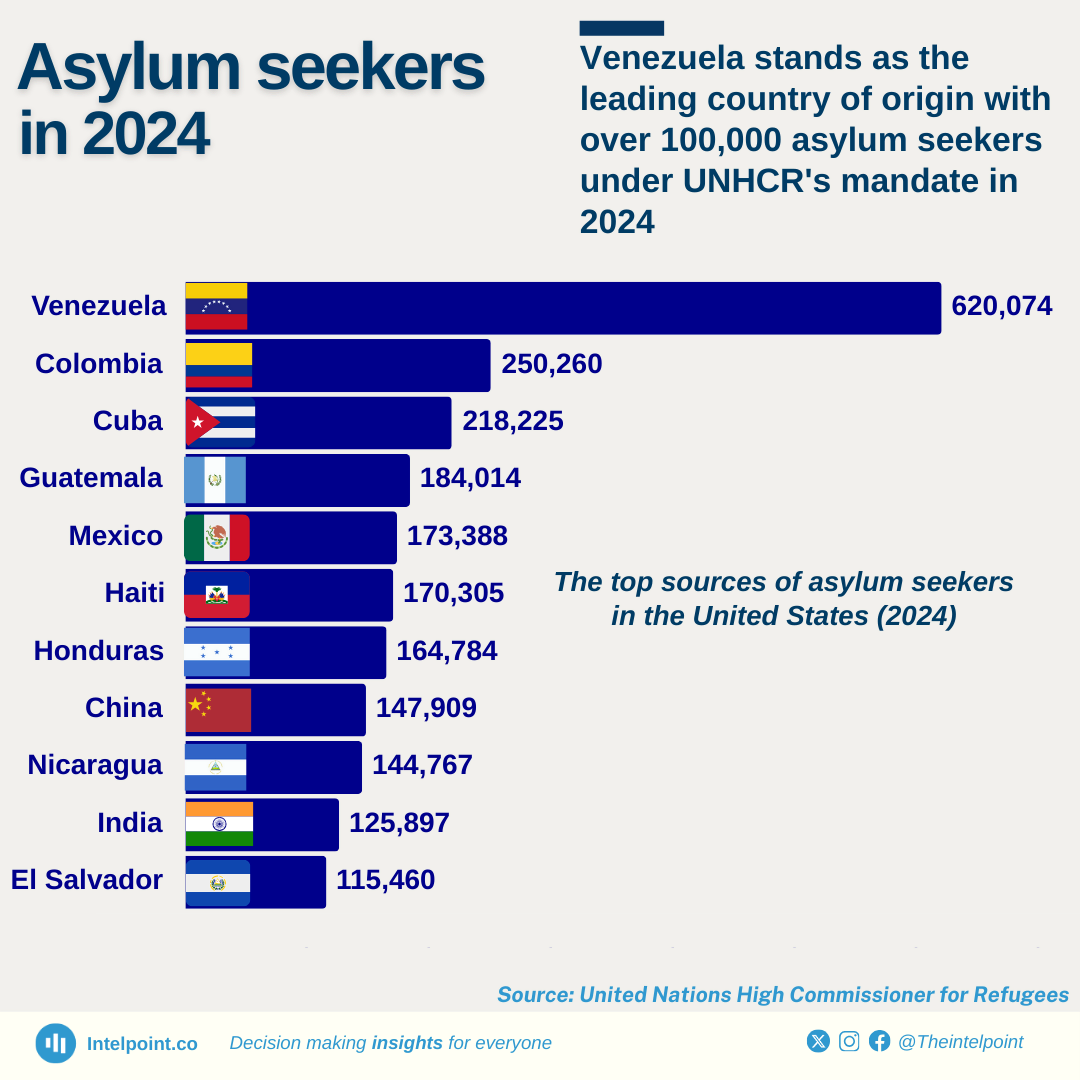
The top eleven countries of origin have each recorded more than 10,000 refugees in the United States.
Central American nations (El Salvador, Guatemala, and Honduras) accounted for 19.9% of refugees in the US.
In 2023, the global mobile phone export market totalled $271.42 billion, with China dominating by accounting for $137 billion (50.5%) of total exports.
Vietnam, Hong Kong, and India complete the top four, accounting for 11.8%, 9.7%, and 5.3% of the total, respectively.
Six Asian countries and regions make up four-fifths of global mobile phone export value in 2023, showcasing the region's dominance in the industry.
In 1961, China produced just 167,000 tonnes of apples, accounting for a mere 1% of global production.
Over the next six decades, this figure surged by 28,300%, reaching 47.5 million tonnes by 2022 and capturing 50% of global production — growing at an average rate of around 7.5% per year.
China's rise began with agricultural reforms in the late 1970s and gained momentum in the 1980s and 1990s.
These are the top ten apple-producing countries over the years.
Since the 2007/08 academic year, Nigeria has consistently held the top spot for the number of African international students in the US. Before this, Kenya and Egypt also led in certain periods.
This trend highlights the evolving landscape of African students pursuing education in the US over the decades.
From 1961 to 2022, Nigeria contributed about 7.3% to the global groundnut production, making it a key player in the sector. Alongside China and India, which also dominated production, these three countries accounted for 61% of the world’s groundnut supply.
In H1 2024, the UK accounted for nearly half (48.9%) of Nigeria’s capital investments, totalling $2.93 billion, followed by South Africa (14%) and the Netherlands (11%).
This highlights the UK's long-standing economic ties with Nigeria, having invested over $47.5 billion over the past ten years. The UK remains Nigeria's top capital import source.