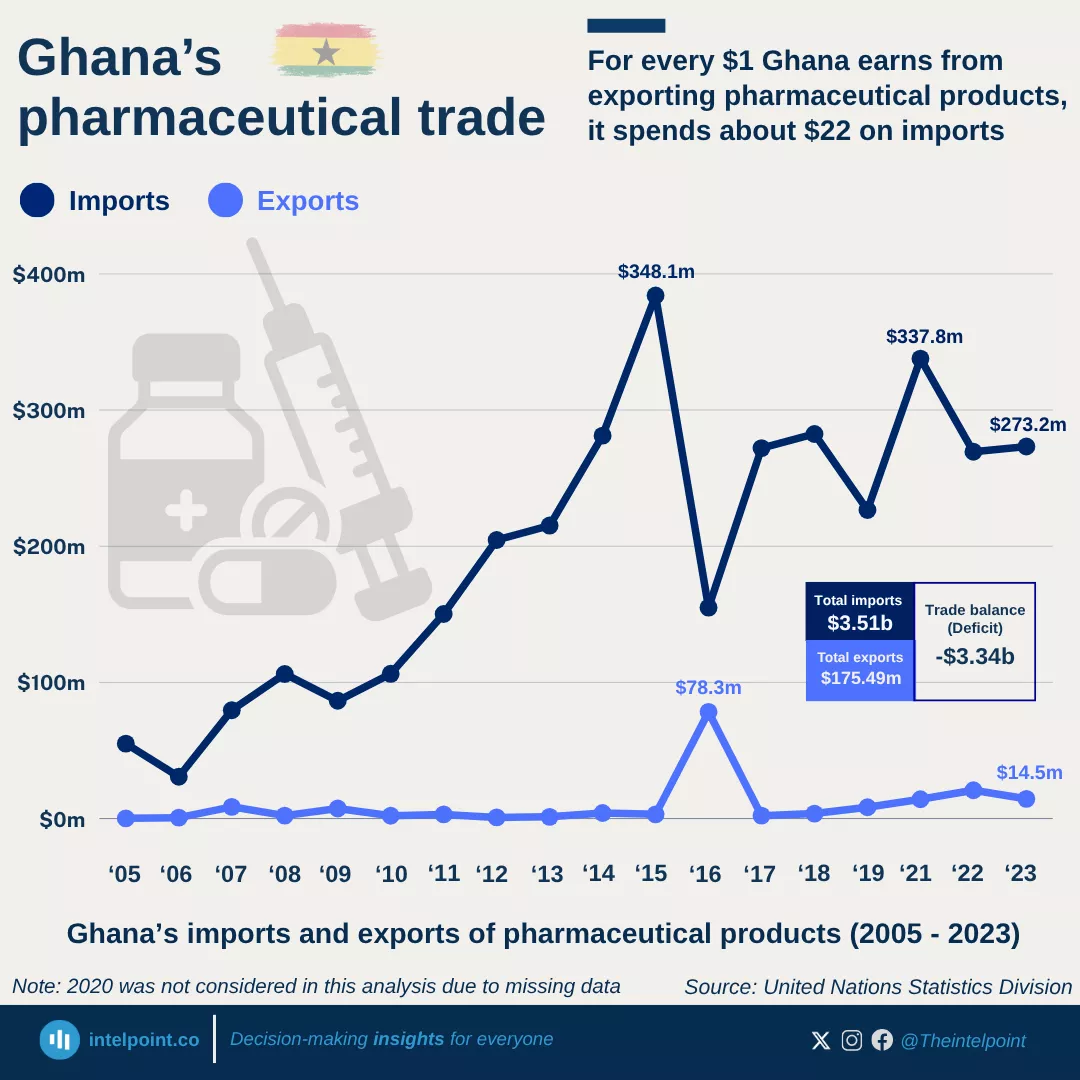
For every $1 Ghana earns from pharmaceutical exports, it spends about $22 on imports, underscoring the country’s overwhelming dependence on foreign pharmaceutical products.
Ghana is a net importer of medicine and has been for nearly two decades.
By 2015, Ghana’s pharmaceutical imports reached its peak with $348.12m while exports were $3.10m, meaning imports were nearly 100 times larger.
In 2016, Ghana recorded its highest-ever export performance at $78.33 million, but even then, imports stood at $154.96m, almost two times higher.
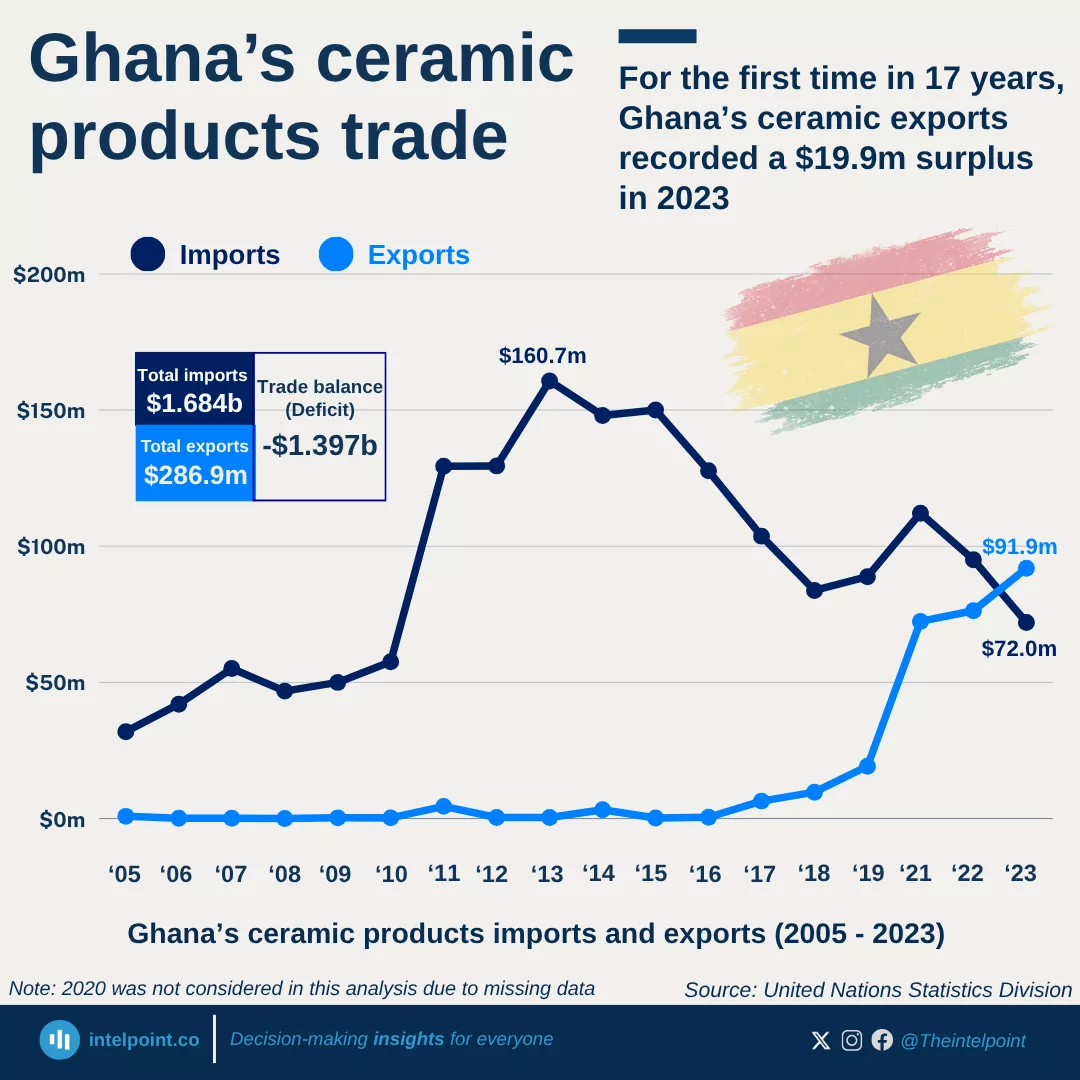
In 2023, Ghana recorded $91.9m in ceramic exports, amassing $19.9m profit, after 17 years of consistent trade losses and heavy dependence on imported ceramic products.
For 17 years, Ghana’s ceramic market was largely import-driven, with local industries struggling to compete against foreign products.
Ghana's ceramic products trade recorded $1.397 billion in trade deficit in almost two decades.
Ghana's ceramic industry has finally moved from dependency to a driver of profit and progress.
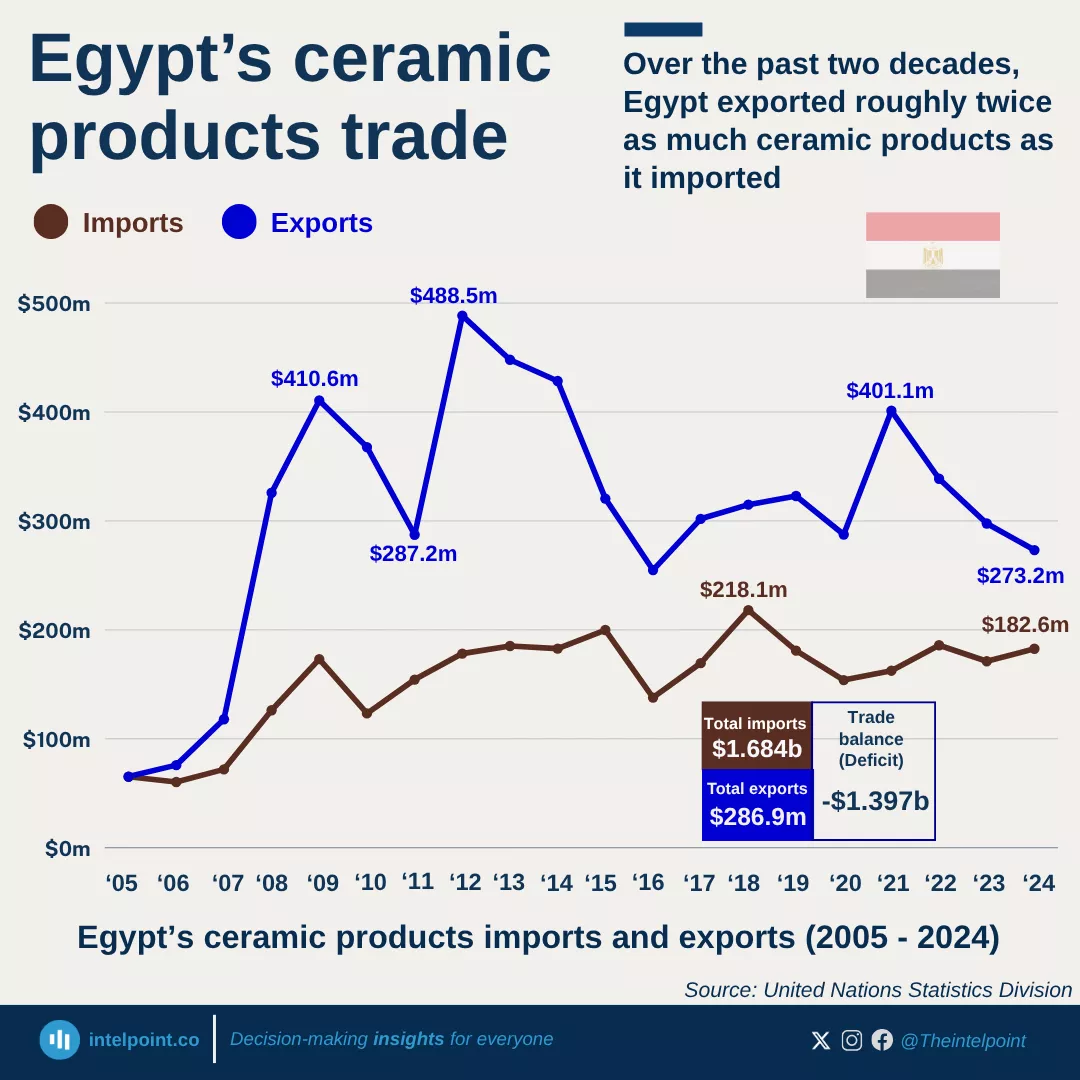
Over the past two decades, Egypt exported roughly twice as much ceramic products as it imported, positioning itself as a key player in regional and global ceramic products trade.
In 2012, exports peaked at $488.51 million, more than double imports at $178.23 million, setting a clear demonstration of strong industrial and commodity output.
In 2008, exports soared to $325.86 million, more than doubling imports at $126.21 million.
Between 2017 and 2021, the export sector showed stable performance, averaging $327 million annually.
The year 2021 was a standout, with exports reaching $401.12 million, reflecting a strong rebound that reaffirmed Egypt’s export capacity post-pandemic.
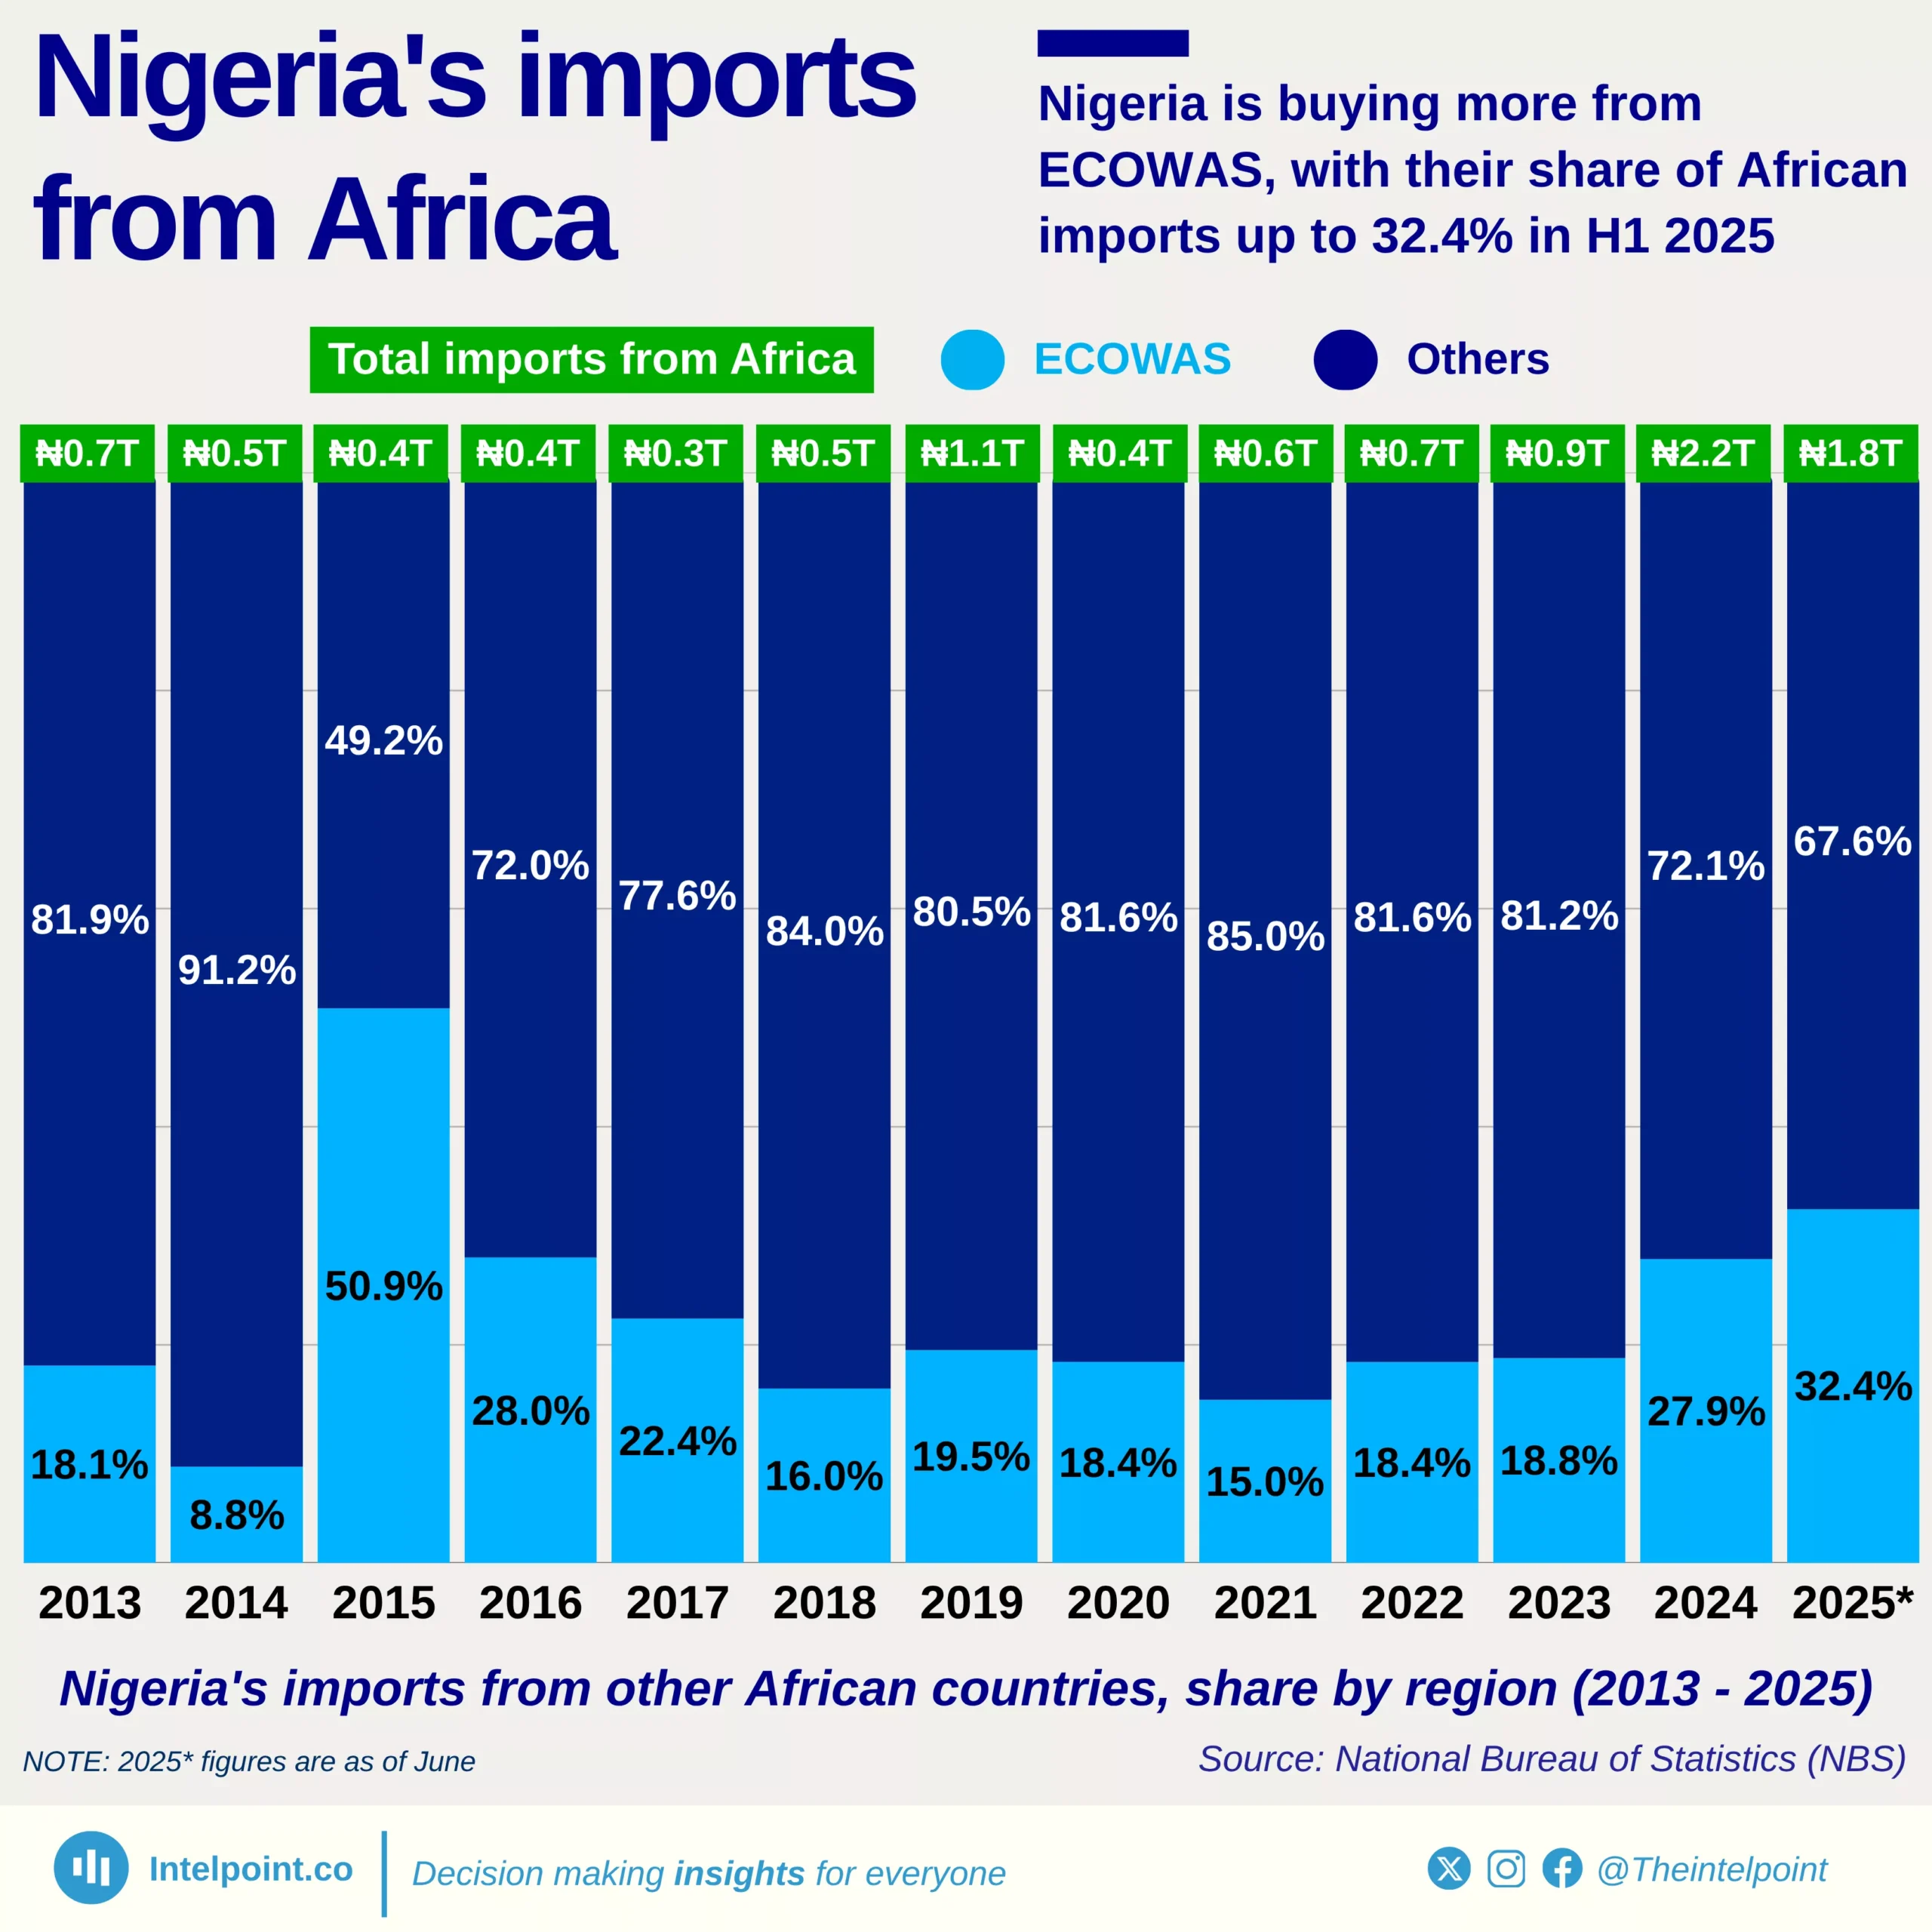
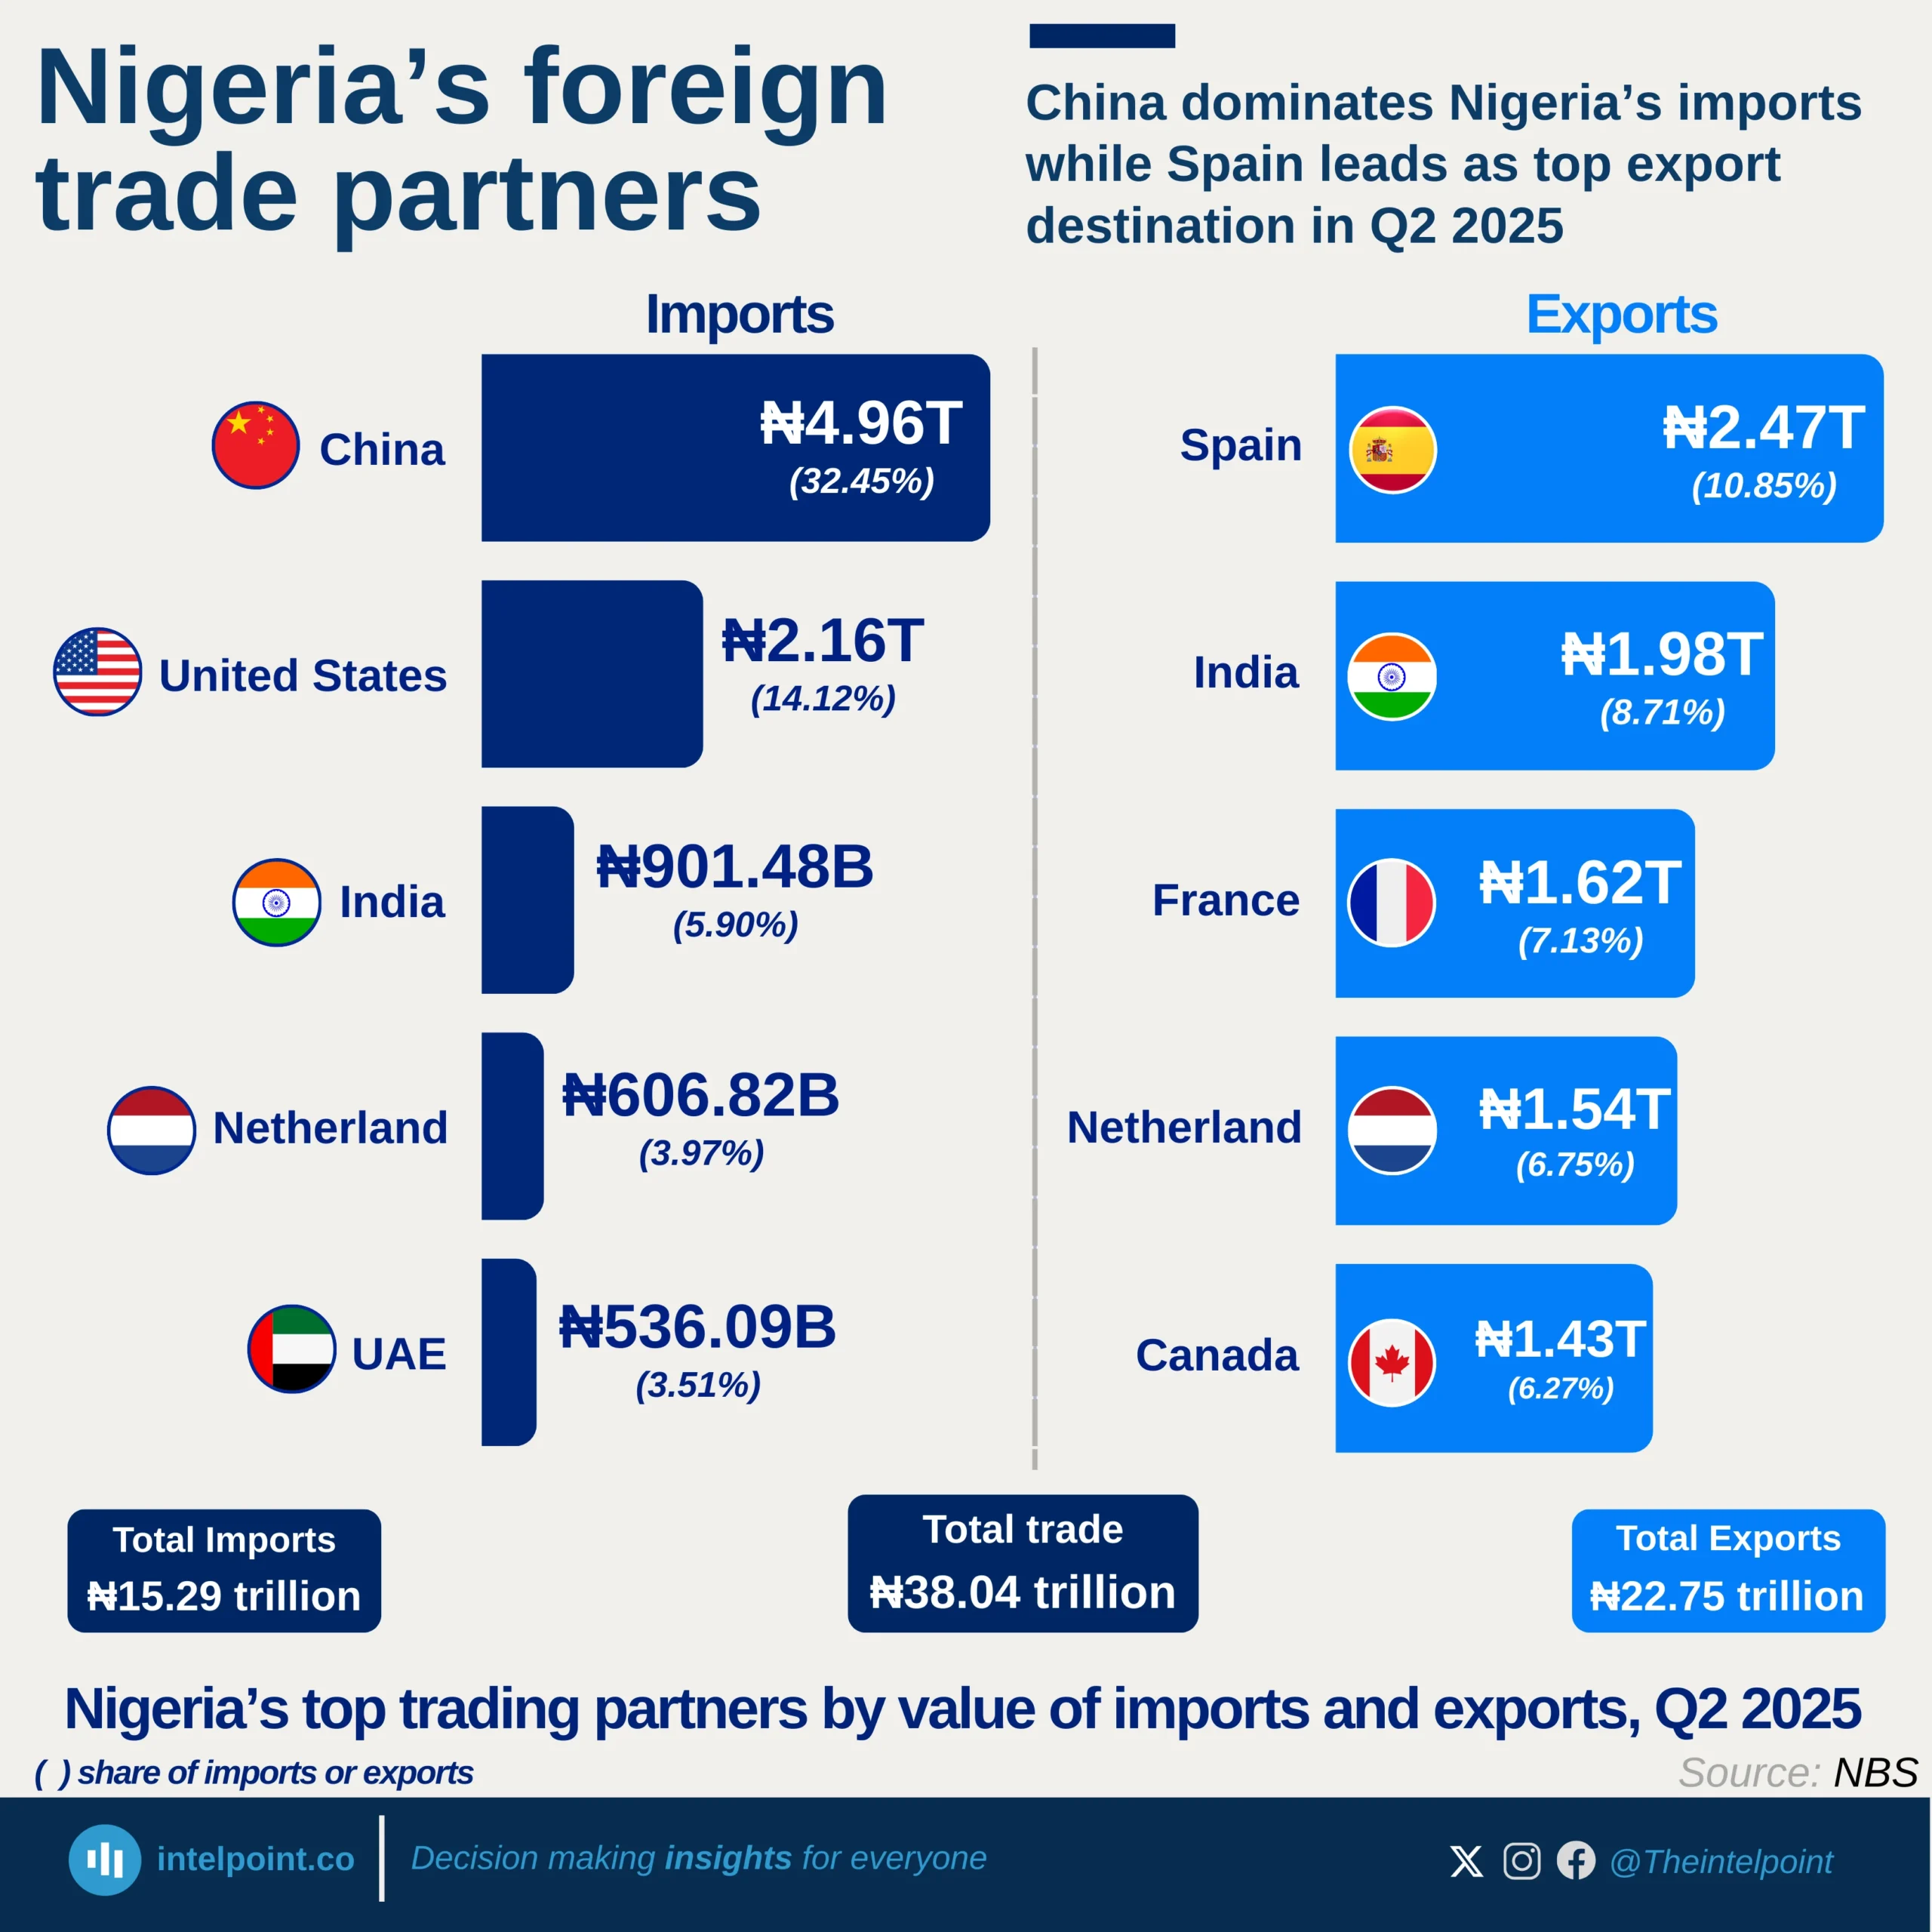
China remains Nigeria’s largest import partner, accounting for ₦4.96T or 32.45% of total imports—more than double the U.S.'s share.
The United States holds second place in imports, contributing ₦2.16T (14.12%), while India, the Netherlands, and the UAE follow with smaller shares below 6%.
Spain tops Nigeria’s export market, receiving ₦2.47T worth of goods, representing 10.85% of total exports.
Europe features strongly among export partners, with Spain, France, and the Netherlands together absorbing nearly a quarter of Nigeria’s outbound trade.