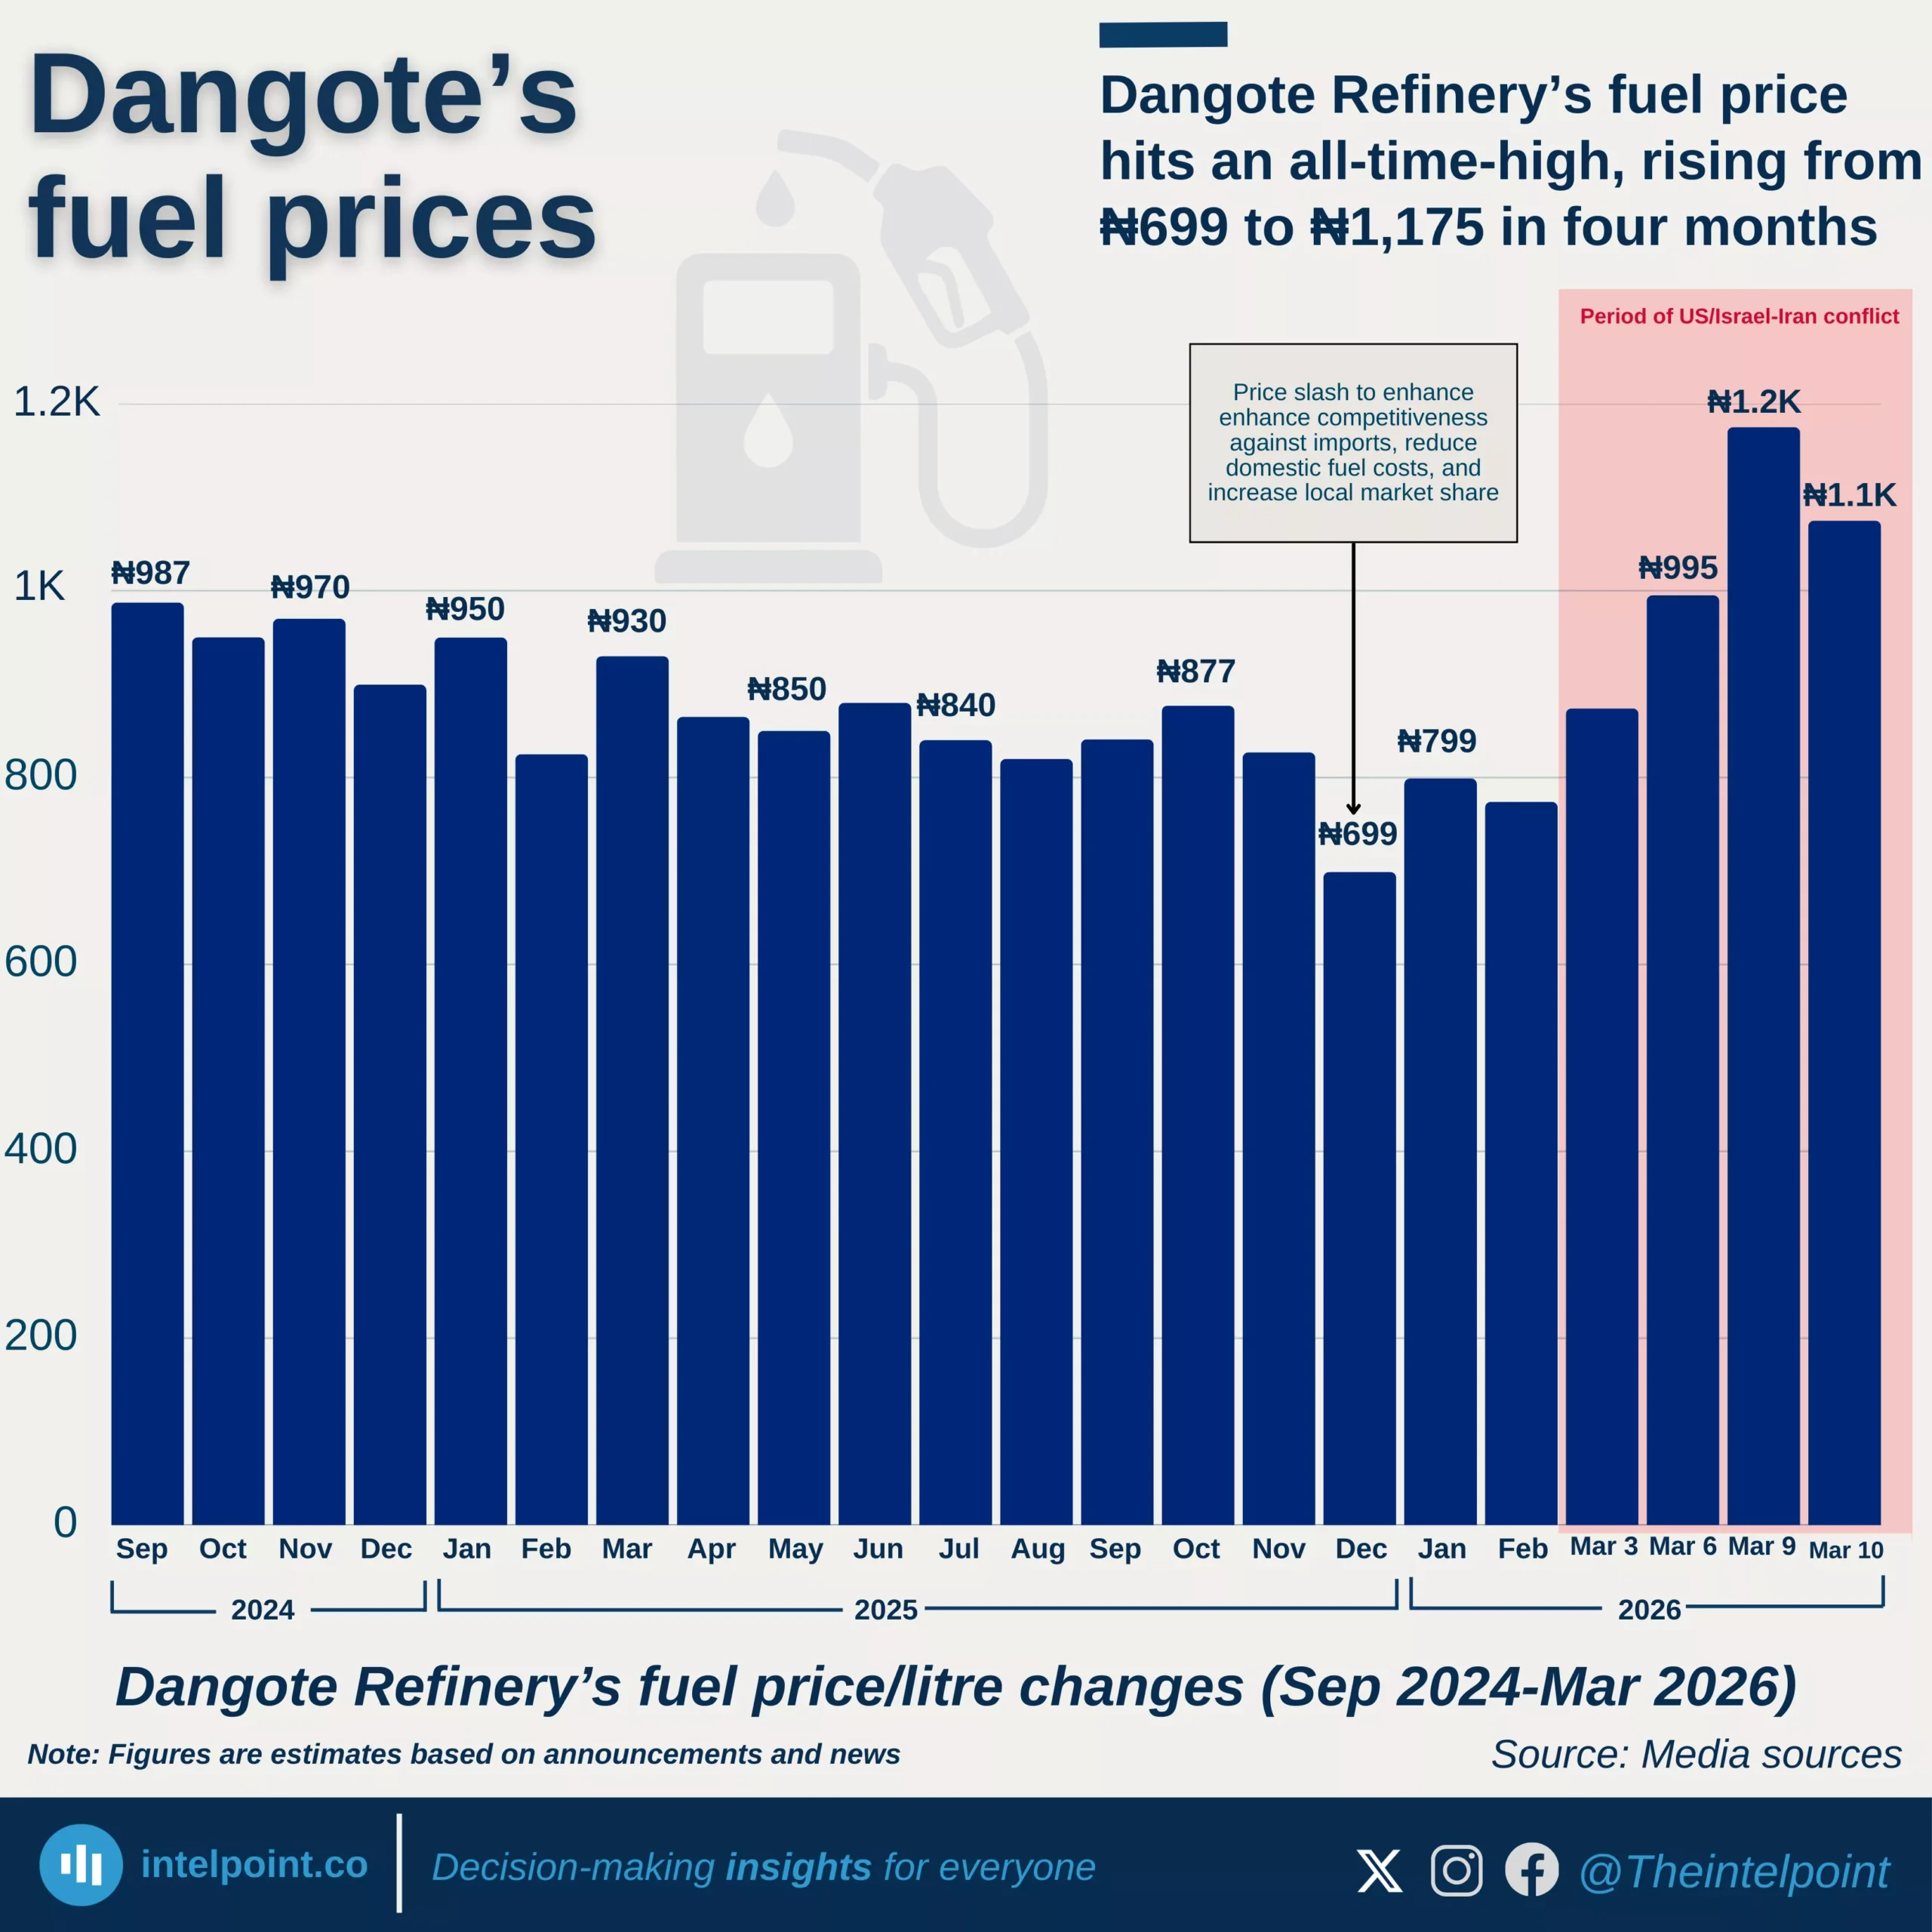
Fuel prices from Dangote Refinery reached an all-time high of ₦1,175 per litre in March 2026.
The lowest recorded price in the period was ₦699 per litre in December 2025, showing a wide price swing.
The jump from ₦699 to ₦1,175 happened in roughly four months.
Prices earlier in the timeline hovered mostly between ₦820 and ₦987 during late 2024 and much of 2025.
The December 2025 price cut was aimed at making locally refined fuel more competitive against imports.
After the price drop, fuel costs began rising again in early 2026, reaching ₦995 by early March before climbing further.
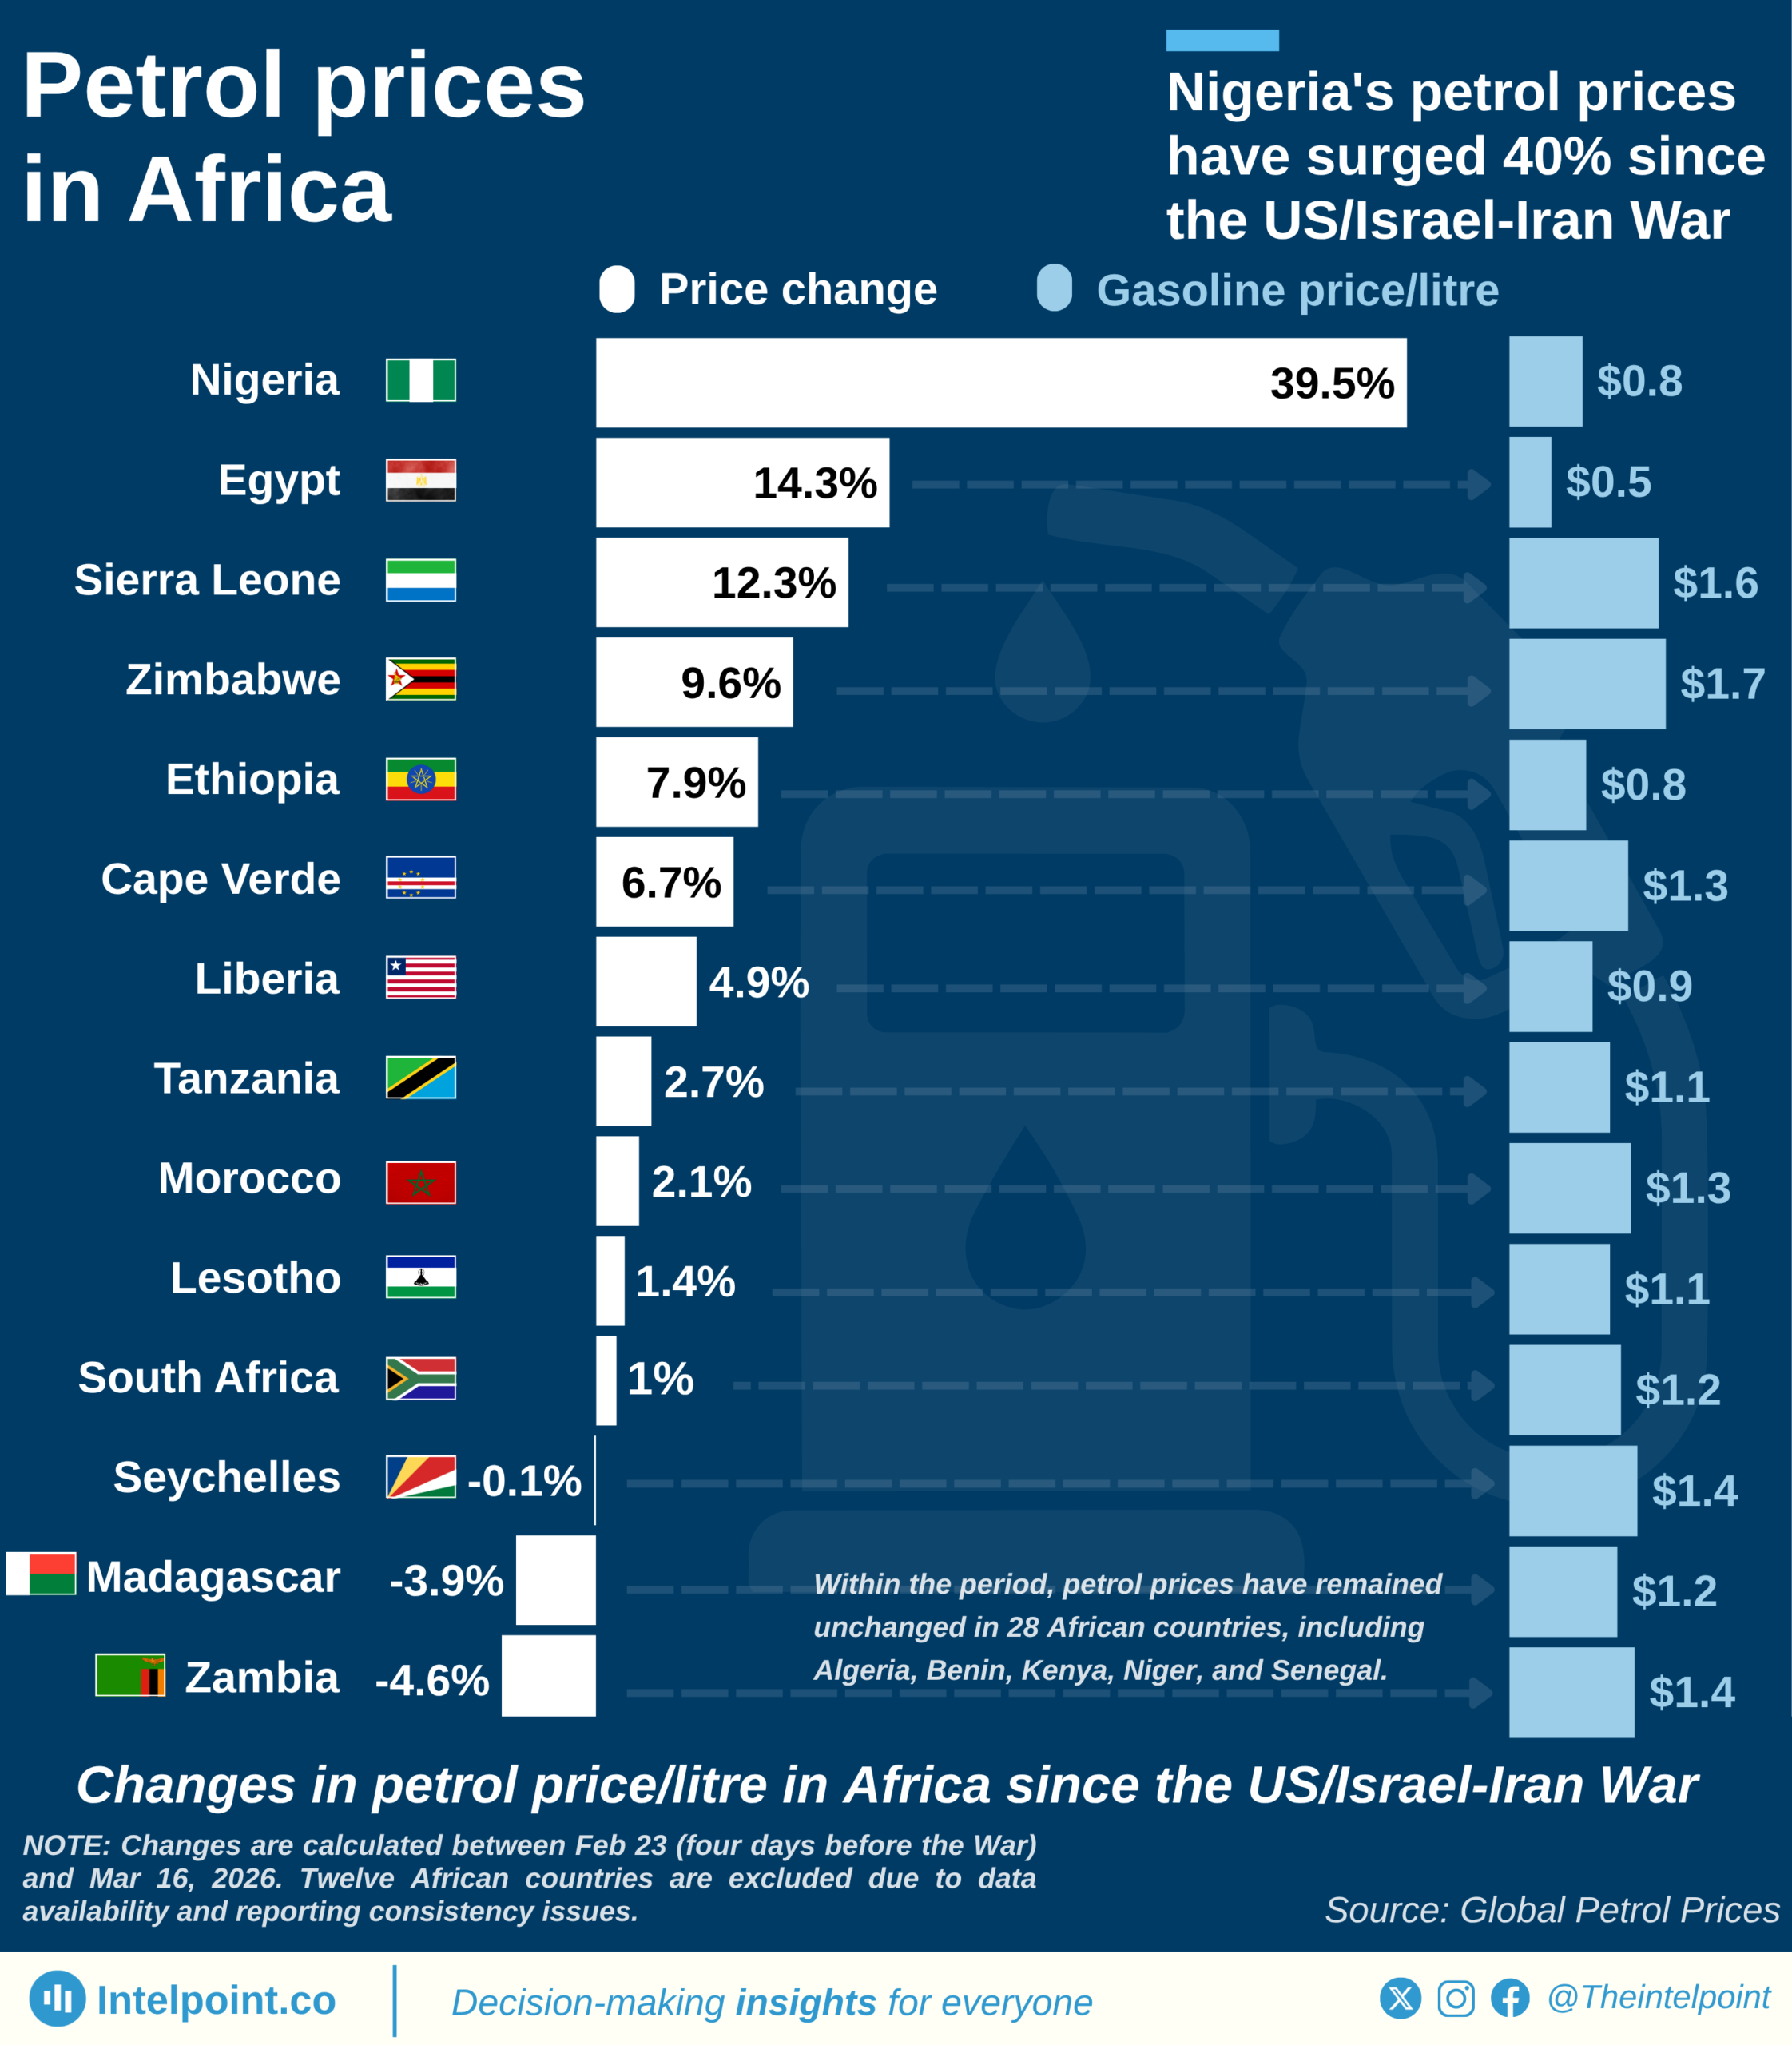
Global geopolitical tensions affecting oil markets contributed to the upward pressure on prices.
The Strait of Malacca is the world’s most important oil chokepoint, carrying about 24–25% of global oil supply in recent years.
The Strait of Hormuz moves around 20–23% of global oil supply, making it the second-largest energy transit chokepoint.
The Cape of Good Hope carries about 9–10% of global oil flows, and its share tends to increase when other chokepoints face disruptions.
The Bab el-Mandeb saw a sharp drop in oil flow share from about 9% in 2023 to around 4% in 2024, reflecting security concerns affecting shipping in the Red Sea corridor.
Oil transported through the Suez Canal and the SUMED pipeline system dropped significantly after 2023, falling from about 8.6% to below 5%, showing how quickly routes shift during geopolitical tensions.
The Strait of Malacca’s share has remained consistently high and stable, indicating its structural importance to Asian energy demand.
Alternative routes like the Cape of Good Hope in South Africa are longer but strategically crucial, especially when Middle Eastern chokepoints become unstable.
Export values have grown over 400%, rising from ₦11.8 trillion in 2013 to a peak of ₦55.3 trillion in 2024, a fivefold increase driven by rising oil prices and a weaker naira.
2015 and 2016 were the hardest years, with export values crashing as low as ₦6.8 trillion in 2015, reflecting the brutal impact of the global oil price collapse on Nigeria's most critical export.
The most explosive growth came from 2023 onwards, with values surging past ₦29 trillion in 2023 and peaking at ₦55.3 trillion in 2024, largely driven by the naira depreciation following Nigeria's 2023 foreign exchange reforms.
The first nine months of 2025 saw a slower pace than the previous year, with ₦37.7 trillion recorded between Q1 and Q3, lower than the ₦41.5 trillion recorded during the same period in 2024.