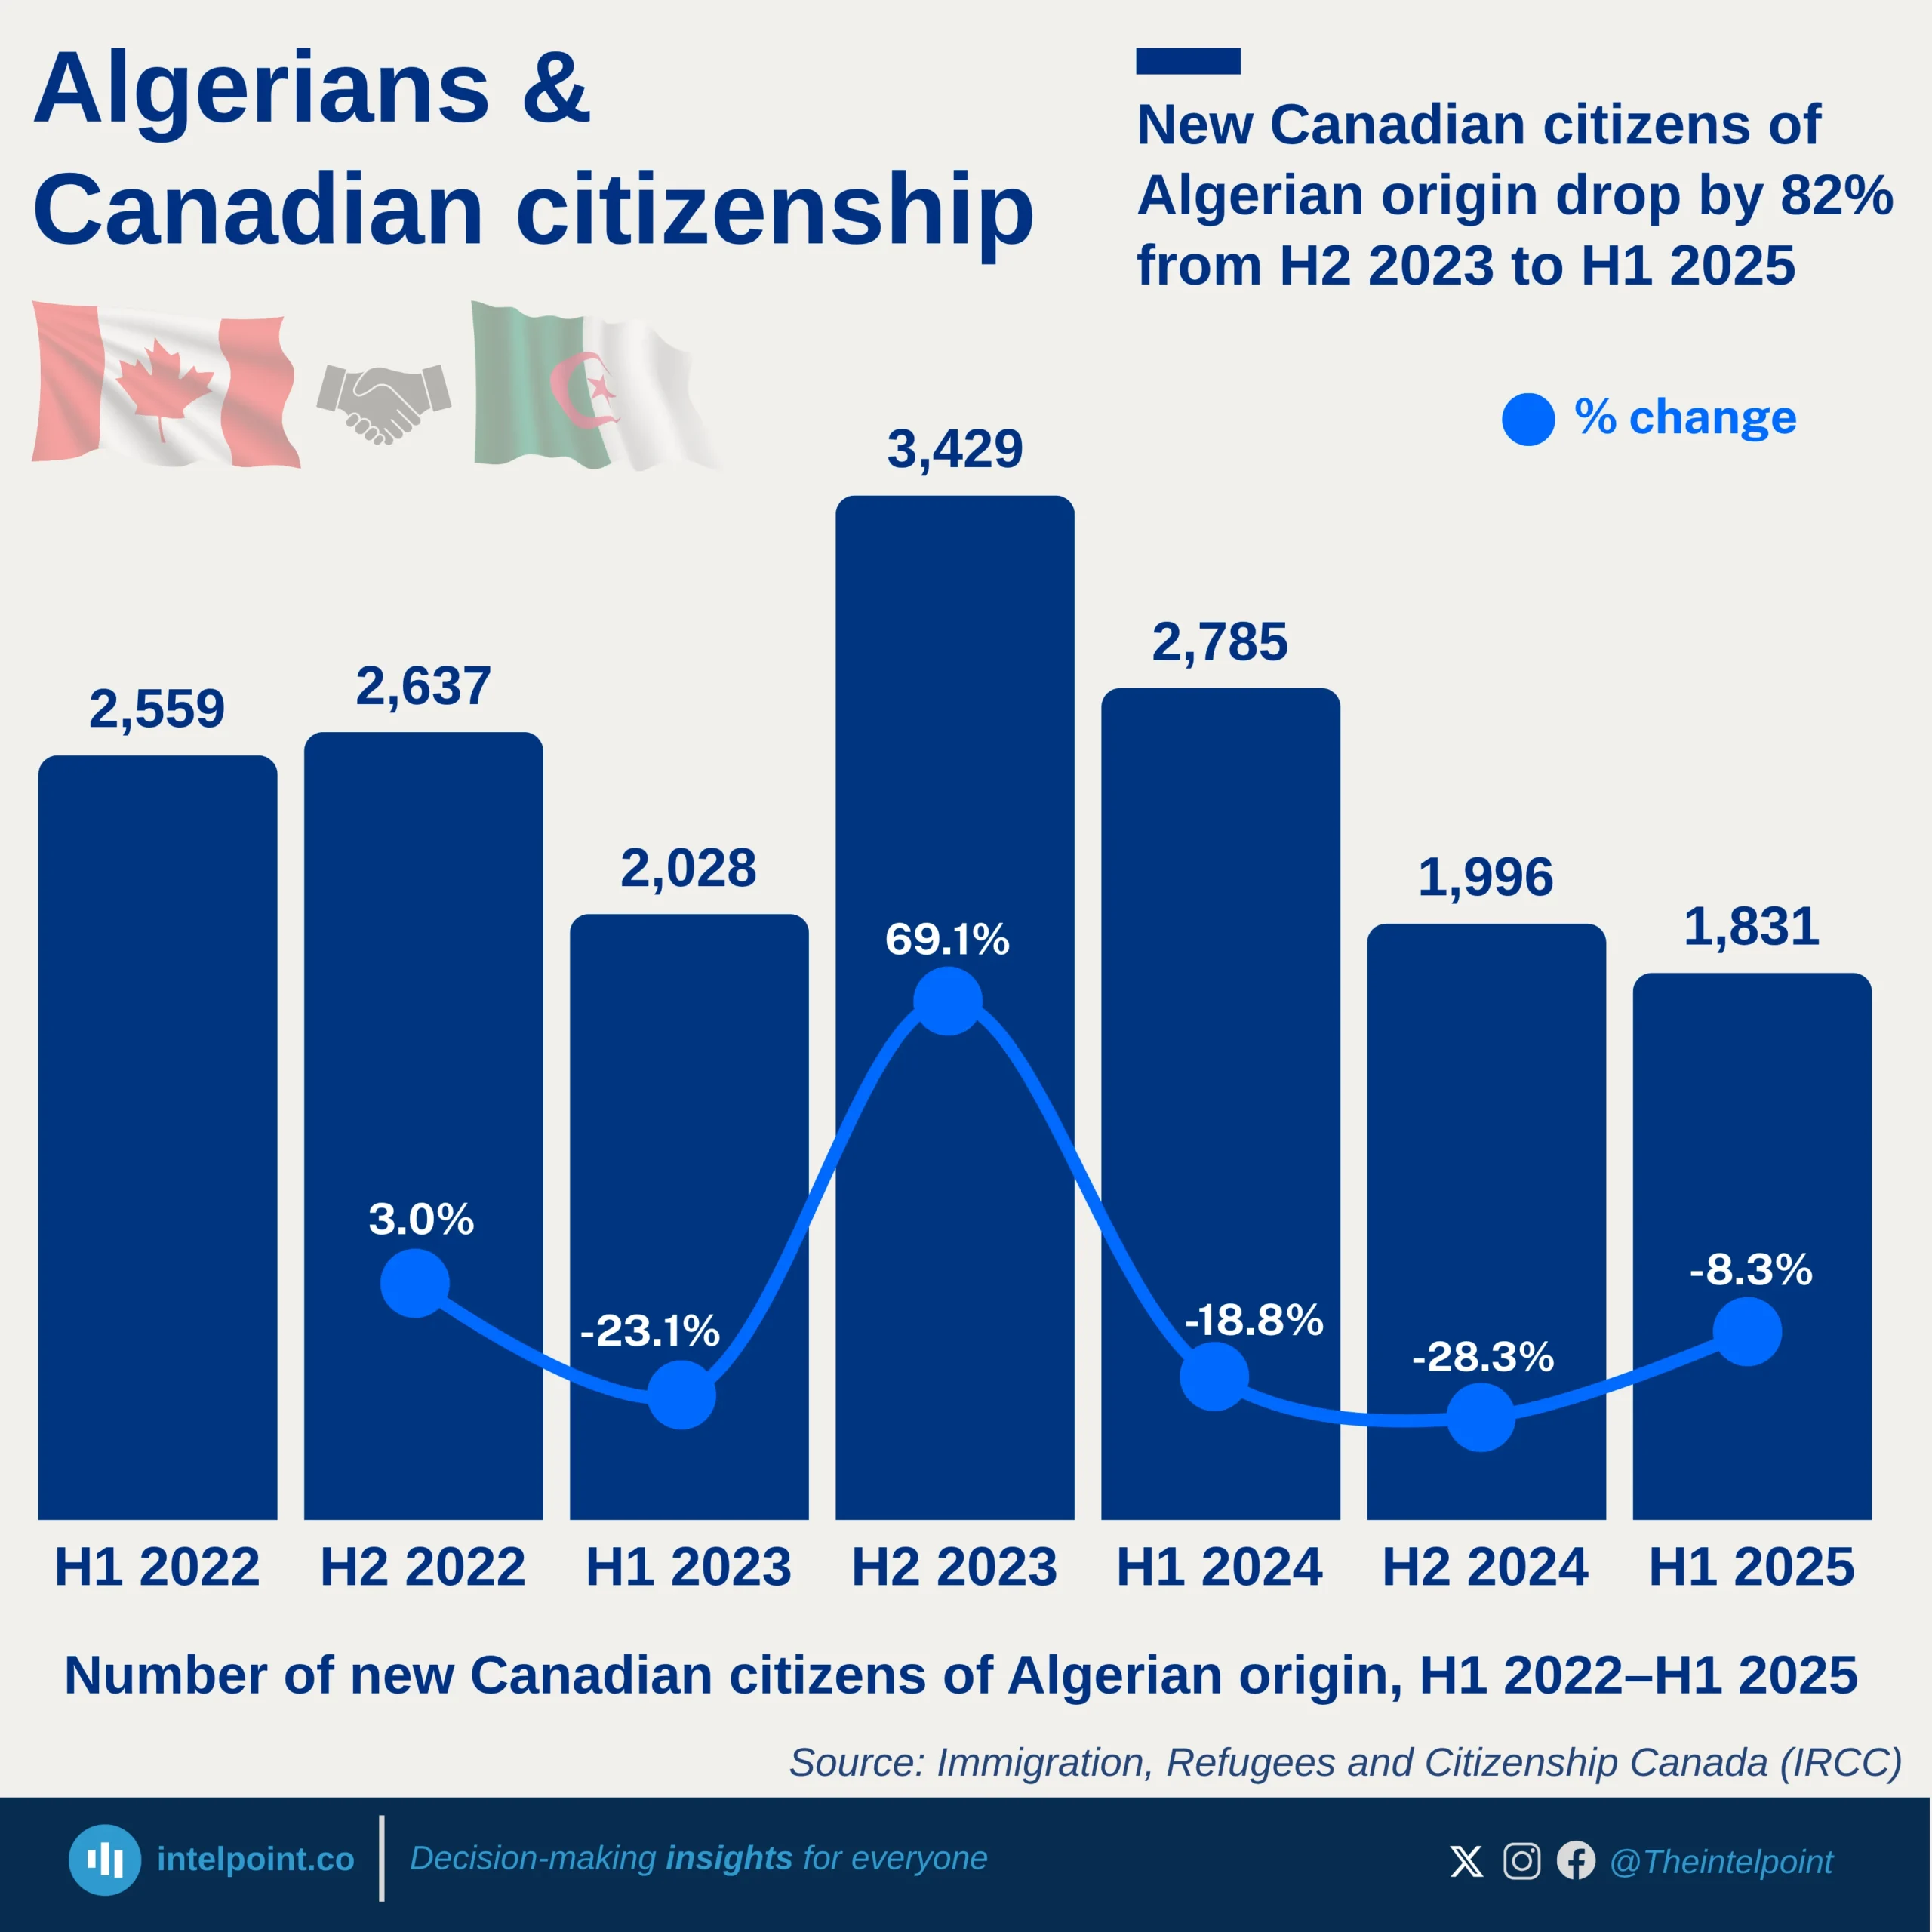
Algeria’s naturalisation figures in Canada showed major volatility, swinging between sharp increases and declines across half-year periods.
The number of new citizens peaked at 3,429 in H2 2023, representing a 69.1% surge from the preceding half year.
Following the 2023 peak, figures fell by 18.8% in H1 2024 and another 8.3% in H1 2025, showing a sustained downward correction.
Between H1 2022 (2,559) and H1 2025 (1,831), naturalisations dropped by roughly 28%, suggesting reduced inflow or slower application approvals among Algerian residents.
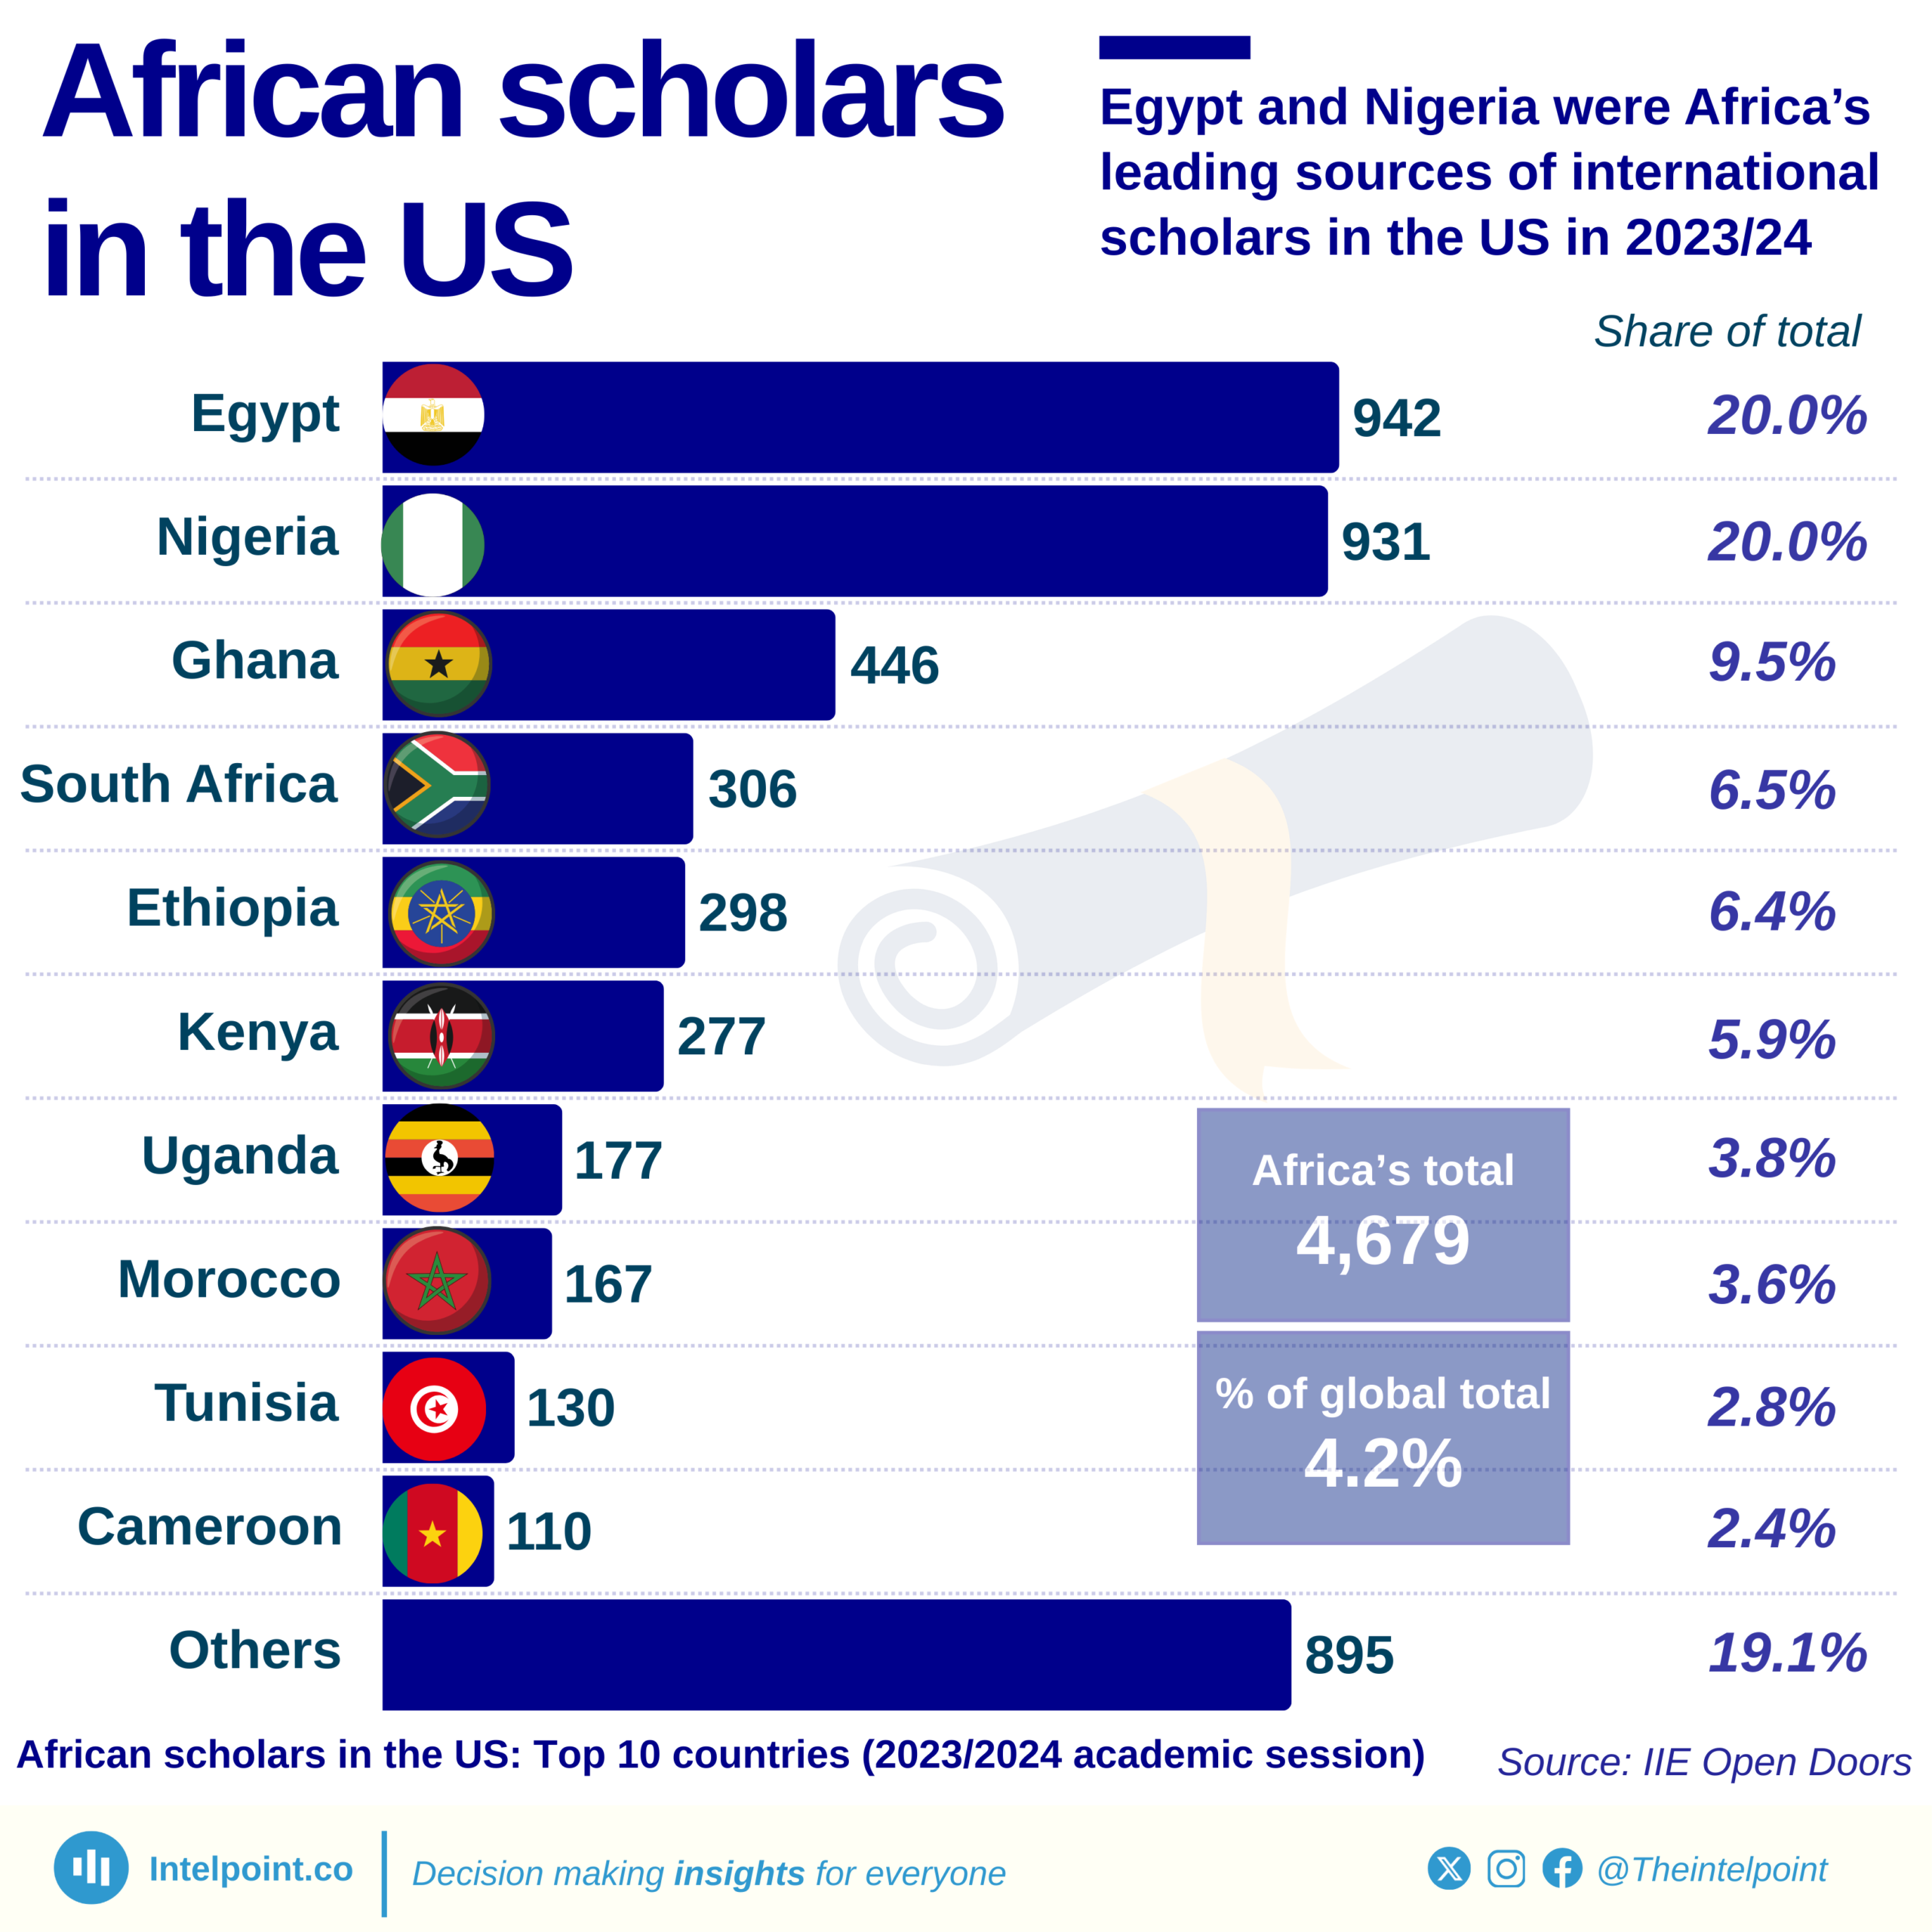
Egypt remained the lead African country with the highest number of international scholars in the US, with 942 recorded in the 2023/2024 academic session.
As of the 2023/2024 academic session, 4,679 international scholars in the United States of America are from Africa.
A total of 931 international scholars in the US as of the same session are from Nigeria.
Africa produced 4.2% of the international scholars in the US for the session under review.
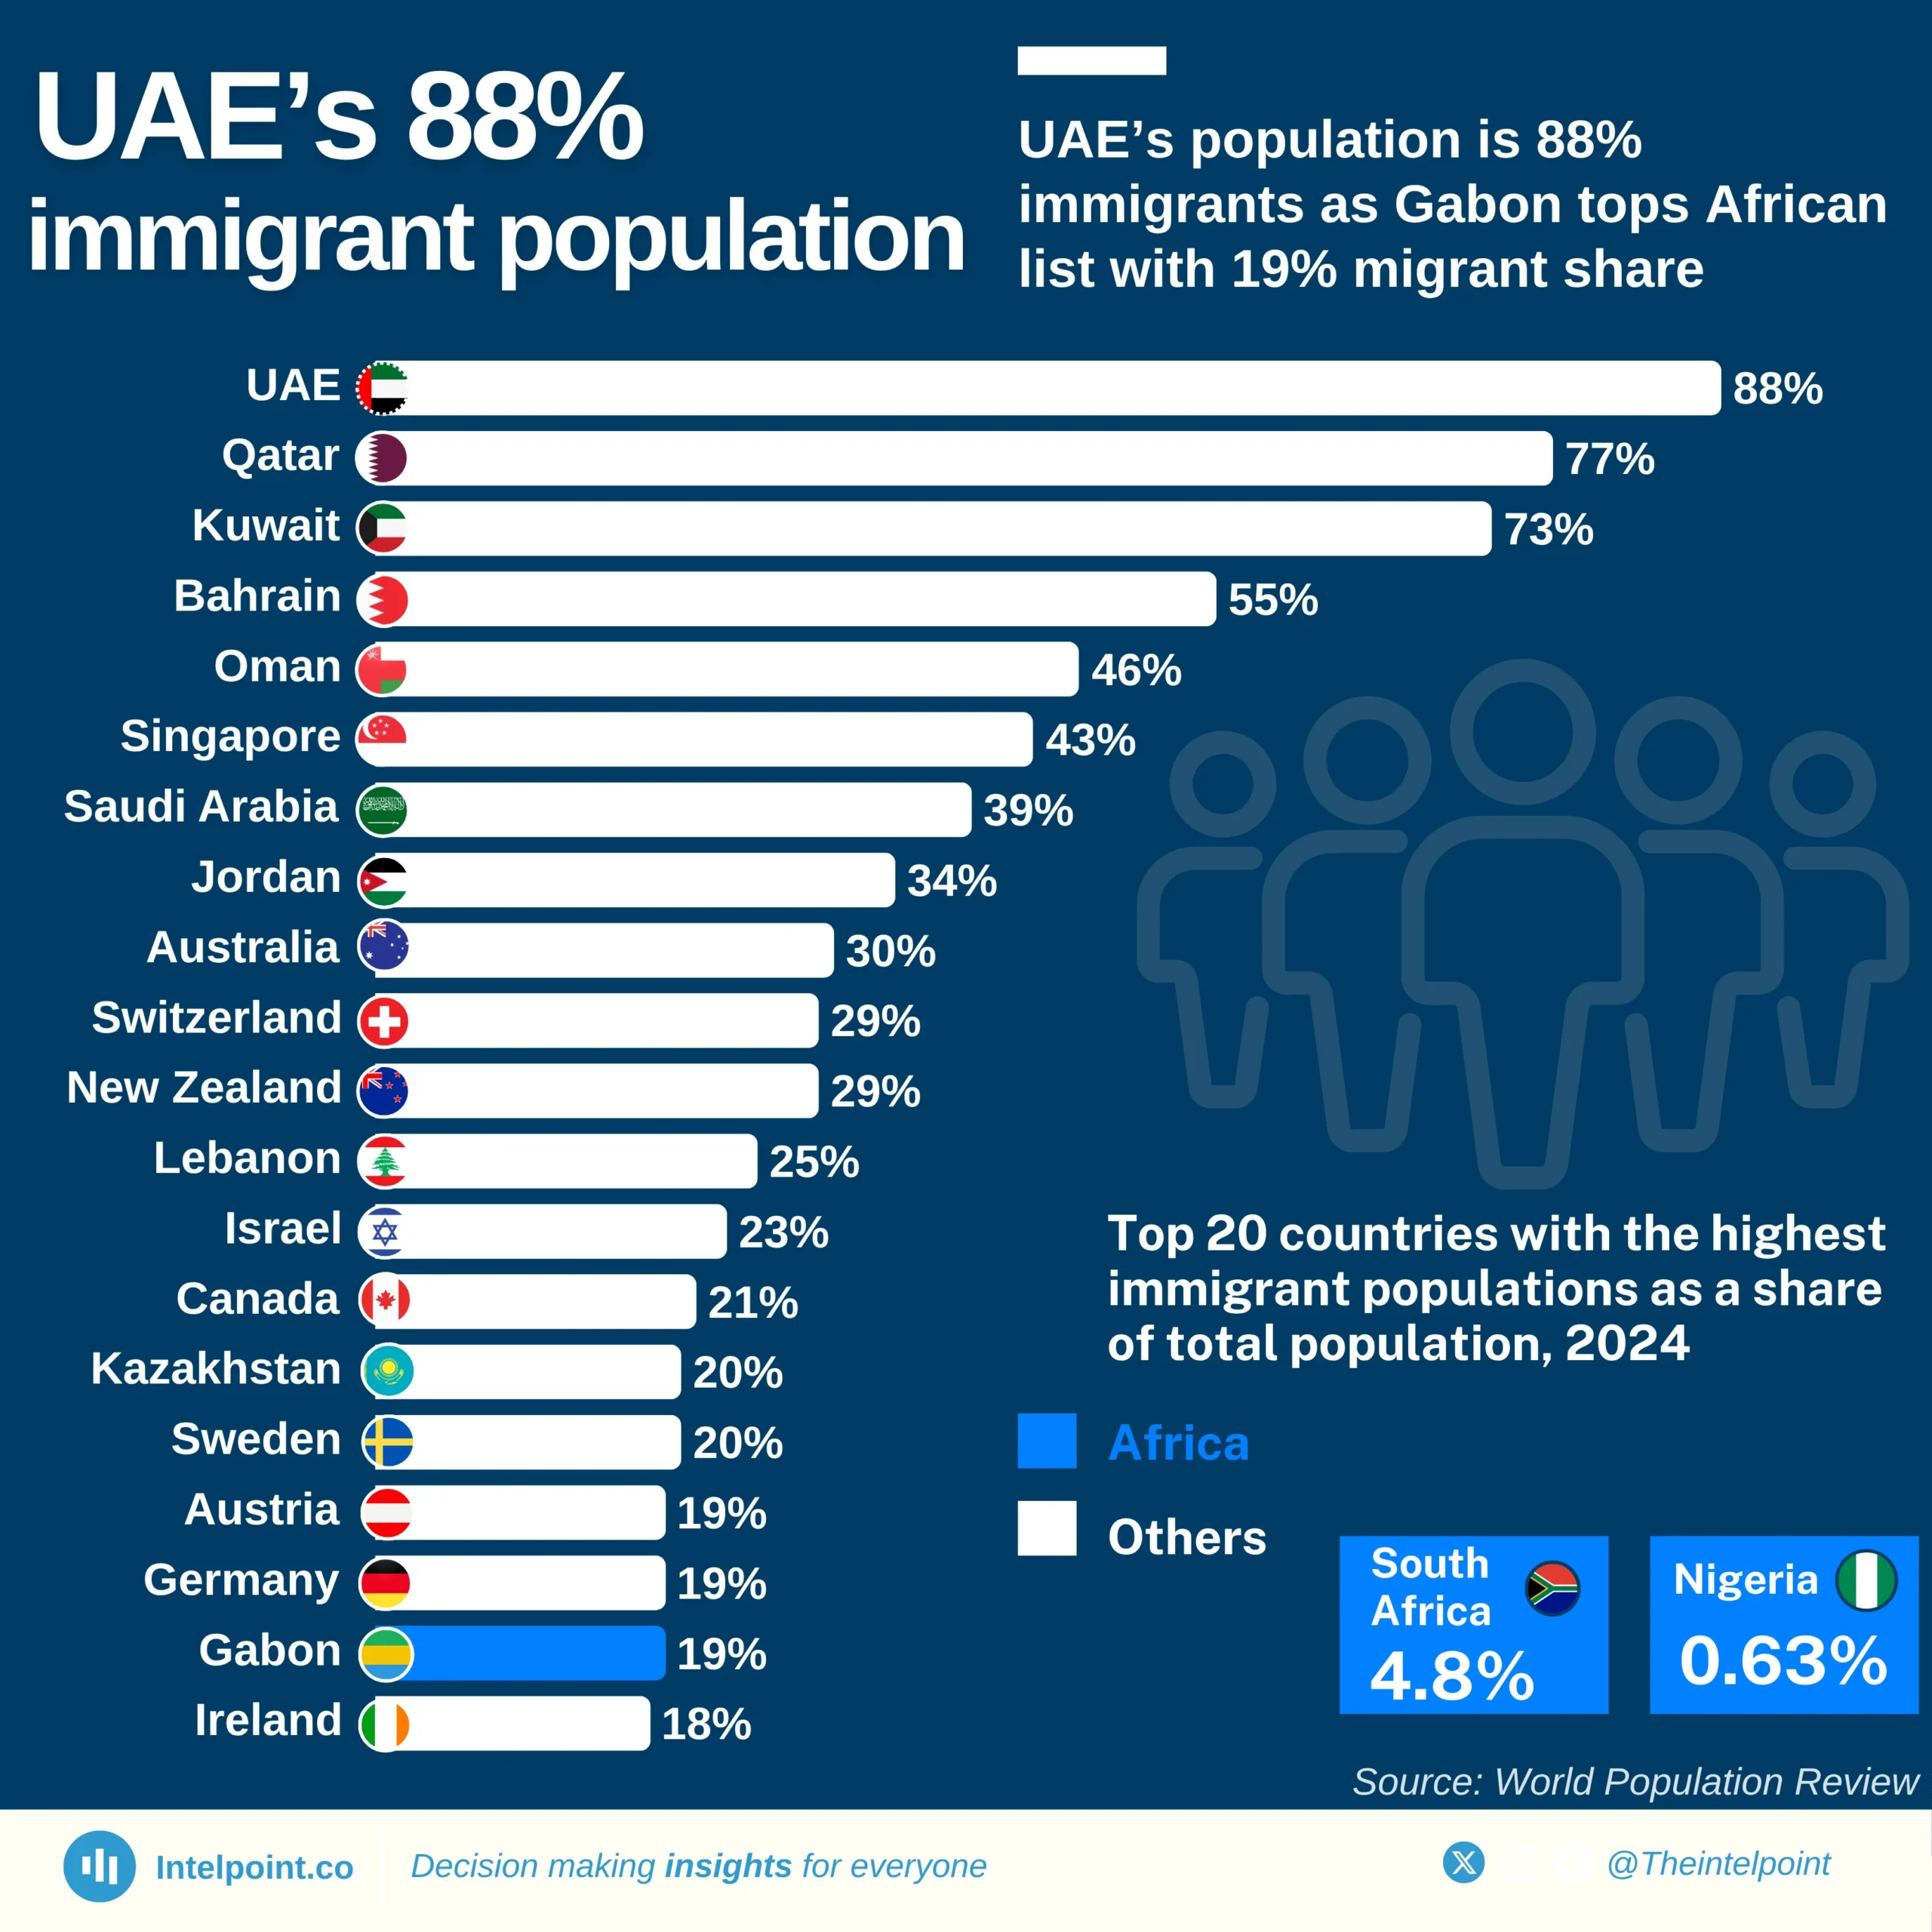
The United Arab Emirates tops the list with immigrants making up 88% of its total population.
Qatar follows closely with 87% of its residents being immigrants.
Kuwait (73%) and Bahrain (55%) also feature prominently, showing a regional trend where nationals are a minority and foreign workers form the economic backbone
Middle Eastern dominance in the top rankings highlights how the Gulf region’s economic model is heavily dependent on imported labor and expatriate populations.